. 2024 Jun;56(6):1373-1387.
doi: 10.1038/s12276-024-01235-w. Epub 2024 Jun 3.

The m6A writer RBM15 drives the growth of triple-negative breast cancer cells through the stimulation of serine and glycine metabolism

Affiliations

The m6A writer RBM15 drives the growth of triple-negative breast cancer cells through the stimulation of serine and glycine metabolism

Su Hwan Park et al. Exp Mol Med. 2024 Jun.

Abstract

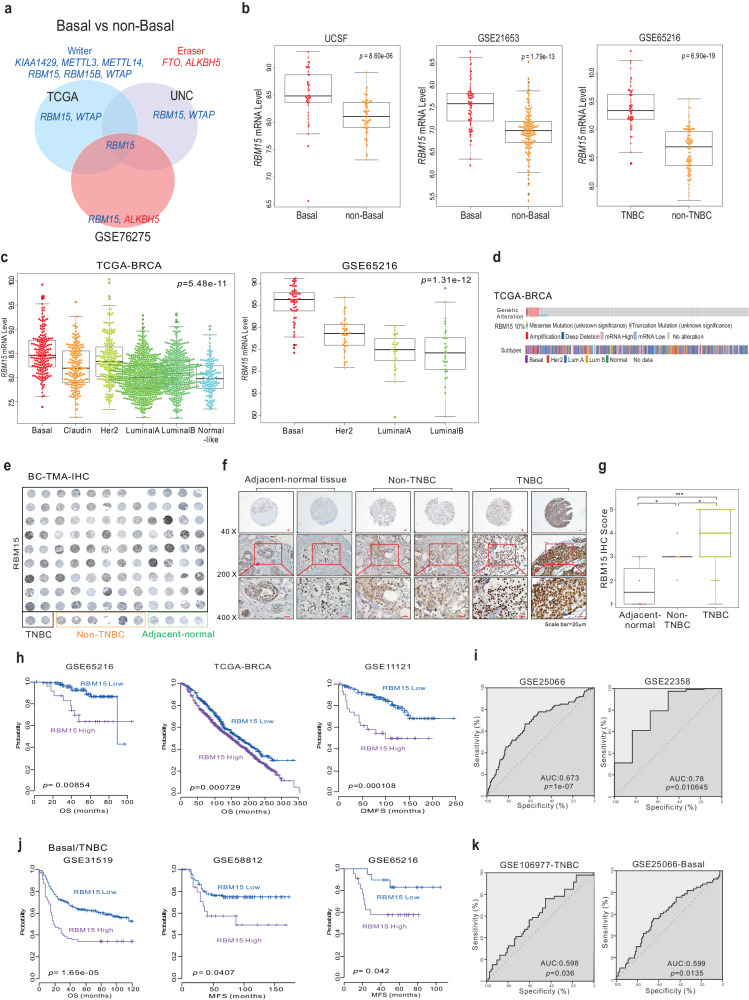
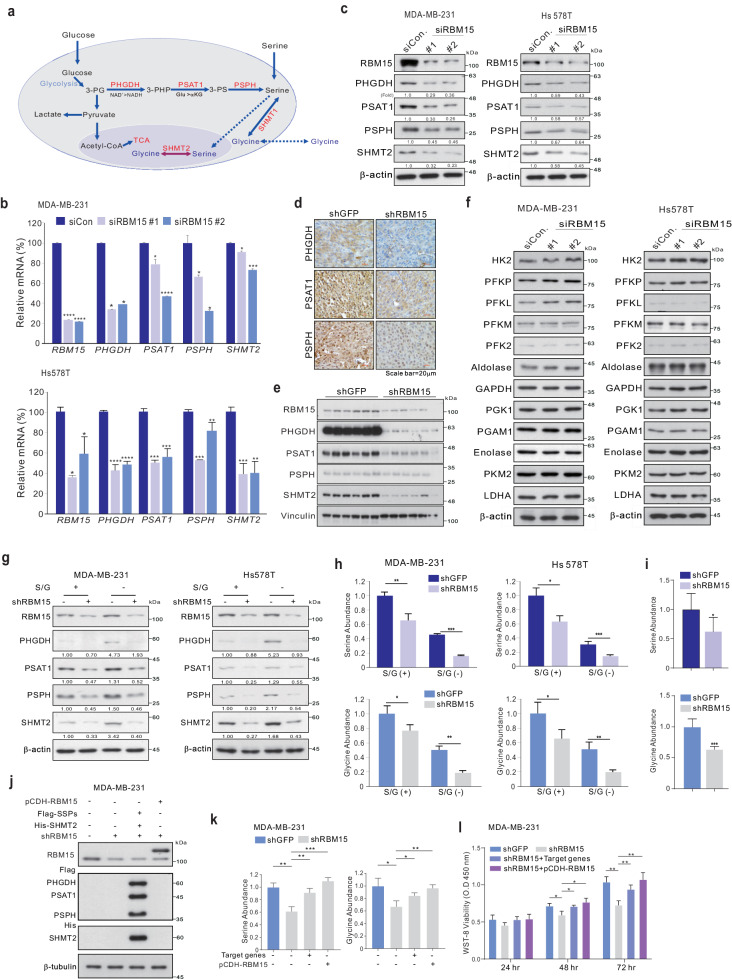
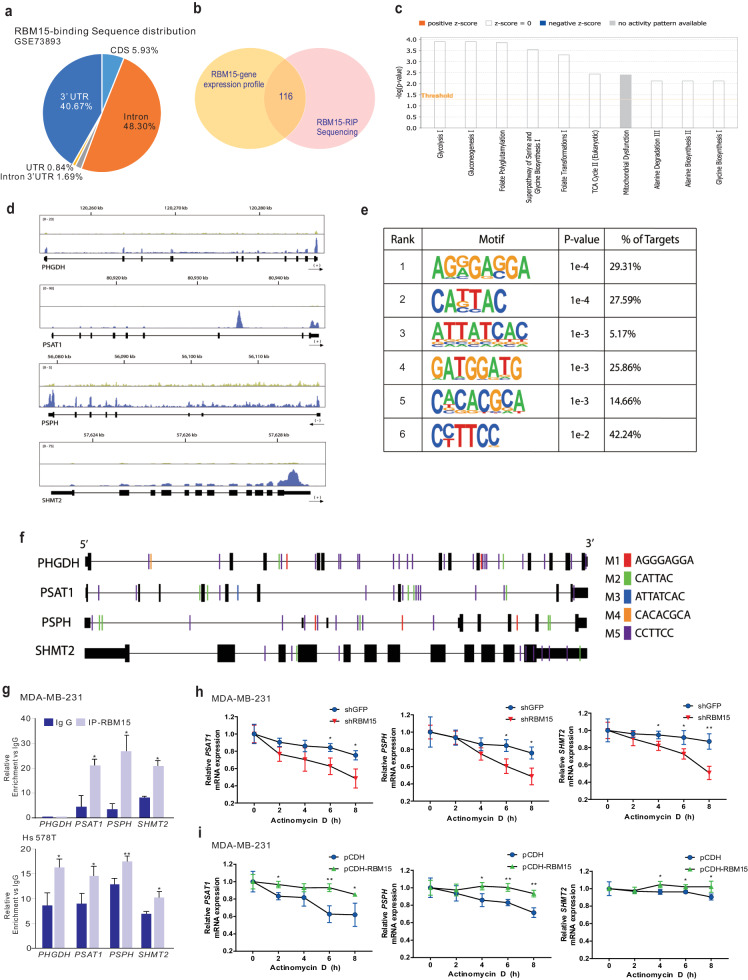
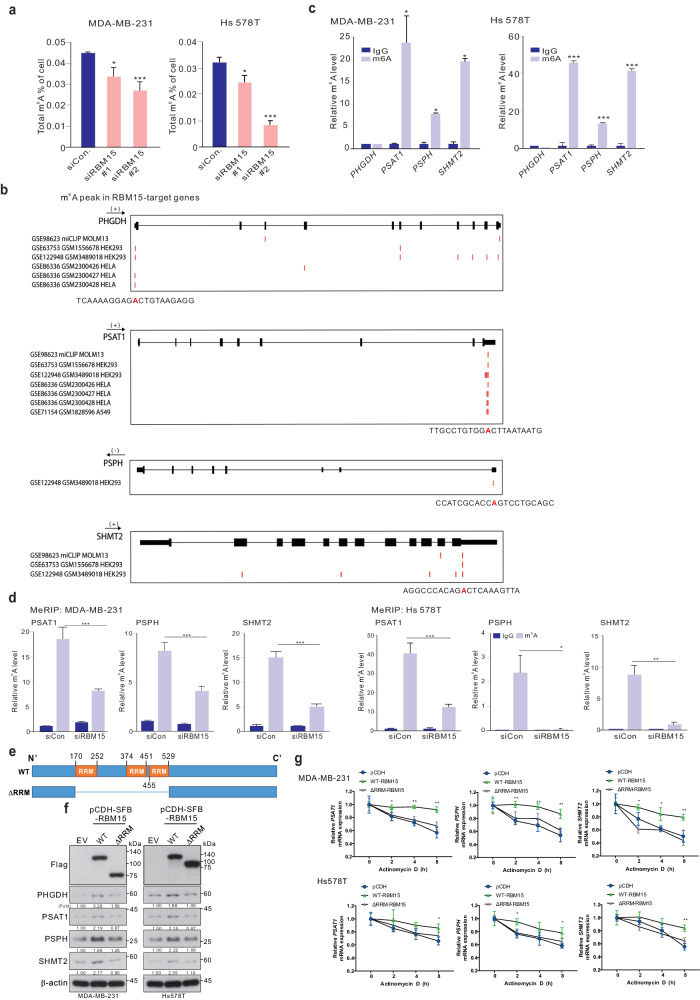
N6-adenosine methylation (m6A) is critical for controlling cancer cell growth and tumorigenesis. However, the function and detailed mechanism of how m6A methyltransferases modulate m6A levels on specific targets remain unknown. In the current study, we identified significantly elevated levels of RBM15, an m6A writer, in basal-like breast cancer (BC) patients compared to nonbasal-like BC patients and linked this increase to worse clinical outcomes. Gene expression profiling revealed correlations between RBM15 and serine and glycine metabolic genes, including PHGDH, PSAT1, PSPH, and SHMT2. RBM15 influences m6A levels and, specifically, the m6A levels of serine and glycine metabolic genes via direct binding to target RNA. The effects of RBM15 on cell growth were largely dependent on serine and glycine metabolism. Thus, RBM15 coordinates cancer cell growth through altered serine and glycine metabolism, suggesting that RBM15 is a new therapeutic target in BC.


Conflict of interest statement

The authors declare no competing interests.

Figures

Fig. 1
Fig. 1. RBM15 expression and clinical outcomes in BC patients.
a Venn diagram of genes showing significant differential expression between basal and non-basal BC tissues in three independent BC patient cohorts. A univariate test using class comparison analysis in the BRB array tool was performed. b RBM15 mRNA expression (log2) levels in basal/TNBC patients and non-basal/TNBC patients. c Molecular subtypes of RBM15 in the indicated cohorts. d Gene alteration of RBM15 in the TCGA-BRCA cohort. eg IHC staining of breast cancer tissue specimens from a TMA slide was performed with an RBM15 antibody. Representative images of IHC staining of the specimens (e, f) and a graph of the results of IHC quantification (g). Student’s t test was applied for statistical significance (*p < 0.05, ***p < 0.005). h, j Patients in the indicated BC cohorts or basal/TNBC-specific cohorts were dichotomized by relatively high or relatively low RBM15 expression and were considered for plotting. The differences between these groups were significant as indicated (log‐rank test). (i, k) ROC curve analysis of the RBM15 expression-related probability of recurrence in the BC cohort (i) and basal/TNBC cohort (k). ROC curve analysis was performed to evaluate the correlation of RBM15 gene expression levels with overall survival by determining the area under the curve (AUC), which was estimated through the concordance index. The corresponding p values were determined using one-sided Wilcoxon signed-rank tests.
Fig. 2
Fig. 2. RBM15 contributes to the growth and motility of TNBC cells.
ag The indicated TNBC cells were stably transfected with shRBM15 or control shRNA (shGFP) and analyzed by western blotting (WB) analysis using the indicated antibodies (a) and by qRT‒PCR analysis (b). The infected cells were analyzed by a proliferation assay (CCK-8 assay) (c), a colony formation assay (d), and FACS analysis (e). The infected cells were subjected to cell migration assays using Boyden chambers (f). Boyden chamber Transwell assays were conducted without ECM for 36 h, and the migratory capacity of the cells was quantified by counting the number of stained cells. Cell invasion was analyzed using Boyden chambers, with Matrigel functioning as the ECM (g). The cells in the invasion assay were incubated for 36 h at 37 °C and stained with crystal violet. All the cells were quantified. hk Xenograft experiments. MDA-MB-231 cells were infected with shRBM15 or control shRNA (shGFP) and selected with puromycin. After the infected MDA-MB-231 cells were injected into nude mice (h), the tumor volumes (i) and weights (j) were measured (n = 10). A representative IHC analysis of mouse samples was performed (k). All results are expressed as the means ± standard deviations (SDs) from three independent replicates (*p < 0.05, **p < 0.01, ***p < 0.005, and ****p < 0.001).
Fig. 3
Fig. 3. RBM15 gene signatures are associated with cancer metabolism.
a Gene expression signatures specific to the loss of RBM15 expression via shRBM15 in two TNBC cell lines. Genes in the Venn diagram were selected by applying class comparison analysis via the BRB array tool (p < 0.001). The gene expression profiles are presented in matrix format. In this matrix, red and blue indicate relatively high and low expression levels, respectively, as indicated in the scale bar (log2-transformed scale). Genes associated with oncogenic potential are listed. b Schematic diagram of prediction model generation and evaluation of predicted outcomes based on a differentially expressed gene signature of RBM15 in BC cells. c A differentially expressed gene signature was used to construct a series of classifiers that estimated the probability of how much the expression pattern of BC patients was similar to the shared signature; control signature (CS) vs. knockdown signature (KS). K‒M plots of the OS of breast cancer patients in the TCGA-BRCA cohort were generated using the gene expression signature as a classifier. The differences between groups were significant as indicated (log-rank test). LOOCV leave-one-out cross-validation, CCP compound covariate predictor, 1NN one nearest neighbor, 3NN three nearest neighbors, NC nearest centroid, SVM support vector machine, LDA linear discriminator analysis. d Ingenuity pathway analysis (IPA) of genes differentially expressed after RBM15 silencing. e, f The indicated cells were infected or transfected with the indicated shRNA or siRNA. The cells were used for qRT‒PCR (e) and western blot (f) analyses of RBM15-associated genes in TNBC cells. The data are expressed as the means ± standard deviations (SDs) from three independent replicates. Student’s t test was performed to determine statistical significance (*p < 0.05, **p < 0.01, ***p < 0.005, and ****p < 0.001).
Fig. 4
Fig. 4. RBM15 regulates serine and glycine metabolism to induce BC cell growth.
a A diagram depicting serine and glycine metabolism. b, c, f The indicated TNBC cells were transfected with siCon or siRBM15 and subjected to qRT‒PCR analysis with the indicated primers (b) and WB analysis (c, f) with the indicated antibodies. d, e IHC (d) and WB (e) analyses of RBM15 target genes in the mouse samples used in Fig. 2h. The indicated TNBC cells were infected with shRBM15 or shGFP. The cells were maintained for 5 days. The cells were used for WB analysis (g) and for detecting serine and glycine levels using colorimetric kits (h) (S/G: serine and glycine). i Serine and glycine metabolite levels were measured in the mouse samples used in Fig. 2h. jl MDA-MB-231 cells were infected with shRBM15 or shGFP and transfected with Flag or His-tagged SSP cDNA. The cells were subjected to WB analysis with the indicated antibodies (j), serine and glycine assays (k), and WST-8 assays (l). The data are expressed as the means ± standard deviations (SDs) from three independent replicates. Student’s t test was performed to determine statistical significance (*p < 0.05, **p < 0.01, ***p < 0.005, and ****p < 0.001).
Fig. 5
Fig. 5. RBM15 directly regulates genes involved in serine and glycine metabolism in BC patients.
a RIP-seq data (GSE73893) were processed for sequence distribution. b Comparison of gene expression data and RIP-seq data using a Venn diagram. c IPA analysis with comparison data. d UCSC genome browser view of RIP-seq reads mapped to PHGDH, PSAT1, PSPH, and SHMT2. e Significantly enriched RNA motifs among the RIP-seq data. f Sequence alignment of the PHGDH, PSAT1, PSPH, and SHMT2 genomic loci based on the RBM15 binding motif. g RIP analyses of MDA-MB-231 and Hs 578 T cells were performed using the indicated antibodies. Next, qRT‒PCR analysis was performed using primers against the PHGDH, PSAT1, PSPH, and SHMT2 mRNAs. h, i MDA-MB-231 cells were infected with shRBM15 or shGFP (h) and pCDH-RBM15 or empty vector (i). After infection, the cells were treated with DMSO or actinomycin D (Act D) and harvested at the indicated time points. Total RNA was extracted from the indicated cells and analyzed by qRT‒PCR with the indicated primers. The RNA level is designated the RNA half-life. All results are expressed as the means ± standard deviations (SDs) from replicates (*p < 0.05, **p < 0.01, ***p < 0.005, and ****p < 0.001).
Fig. 6
Fig. 6. RBM15 regulates the m6A modification of serine and glycine metabolic genes.
a The m6A content of total RNA in MDA-MB-231 and Hs578T BC cells with or without RBM15 silencing was determined. b The MeRIP-seq peaks of the indicated genes from the Gene Expression Omnibus were aligned. The methylated adenosine base is denoted with a red box and red “A”. c Methylated RNA in MDA-MB-231 and Hs578T cells. d MDA-MB-231 and Hs 578 T cells were transfected with siRBM15 or siCon and immunoprecipitated with a m6A antibody. Next, qRT‒PCR analysis was performed using primers against the PSAT1, PSPH, and SHMT2 mRNAs. eg Diagram of the RBM15 mutant construct. e MDA-MB-231 and Hs578T cells were stably infected with SFB (S protein, Flag, and streptavidin-binding peptide)-tagged WT RBM15 or ΔRRM-RBM15. The infected cells were harvested, and protein expression levels were analyzed by WB using the indicated antibodies (f). Then, the infected cells were treated with DMSO or actinomycin D (Act D) and harvested at the indicated time points for qRT‒PCR with the indicated primers (g). The data are expressed as the means ± SDs of triplicate samples (*p < 0.05, **p < 0.01, ***p < 0.005, and ****p < 0.001).
Fig. 7
Fig. 7. SSP gene regulation by RBM15 is dependent on the m6A writer METTL3/14.
a MDA-MB-231 and Hs 578T cells were transfected with the indicated shRNAs, and the cell lysates were subjected to WB analysis with the indicated antibodies. b The infected cells were treated with DMSO or actinomycin D (Act D) and harvested at the indicated time points for qRT‒PCR. c, d MDA-MB-231 and Hs 578T cells were transfected with the indicated shRNAs and Flag-tagged RBM15 or empty vector. The infected cells were analyzed by WB (c) or qRT‒PCR (d) using the indicated antibodies and primers, respectively. eg Diagram of the RBM15 mutant construct (e). MDA-MB-231 and Hs 578T cells were transfected with Flag-tagged RBM15 or empty vector and analyzed by WB using the indicated antibodies (f). The infected cells were treated with DMSO or actinomycin D (Act D) and harvested at the indicated time points for qRT‒PCR with the indicated primers (g). The data are expressed as the means ± SDs of triplicate samples (*p < 0.05, **p < 0.01, and ***p < 0.005).
Fig. 8
Fig. 8. Clinical implications of RBM15 target genes and clinical efficacy of RBM15 in BC patients.
a Molecular subtypes of PHGDH, PSAT1, PSPH, and SHMT2 in the TCGA-BRCA cohort. b Correlations between RBM15 and PHGDH, PSAT1, PSPH, and SHMT2 gene expression in the indicated TCGA-BRCA cohort. Scatter plots of RBM15 and related genes in the cohorts are shown for the indicated cohorts. c, d Kaplan‒Meier plots of OS outcomes in patients from the TCGA-BRCA cohort. e ROC curve analysis was performed to assess the correlation of RBM15 gene expression levels with chemotherapy response by determining the area under the curve (AUC), which was estimated through the concordance index. The corresponding p values were determined using one-sided Wilcoxon’s signed-rank test. fh After MDA-MB-231 cells were injected into nude mice, the indicated siRNAs containing CH-NPs were administered according to the indicated treatment schedule (f). A representative image of a tumor is shown. g The tumor volumes were measured (h). i Schematic diagram of the RBM15 gene regulatory mechanism. All results are expressed as the means ± standard deviations of three independent replicates (*p < 0.05 and **p < 0.01).

References

    1. Wei, C. M., Gershowitz, A. & Moss, B. Methylated nucleotides block 5′ terminus of HeLa cell messenger RNA. Cell4, 379–386 (1975). 10.1016/0092-8674(75)90158-0 - DOI - PubMed
    1. Zhao, B. S., Roundtree, I. A. & He, C. Post-transcriptional gene regulation by mRNA modifications. Nat. Rev. Mol. Cell Biol.18, 31–42 (2017). 10.1038/nrm.2016.132 - DOI - PMC - PubMed
    1. Oerum, S., Meynier, V., Catala, M. & Tisne, C. A comprehensive review of m6A/m6Am RNA methyltransferase structures. Nucleic Acids Res.49, 7239–7255 (2021). 10.1093/nar/gkab378 - DOI - PMC - PubMed
    1. Wang, W. et al. METTL3 promotes tumour development by decreasing APC expression mediated by APC mRNA N(6)-methyladenosine-dependent YTHDF binding. Nat. Commun12, 3803 (2021). 10.1038/s41467-021-23501-5 - DOI - PMC - PubMed
    1. Chen, X. Y., Zhang, J. & Zhu, J. S. The role of m(6)A RNA methylation in human cancer. Mol. Cancer18, 103 (2019). 10.1186/s12943-019-1033-z - DOI - PMC - PubMed

MeSH terms

LinkOut - more resources