. 2024 Jun 3;9(1):142.
doi: 10.1038/s41392-024-01853-w.

Antitumor efficacy and potential mechanism of FAP-targeted radioligand therapy combined with immune checkpoint blockade

Affiliations

Antitumor efficacy and potential mechanism of FAP-targeted radioligand therapy combined with immune checkpoint blockade

Liang Zhao et al. Signal Transduct Target Ther. .

Abstract

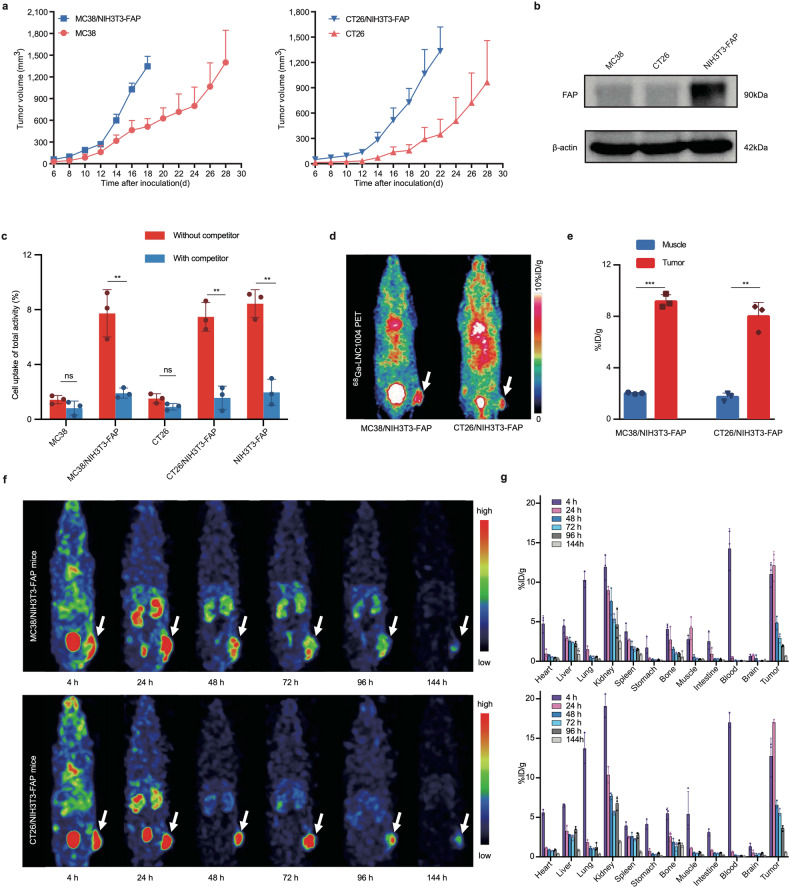
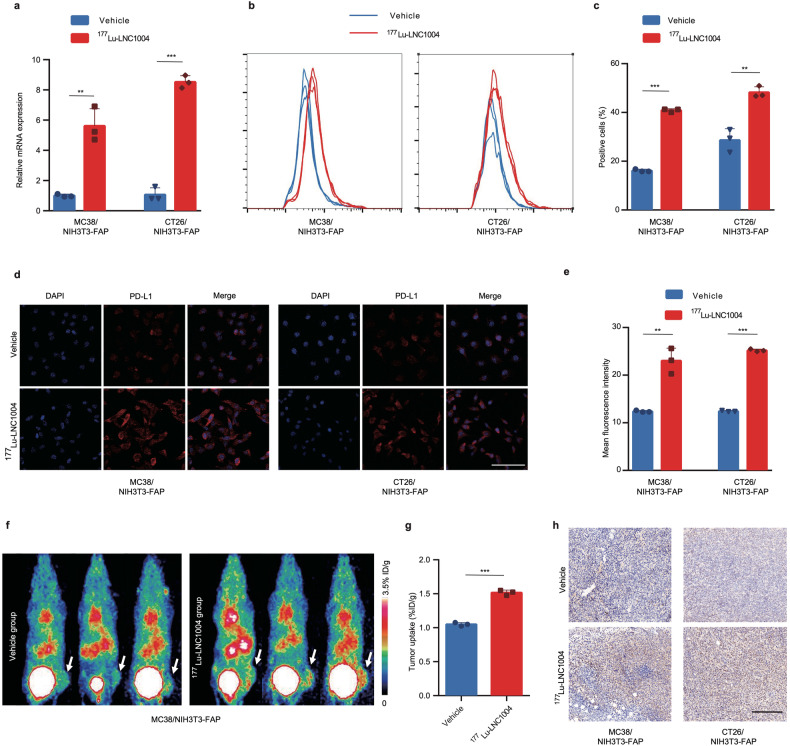
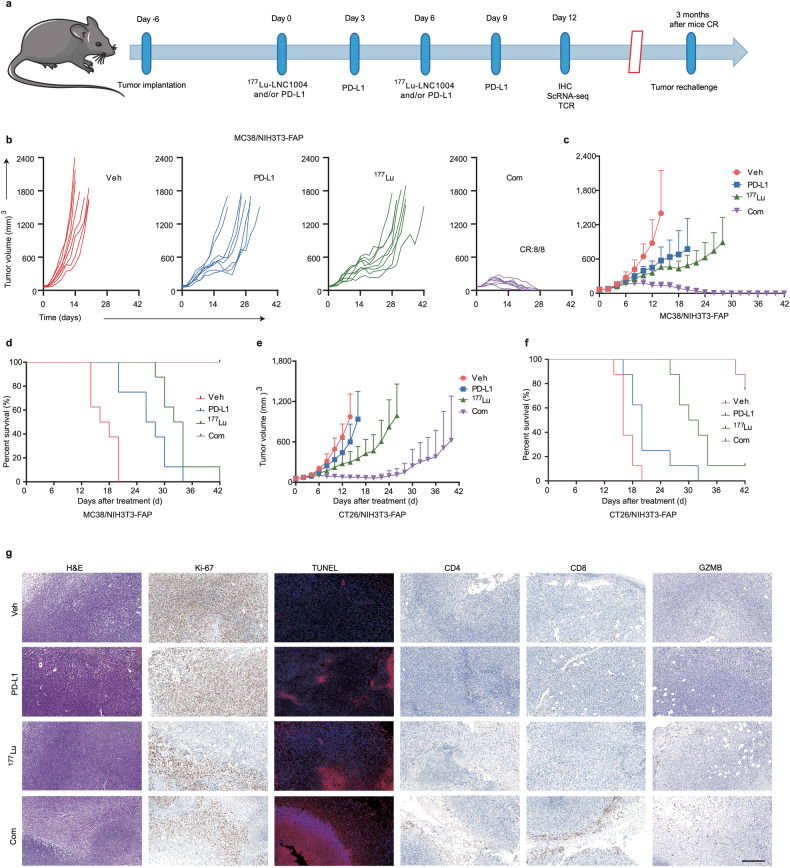
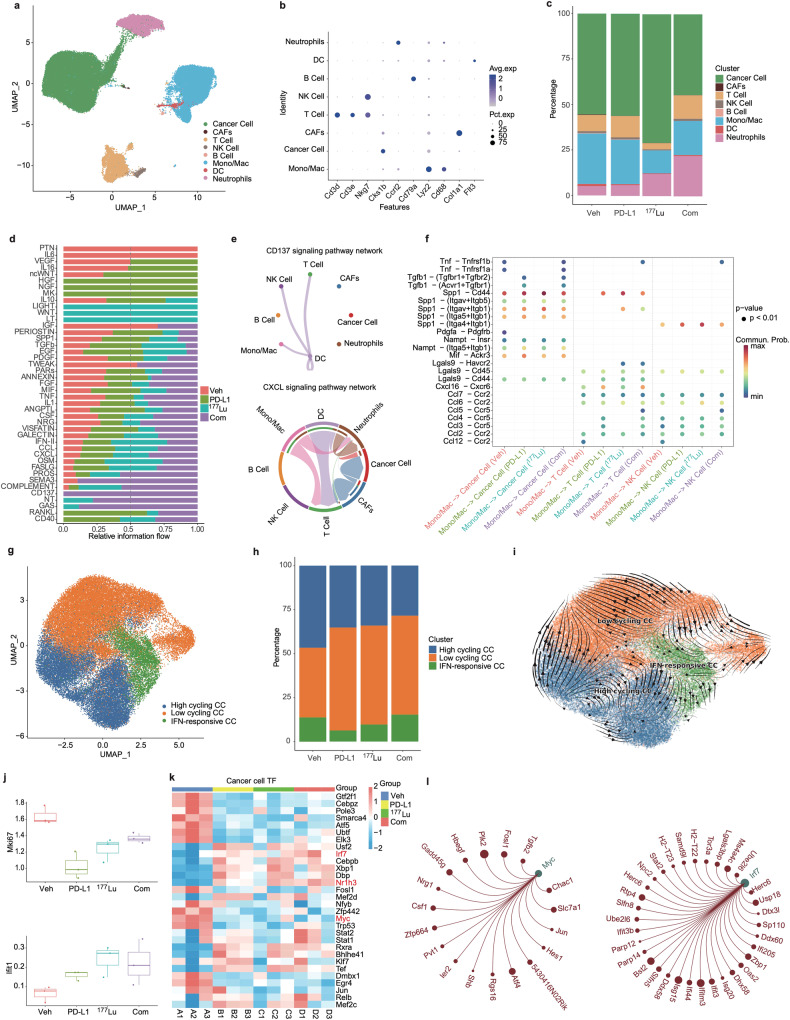
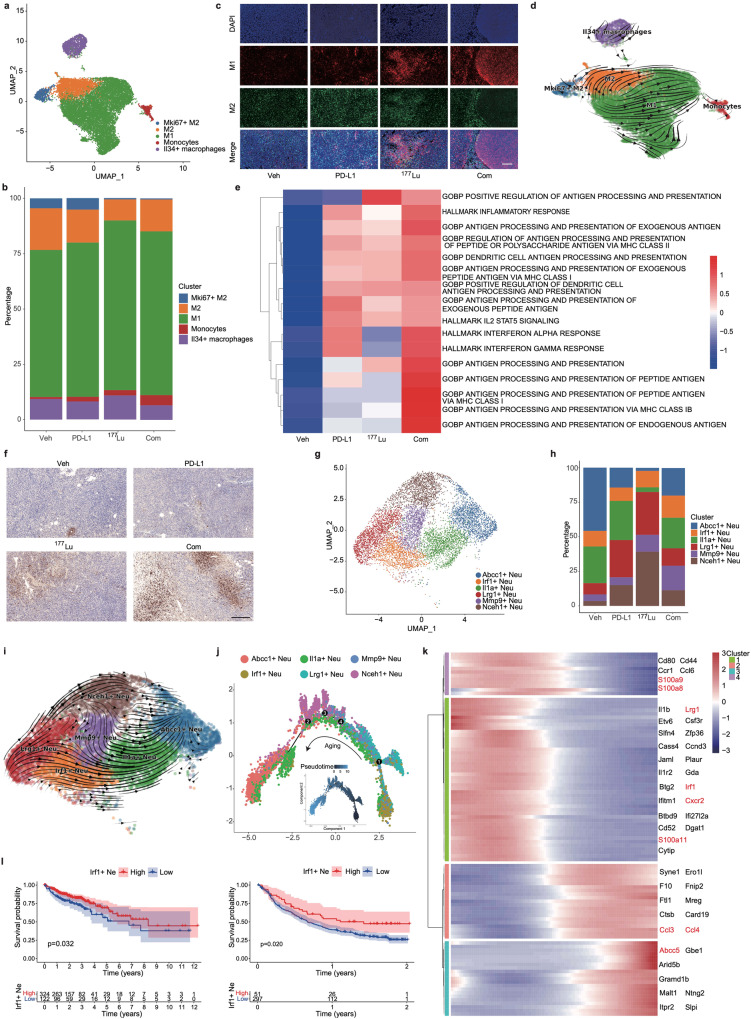
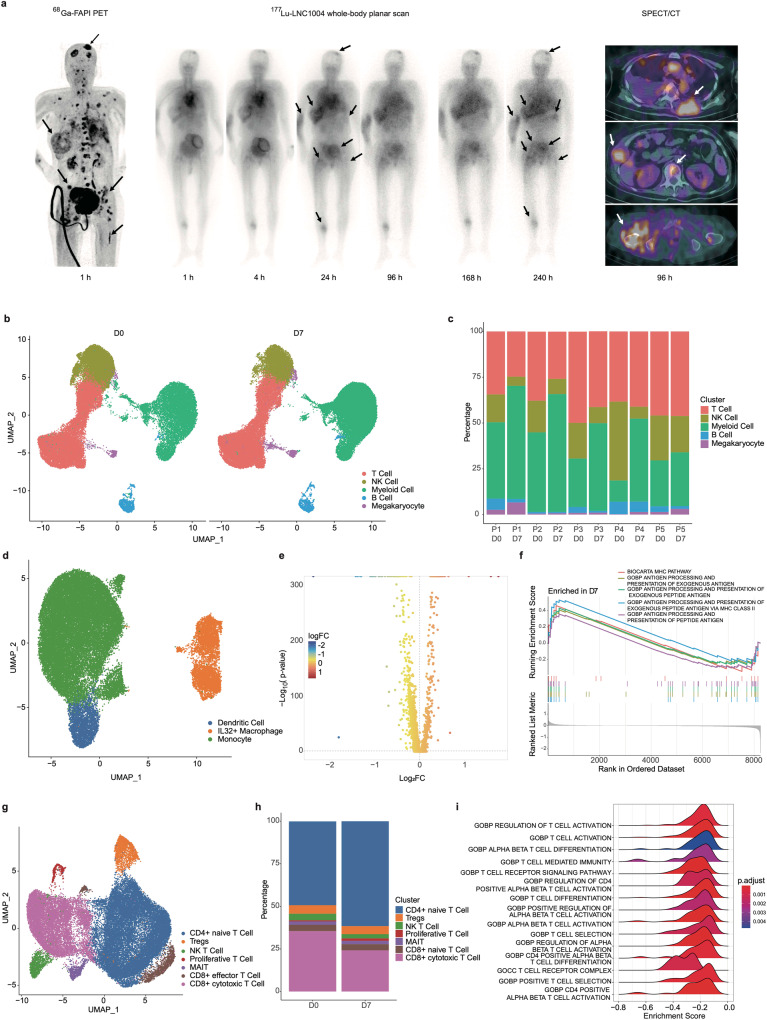
Radiotherapy combined with immune checkpoint blockade holds great promise for synergistic antitumor efficacy. Targeted radionuclide therapy delivers radiation directly to tumor sites. LNC1004 is a fibroblast activation protein (FAP)-targeting radiopharmaceutical, conjugated with the albumin binder Evans Blue, which has demonstrated enhanced tumor uptake and retention in previous preclinical and clinical studies. Herein, we demonstrate that 68Ga/177Lu-labeled LNC1004 exhibits increased uptake and prolonged retention in MC38/NIH3T3-FAP and CT26/NIH3T3-FAP tumor xenografts. Radionuclide therapy with 177Lu-LNC1004 induced a transient upregulation of PD-L1 expression in tumor cells. The combination of 177Lu-LNC1004 and anti-PD-L1 immunotherapy led to complete eradication of all tumors in MC38/NIH3T3-FAP tumor-bearing mice, with mice showing 100% tumor rejection upon rechallenge. Immunohistochemistry, single-cell RNA sequencing (scRNA-seq), and TCR sequencing revealed that combination therapy reprogrammed the tumor microenvironment in mice to foster antitumor immunity by suppressing malignant progression and increasing cell-to-cell communication, CD8+ T-cell activation and expansion, M1 macrophage counts, antitumor activity of neutrophils, and T-cell receptor diversity. A preliminary clinical study demonstrated that 177Lu-LNC1004 was well-tolerated and effective in patients with refractory cancers. Further, scRNA-seq of peripheral blood mononuclear cells underscored the importance of addressing immune evasion through immune checkpoint blockade treatment. This was emphasized by the observed increase in antigen processing and presentation juxtaposed with T cell inactivation. In conclusion, our data supported the efficacy of immunotherapy combined with 177Lu-LNC1004 for cancer patients with FAP-positive tumors.


Conflict of interest statement

X. Chen is a co-founder of the Yantai LNC Biotechnology. The remaining authors declare no competing interests.

Figures

Fig. 1
Fig. 1
In vitro and in vivo evaluation of 68Ga/177Lu-labeled LNC1004. a Growth curves of tumors in mice following implantation of either MC38 or CT26 cells compared with those co-implanted with NIH3T3-FAP cells (n = 5/group). b FAP expression in MC38, CT26, and NIH3T3-FAP cells determined using western blotting. c Cell uptake assay of 68Ga-LNC1004 on MC38, CT26, NIH3T3-FAP, MC38/NIH3T3-FAP, and CT26/NIH3T3-FAP cells. This assay was complemented with a blocking experiment to validate specificity (n = 3/group). d Representative static PET images of 68Ga-LNC1004 in MC38/NIH3T3-FAP and CT26/NIH3T3-FAP tumor-bearing mice (n = 3/group). e PET quantification data for 68Ga-LNC1004 in MC38/NIH3T3-FAP and CT26/NIH3T3-FAP tumor-bearing mice (n = 3/group). f, g SPECT MIP images and biodistribution data of 177Lu-LNC1004 from 4 to 144 h after injection in mice with MC38/NIH3T3-FAP and CT26/NIH3T3-FAP tumor models (n = 3/group)
Fig. 2
Fig. 2
PD-L1 expression is significantly upregulated both in vitro and in vivo after treatment with 177Lu-LNC1004. a Bar plot derived from quantitative RT-PCR used to assess the mRNA levels of PD-L1 in MC38/NIH3T3-FAP and CT26/NIH3T3-FAP cells after 24 h stimulation with 177Lu-LNC1004 (n = 3/group). b, c Representative histograms and bar plot derived from flow cytometry showing the upregulation in PD-L1 expression after 24 h of stimulation with 177Lu-LNC1004 (n = 3/group). d, e Confocal images and bar plot derived from PD-L1 immunofluorescence staining indicate enhanced expression of PD-L1 after 24 h exposure to 177Lu-LNC1004 (n = 3/group). Scale bar: 100 μm. f Representative static PET maximum intensity projection (MIP) images of 68Ga-DOTA-SETSKSF in MC38/NIH3T3-FAP tumor-bearing mice (n = 3/group). g PET quantification data for 68Ga-DOTA-SETSKSF in MC38/NIH3T3-FAP tumor-bearing mice (n = 3/group). h Immunohistochemical staining of PD-L1 in tumor tissues. Scale bar: 200 μm
Fig. 3
Fig. 3
177Lu-LNC1004 radioligand therapy combined with anti-PD-L1 immunotherapy synergistically enhances antitumor efficacy. a Illustration of the therapeutic regimen and treatment timelines for mice bearing MC38/NIH3T3-FAP and CT26/NIH3T3-FAP tumor models (n = 8/group). b Individual tumor growth trajectories of MC38/NIH3T3-FAP tumor-bearing mice across diverse treatment groups. c, d Tumor growth and survival rate graphs for MC38/NIH3T3-FAP tumor-bearing mice in the four distinct treatment groups. e, f Tumor growth and survival rate graphs for CT26/NIH3T3-FAP tumor-bearing mice in the four different treatment groups. g Histological examination of resected tumor tissues from MC38/NIH3T3-FAP tumor-bearing mice, featuring hematoxylin & eosin (H&E) staining and immunohistochemical staining for Ki-67, TUNEL, CD4, CD8, and GZMB posttreatment. Scale bar: 200 μm
Fig. 4
Fig. 4
Cell type identification and cancer cell characterization in MC38/NIH3T3-FAP tumor models. a UMAP plots of all cells. b Dot plots reveal characteristic marker genes across different cellular fractions. c Bar charts comparing the major cellular lineages across various treatments. d Bar charts depict the varied contribution of pathways to cellular communication. e Interaction networks emphasize specific cell-to-cell interactions via the CD137 (top) and CXCL (bottom) pathways in the combination treatment group. f Highlighted ligand-receptor interactions from Mono/Mac with cancer cells, T-cells, and NK cells, as indicated by CellChat. g UMAP plots of cancer cells. h Bar charts show the distribution of tumor cell subpopulations. i RNA trajectory analysis reflects the evolutionary progression of tumor cells. j Box line plots representing mean Mki67 and Ifit1 expression in cancer cells. k SCENIC analysis delineating differences in AUC values of transcription factors (TFs). l Regulatory network diagram centered on TFs Myc and Irf7
Fig. 5
Fig. 5
Differences in T-cell characteristics and TCRs across the four treatment groups. a UAMP plots of T-cell subclusters. b Bar charts showing the proportions of T-cell subclusters. c Heatmap illustrating the differentially active Gene Set Variation Analysis (GSVA)-enriched pathways associated with T-cells. d Box line plots of differential CD69 and GZMB expression in T-cells. e The D50 index, indicating TCR diversity, was analyzed and compared across the four treatment groups. f Chord plot illustrating the frequency of distinct V-J gene pairings in the combination treatment group. The V-J gene pairing frequencies in the other three treatment groups are shown in Supplementary Fig. 10c–e. g Graphical representation of clone frequency distribution based on the nucleotide CDR3 sequence rank (such as 1:10, 11:100, 101:1000, etc.). Each column represents the frequency distribution of T-cell clones within an individual tumor sample. The groups A-D correspond to the vehicle group, αPD-L1-treated group, 177Lu-LNC1004-treated group, and the combination therapy group with αPD-L1 and 177Lu-LNC1004, respectively. h Heatmap showing the overlap of immune repertoire clone types between the four treatment groups, as measured by the Jaccard index. The groups A–D correspond to the vehicle group, αPD-L1-treated group, 177Lu-LNC1004-treated group, and the combination therapy group with αPD-L1 and 177Lu-LNC1004, respectively. i Sequence logo diagrams present the CDR3 amino acid composition of the notably expanded TCR clonal family in the vehicle (upper) and combination treatment (lower) groups. These sequence logo diagrams for the αPD-L1-treated group and the 177Lu-LNC1004-treated group are shown in Supplementary Fig. 10f
Fig. 6
Fig. 6
Comparative analysis of Mono/Mac and neutrophil characteristics across the four treatment groups. a UMAP plots of Mono/Mac subclusters. b Bar charts showing the distribution of Mono/Mac subpopulations. c Immunofluorescence staining of M1 and M2 macrophages in tumor tissues. Scale bar: 200 μm. d RNA trajectory analysis reflecting the evolutionary progression of Mono/Mac subclusters. e Heatmap illustrating the differential activity of GSVA-enriched pathways associated with Mono/Mac. f Immunohistochemical staining of Ly6G in tumor samples. Scale bar: 200 μm. g UMAP plots of neutrophil clusters. h Bar charts illustrating the distribution of neutrophil subpopulations. i RNA trajectory analysis reflects the evolutionary progression of neutrophil subtypes. j Monocle2 pseudo-temporal analysis reveals the evolutionary trends within neutrophil subclusters. k Heatmap of the top differentially expressed genes in neutrophils throughout pseudotime. l Kaplan–Meier survival plots for patients with colon (TCGA data, left) and bladder (IMgivo210 data, right) cancer. Comparative analysis of survival trajectories for IRF1+ neutrophil scores using the log-rank test
Fig. 7
Fig. 7
Single-cell RNA sequencing (scRNA-seq) of peripheral blood mononuclear cells (PBMCs) before and after treatment. a Representative images from PET, serial whole-body planar scan, and SPECT/CT scans of a patient (metastatic breast cancer) who received 177Lu-LNC1004 therapy. b UMAP plot of all cells color-coded according to their major cell types based on canonical markers. c Bar charts display the distribution of the principal cellular lineages in individual patients pre- and posttreatment. d UMAP plot showing the subpopulations of myeloid cells prior to and after treatment. e Volcano plots of differentially expressed genes within myeloid cells pre- and posttreatment. f Gene Set Enrichment Analysis (GSEA) of differentially expressed genes between pre- and posttreatment. g UMAP plot showing T-cell subpopulations pre- and posttreatment. h Bar charts showing variations in the proportion of T-cell subtypes across patients pre- and posttreatment. i GSEA of differentially expressed genes within T-cells pre- and posttreatment

References

    1. Wu M, et al. Improvement of the anticancer efficacy of PD-1/PD-L1 blockade via combination therapy and PD-L1 regulation. J. Hematol. Oncol. 2022;15:24. doi: 10.1186/s13045-022-01242-2. - DOI - PMC - PubMed
    1. Gong X, et al. Combined radiotherapy and anti-PD-L1 Antibody synergistically enhances antitumor effect in non-small cell lung cancer. J. Thorac. Oncol. 2017;12:1085–1097. doi: 10.1016/j.jtho.2017.04.014. - DOI - PubMed
    1. Theelen W, et al. Pembrolizumab with or without radiotherapy for metastatic non-small-cell lung cancer: a pooled analysis of two randomised trials. Lancet Respir. Med. 2021;9:467–475. doi: 10.1016/S2213-2600(20)30391-X. - DOI - PubMed
    1. Chang JY, et al. Stereotactic ablative radiotherapy with or without immunotherapy for early-stage or isolated lung parenchymal recurrent node-negative non-small-cell lung cancer: an open-label, randomised, phase 2 trial. Lancet. 2023;402:871–881. doi: 10.1016/S0140-6736(23)01384-3. - DOI - PMC - PubMed
    1. Gill MR, Falzone N, Du Y, Vallis KA. Targeted radionuclide therapy in combined-modality regimens. Lancet Oncol. 2017;18:e414–e423. doi: 10.1016/S1470-2045(17)30379-0. - DOI - PubMed

Publication types

MeSH terms