Review
. 2024 Jun 3;11(1):16.
doi: 10.1186/s44156-024-00051-2.

The assessment of left ventricular diastolic function: guidance and recommendations from the British Society of Echocardiography

Affiliations
Review

The assessment of left ventricular diastolic function: guidance and recommendations from the British Society of Echocardiography

Shaun Robinson et al. Echo Res Pract. .

Abstract

Impairment of left ventricular (LV) diastolic function is common amongst those with left heart disease and is associated with significant morbidity. Given that, in simple terms, the ventricle can only eject the volume with which it fills and that approximately one half of hospitalisations for heart failure (HF) are in those with normal/'preserved' left ventricular ejection fraction (HFpEF) (Bianco et al. in JACC Cardiovasc Imaging. 13:258-271, 2020. 10.1016/j.jcmg.2018.12.035), where abnormalities of ventricular filling are the cause of symptoms, it is clear that the assessment of left ventricular diastolic function (LVDF) is crucial for understanding global cardiac function and for identifying the wider effects of disease processes. Invasive methods of measuring LV relaxation and filling pressures are considered the gold-standard for investigating diastolic function. However, the high temporal resolution of trans-thoracic echocardiography (TTE) with widely validated and reproducible measures available at the patient's bedside and without the need for invasive procedures involving ionising radiation have established echocardiography as the primary imaging modality. The comprehensive assessment of LVDF is therefore a fundamental element of the standard TTE (Robinson et al. in Echo Res Pract7:G59-G93, 2020. 10.1530/ERP-20-0026). However, the echocardiographic assessment of diastolic function is complex. In the broadest and most basic terms, ventricular diastole comprises an early filling phase when blood is drawn, by suction, into the ventricle as it rapidly recoils and lengthens following the preceding systolic contraction and shortening. This is followed in late diastole by distension of the compliant LV when atrial contraction actively contributes to ventricular filling. When LVDF is normal, ventricular filling is achieved at low pressure both at rest and during exertion. However, this basic description merely summarises the complex physiology that enables the diastolic process and defines it according to the mechanical method by which the ventricles fill, overlooking the myocardial function, properties of chamber compliance and pressure differentials that determine the capacity for LV filling. Unlike ventricular systolic function where single parameters are utilised to define myocardial performance (LV ejection fraction (LVEF) and Global Longitudinal Strain (GLS)), the assessment of diastolic function relies on the interpretation of multiple myocardial and blood-flow velocity parameters, along with left atrial (LA) size and function, in order to diagnose the presence and degree of impairment. The echocardiographic assessment of diastolic function is therefore multifaceted and complex, requiring an algorithmic approach that incorporates parameters of myocardial relaxation/recoil, chamber compliance and function under variable loading conditions and the intra-cavity pressures under which these processes occur. This guideline outlines a structured approach to the assessment of diastolic function and includes recommendations for the assessment of LV relaxation and filling pressures. Non-routine echocardiographic measures are described alongside guidance for application in specific circumstances. Provocative methods for revealing increased filling pressure on exertion are described and novel and emerging modalities considered. For rapid access to the core recommendations of the diastolic guideline, a quick-reference guide (additional file 1) accompanies the main guideline document. This describes in very brief detail the diastolic investigation in each patient group and includes all algorithms and core reference tables.

Keywords: Diastolic function; Filling pressures; HFpEF; Left atrial pressure.


Conflict of interest statement

Otto A. Smiseth is co-inventor of “Method for myocardial segment work analysis”, has filed patent on “Estimation of blood pressure in the heart”, and has received one speaker honorarium from GE Healthcare. SR is co-Editor-in-Chief of Echo Research and Practice. LR, DA, DO, AH, MS-S and MP are Associate Editors of Echo Research and Practice. NS is a member of the Echo Research and Practice Editorial Board.

Figures

Fig. 1
Fig. 1
Helical arrangement of myocardial fibres—Nakatani, 2011 [8]
Fig. 2
Fig. 2
Basal and apical rotational direction of myocardial contraction—Nakatani, 2011 [8]
Fig. 3
Fig. 3
Subendocardial and subepicardial rotational directions at the base and apex—from Nakatani, 2011 [8]
Fig. 4
Fig. 4
Recording of simultaneous LV and Ao pressures (the representation of LAP has been added)—O.Smiseth’s own work
Fig. 5
Fig. 5
Pressure–volume loop demonstrating changes in ventricular volume during filling and ejection with corresponding changes in intracavity pressure. The isovolumetric relaxation and contraction periods are highlighted [21]
Fig. 6
Fig. 6
The four phases of diastole shown on a spectral Doppler trace of mitral inflow (A) and mitral annular tissue-Doppler imaging (B)—(1) IVRT, (2) early filling, (3) diastasis, (4) late filling from atrial contraction
Fig. 7
Fig. 7
The phases of atrial function demonstrated using pressure volume loop—adapted from Negishi et al. The phases of the cardiac cycle have been highlighted on image A. Diastole has been divided into: E—early filling, D—diastasis and A—atrial contraction. The reservoir phase (red trace—1) occurs during ventricular systole: pulmonary venous blood enters the LA resulting in LA volume increasing from minimum to maximum. In normal circumstances, the associated increase in LA pressure is small, owing to atrial compliance and distensibility. Immediately after mitral valve opening, there is reduction in LA volume and pressure as blood enters the LV during the conduit phase (green trace—2). At a low enough HR there is a period between early and late diastolic filling where LA and LV pressures are close to equal with consequently minimal transmitral flow (dark blue trace—3). Finally, the atrium contracts, marking the onset of the pump phase (grey trace—4). This is accompanied by a rapid increase in LA pressure and blood is ejected from the LA into the LV with some retrograde flow into the PV’s (the A-reversal wave). Immediately after contraction, the LA recoils and relaxation commences (light blue trace—5), leading to the start of the reservoir phase [29]
Fig. 8
Fig. 8
Pulsed Wave Doppler spectral display of pulmonary vein flow. S1 and S2 waves reflect left atrial filling during LV systole (LA reservoir phase). The D wave reflects pulmonary vein flow during early ventricular diastole (LA conduit phase). The Ar wave reflects flow reversal within the pulmonary veins secondary to atrial contraction (LA pump phase)
Fig. 9
Fig. 9
Relative changes in LA and LV diastolic pressures in different stages of impaired diastolic function. LAP remains normal when relaxation is impaired but becomes elevated when LV compliance is decreased. [42] Adapted from Panesar, Dilveer and Burch
Fig. 10
Fig. 10
Atrial strain, with examples of different zero-reference points. Figure (a) displays a typical LA strain waveform while (b) demonstrates measured atrial strain parameters. On the lower left (c), the onset of the QRS has been chosen as the zero-reference point. With this method, the atrium is at the beginning of the reservoir phase and initially expands, resulting in a positive deflection (c). On the right, the p-wave is used as the zero-reference, and consequently the first deflection is negative as the atrium enters the pump phase (d). Red vertical arrow demonstrates peak reservoir strain, blue vertical arrow the passive contraction strain (conduit phase), and green vertical arrow active pump (contractile) strain (c and d). The choice of zero-reference point will systematically alter the values obtained, with the QRS-onset methodology (c) leading to systematically larger strain values than the p-wave methodology
Fig. 11
Fig. 11
Step-wise reduction in LA strain parameters as LV diastolic function worsens and LVFP increase. From Singh et al. [102]
Fig. 12
Fig. 12
PV Doppler: S1 and S2 waves occur in systole, contributed to by elastic recoil of the LA, LV systolic shortening and RV SV/SPAP propagating through the lungs. The D waves occurs with LV relaxation in early diastole while the Ar wave occurs in late diastole following atrial contraction
Fig. 13
Fig. 13
Deceleration slope of the PVS wave—DTPVS
Fig. 14
Fig. 14
Deceleration slope of the PVD wave—DTPVD
Fig. 15
Fig. 15
Measurement of the time difference between the onset of E and e′. Note the optimisation to decrease transit-time artefact and reduction of wall-filter/low-velocity reject to ensure signal onset is clearly seen
Fig. 16
Fig. 16
Measurement of A-wave transit time. The time-to-peak A wave has been measured in this case with the R-wave defined as the starting point. The short transit time of 22 ms is suggestive of decreased LV compliance
Fig. 17
Fig. 17
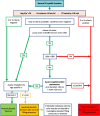
Algorithm for the assessment of LVDF in those with normal systolic function. It is recommended that the algorithm is not applied in the following conditions: severe MR/MS or MAC or MV replacement or repair
Fig. 18
Fig. 18
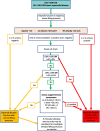
Algorithm for the assessment of LVDF in those with impaired systolic function or known myocardial disease. It is recommended that the algorithm is not applied in the following conditions: LBBB, RV apical pacing or resynchronisation pacing (CRT); LV assist devices
Fig. 19
Fig. 19
Algorithm for the estimation of LVFP in patients with AF. None of the parameters listed in the algorithm are of sufficient accuracy to be considered adequate stand-alone measures for the assessment of LVDF. The algorithm is not recommended for application in the following conditions: complex congenital heart disease, cardiac transplants, end-stage liver disease, mitral stenosis or mitral annular calcification resulting in significant mitral stenosis, prosthetic mitral valve, severe aortic stenosis, severe mitral or tricuspid regurgitation, and atrial fibrillation with rapid average ventricular rate at rest (> 120 bpm) [152]
Fig. 20
Fig. 20
Algorithm for differentiating pre and post-capillary PH—reproduced with permission [170]. Accuracy to differentiate between normal and elevated LV filling pressure: Mitral E/A and LA reservoir strain: 85% accuracy. Mitral E/A and lateral E/e′ < 8 or > 13: 86% accuracy
Fig. 21
Fig. 21
Age-specific datasets plotted for E, A and e′ result in a three-dimensional skewed ellipsoid reference region. Here, the colour-coded ellipsoids have been sliced and displayed to demonstrate the expected E and A velocity and therefore E/A ratio according to six incremental e′ velocities. For example, it would be expected that for an individual in their thirties with an average e′ of 16 (centre-bottom graph), the E and A velocity would fall within the red ellipsoid and the E/A ratio would not be expected to fall below 1. Furthermore, the E/ e′ would not be expected to exceed 8. From Selmeryd et al. [189]

Similar articles

Cited by

References

    1. Bianco CM, Farjo PD, Ghaffar YA, Sengupta PP. Myocardial mechanics in patients with normal LVEF and diastolic dysfunction. JACC Cardiovasc Imaging. 2020;13(1 Pt 2):258–271. 10.1016/j.jcmg.2018.12.035 - PubMed
    1. Robinson S, Rana B, Oxborough D, Steeds R, Monaghan M, Stout M, Pearce K, Harkness A, Ring L, Paton M, Akhtar W, Bedair R, Bhattacharyya S, Collins K, Oxley C, Sandoval J, Schofield MBChBR, Siva A, Parker K, Willis J, Augustine DX. A practical guideline for performing a comprehensive transthoracic echocardiogram in adults: the British Society of Echocardiography minimum dataset. Echo Res Pract. 2020;7(4):G59–G93. doi: 10.1530/ERP-20-0026. - DOI - PMC - PubMed
    1. Ho SY. Anatomy and myoarchitecture of the left ventricular wall in normal and in disease. Eur J Echocardiogr. 2009;10(8):3–7. doi: 10.1093/ejechocard/jep159. - DOI - PubMed
    1. Sengupta PP, Korinek J, Belohlavek M, Narula J, Vannan M, Jahangir A, Khandheria BK. Left ventricular structure and function: basic science for cardiac imaging. J Am Coll Cardiol. 2006;48(10):1988–2001. doi: 10.1016/j.jacc.2006.08.030. - DOI - PubMed
    1. Thomas JD, Popović ZB. Assessment of left ventricular function by cardiac ultrasound. J Am Coll Cardiol. 2006;48(10):2012–2025. doi: 10.1016/j.jacc.2006.06.071. - DOI - PubMed