. 2024 Jan-Dec;16(1):2359500.
doi: 10.1080/19490976.2024.2359500. Epub 2024 Jun 2.

Archaea influence composition of endoscopically visible ileocolonic biofilms

Affiliations

Archaea influence composition of endoscopically visible ileocolonic biofilms

Elisabeth Orgler et al. Gut Microbes. 2024 Jan-Dec.

Abstract

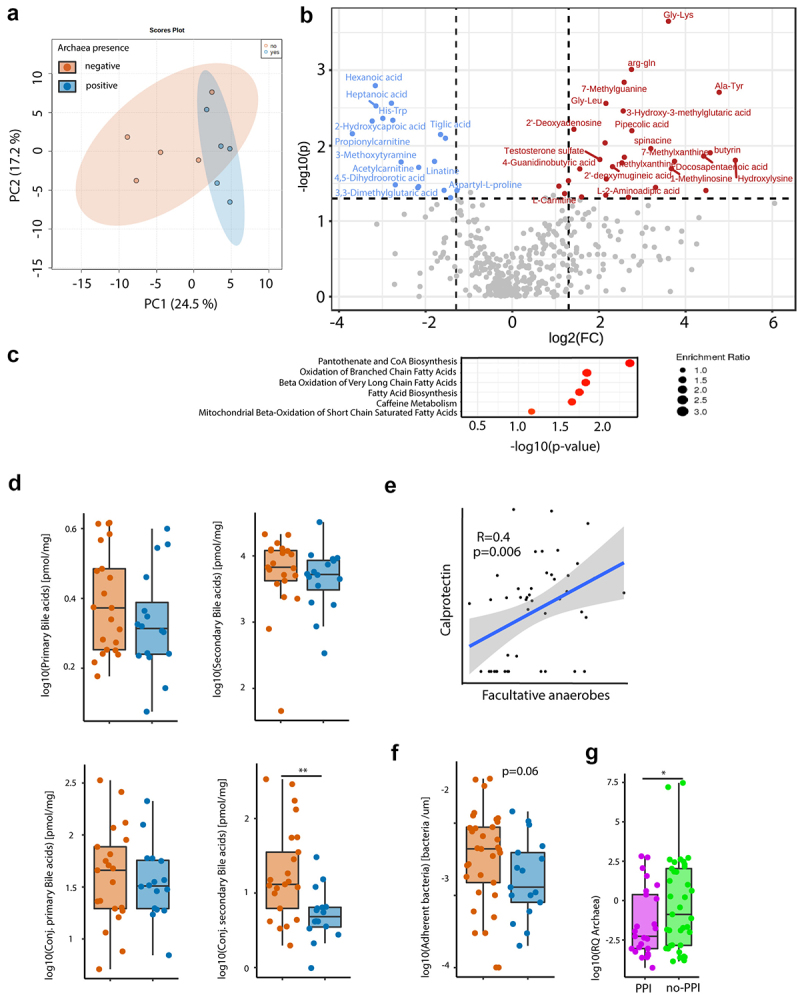
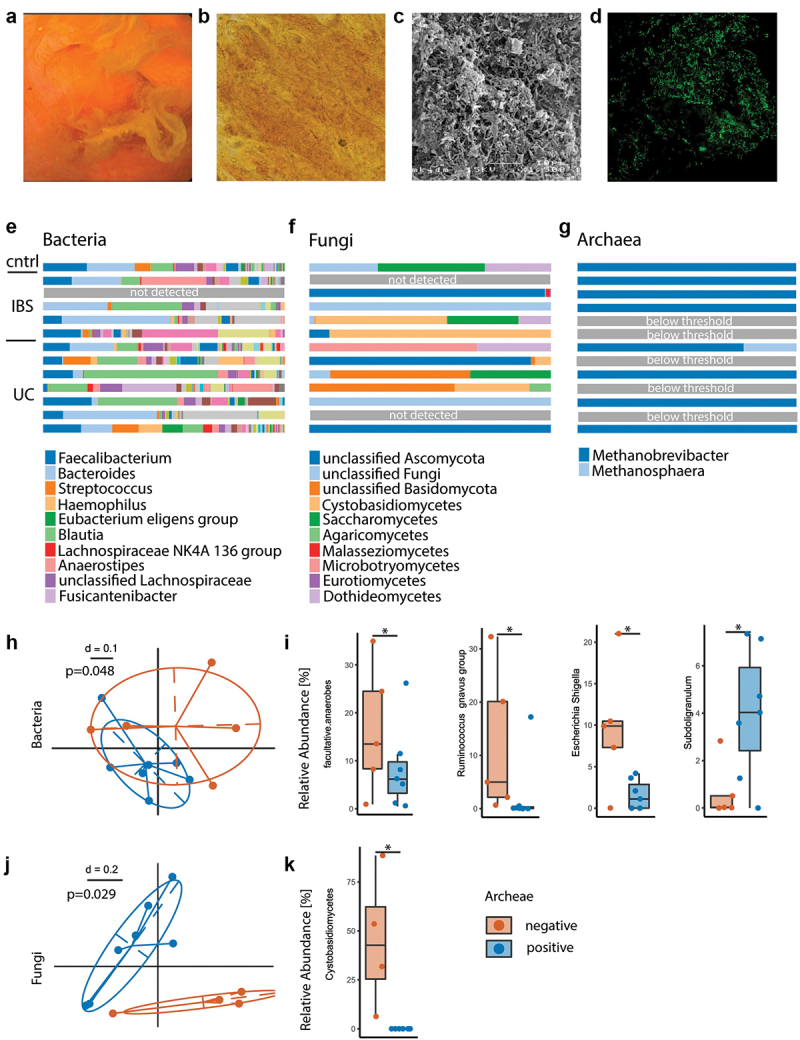
The gut microbiota has been implicated as a driver of irritable bowel syndrome (IBS) and inflammatory bowel disease (IBD). Recently we described, mucosal biofilms, signifying alterations in microbiota composition and bile acid (BA) metabolism in IBS and ulcerative colitis (UC). Luminal oxygen concentration is a key factor in the gastrointestinal (GI) ecosystem and might be increased in IBS and UC. Here we analyzed the role of archaea as a marker for hypoxia in mucosal biofilms and GI homeostasis. The effects of archaea on microbiome composition and metabolites were analyzed via amplicon sequencing and untargeted metabolomics in 154 stool samples of IBS-, UC-patients and controls. Mucosal biofilms were collected in a subset of patients and examined for their bacterial, fungal and archaeal composition. Absence of archaea, specifically Methanobrevibacter, correlated with disrupted GI homeostasis including decreased microbial diversity, overgrowth of facultative anaerobes and conjugated secondary BA. IBS-D/-M was associated with absence of archaea. Presence of Methanobrevibacter correlated with Oscillospiraceae and epithelial short chain fatty acid metabolism and decreased levels of Ruminococcus gnavus. Absence of fecal Methanobrevibacter may indicate a less hypoxic GI environment, reduced fatty acid oxidation, overgrowth of facultative anaerobes and disrupted BA deconjugation. Archaea and Ruminococcus gnavus could distinguish distinct subtypes of mucosal biofilms. Further research on the connection between archaea, mucosal biofilms and small intestinal bacterial overgrowth should be performed.

Keywords: IBS; Methanobrevibacter; UC; archaea; bile acids; biofilm; facultative anaerobes.


Conflict of interest statement

No potential conflict of interest was reported by the author(s).

Figures

Figure 1.
Figure 1.
Absence of archaea in stool correlates with decreased microbial diversity. (a–e) Comparison between stool samples with archaea (archaea-pos, blue) and without archaea (archaea-neg, orange) detected via qPCR in patient cohort 1. (a) NMDS plots of generalized unifrac distances of bacterial composition in all samples, controls, IBS- and UC-patients (from left to right), determined via 16S-rRNA sequencing. (b) Bacterial diversity as defined by Shannon’s index. (c) Bacterial richness. (d) Relative abundance of differential abundant bacterial OTUs. (e) Amplicon sequencing variant-based differences between archaea-high and archaea-low stool samples. Size of dots represent fold change, full-dots represent up-regulation in archaea positive samples, empty dots represent down-regulation. Dots are colored based on bacterial phylum. Statistical analysis: cohort 1, total n = 76 stool samples (50 archaea-neg, 26 archaea-pos; 23 controls, 37 IBS- and 16 UC-patients). (a) PERMANOVA of distance matrices. (b–d) Kruskal-Wallis rank sum test, with Benjamini-Hochberg correction for multiple comparisons. (e) DESeq2, only significant findings (p < .05 after correction for multiple comparisons) are shown. *p ≤ .05, **p ≤ .01.
Figure 2.
Figure 2.
Presence of archaea in stool correlate with SCFA and BA homeostasis. (a,b,d,f) Comparison between archaea-pos (blue) and archaea-neg (orange) stool samples. (a) PCA plot of stool sample metabolite composition. (b) Volcano plot of metabolomics data, p-value threshold 0.05; log2 fold-change threshold ±1. (c) Small Molecule Pathway Database pathway enrichment ratios of metabolomics data. (d) Stool sample bile acid concentrations detected via HPLC-MS. (e) Correlation of fecal calprotectin and relative abundance of facultative anaerobes. (f) Number of bacteria within 3-μm distance from the epithelium detected via DAPI, normalized to length of epithelium per section as determined via confocal microscopy of colonic biopsies. (g) Archaea qPCR RQ values in patients with PPI intake (PPI, purple, n = 25) and no PPI intake in the previous five years (no-PPI, green, n = 37). Statistical analysis: (a–c) n = 5 archaea-pos and 5 archaea-neg stool samples. (d) Mann Whitney U test, n = 16 archaea-pos and 21 archaea-neg stool samples. (e) Linear regression analysis, n = 47 stool samples, *p ≤ .05; **p ≤ .01.
Figure 3.
Figure 3.
Exploratory analysis of polymicrobial mucosal biofilm composition differs depending on presence of archaea. (a) Example of endoscopic view of mucosal biofilm. (b) Biofilm flush specimen under light microscopy shows yellow color, bacteria and shed epithelial cells. (c) SEM analysis of biofilm flush shows a thick layer of bacterial biofilm and extracellular matrix. (d) FISH with general bacterial probe (green) of methacarn fixed biofilm flush sample. (e–g) Stacked bar plot of relative abundance data, bacteria (e), fungi (f) and archaea (g). (h–k) Comparison between archaea-pos (blue) and archaea-neg (orange) biofilm flush samples. (h) NMDS plot of generalized unifrac distances of bacterial composition. (i) Relative abundance of facultative anaerobes and bacterial genera. (j) NMDS plot of generalized unifrac distances of fungal composition. (k) Relative abundance of Cystobasidiomycetes. Statistical analysis: (e–k) n = 13 (1 cntrl, 5 IBS, 7 UC), (h, i) n = 7 archaea-pos, 5 archaea-neg. (k) n = 6 archaea-pos, 4 archaea-neg. (h) PERMANOVA of the distance matrices, (i,k) Kruskal-Wallis rank sum test. (j) Mann Whitney U test, n = 9 archaea-high, 16 archaea-low, *p ≤ .05.

References

    1. Oka P, Parr H, Barberio B, Black CJ, Savarino EV, Ford AC.. Global prevalence of irritable bowel syndrome according to Rome III or IV criteria: a systematic review and meta-analysis. Lancet Gastroenterol Hepatol [Internet]. 2020;5(10):908–14. doi:10.1016/S2468-1253(20)30217-X. - DOI - PubMed
    1. Lovell RM, Ford AC. Global prevalence of and risk factors for irritable bowel syndrome: a meta-analysis. Clin Gastroenterol Hepatol [Internet]. 2012;10(7):712–721. doi:10.1016/j.cgh.2012.02.029. - DOI - PubMed
    1. Enck P, Aziz Q, Barbara G, Farmer AD, Fukudo S, Mayer EA, Niesler B, Quigley EMM, Rajilić-Stojanović M, Schemann M. et al. Irritable bowel syndrome. Nat Rev Dis Primers. 2016;2(1):16014. doi:10.1038/nrdp.2016.14. - DOI - PMC - PubMed
    1. Kaplan GG. The global burden of IBD: From 2015 to 2025. Nat Rev Gastroenterol Hepatol [Internet]. 2015;12(12):720–727. doi:10.1038/nrgastro.2015.150. - DOI - PubMed
    1. Kobayashi T, Siegmund B, Le Berre C, Wei SC, Ferrante M, Shen B, Bernstein CN, Danese S, Peyrin-Biroulet L, Hibi T. et al. Ulcerative colitis. Nat Rev Dis Primers [Internet]. 2020;6(1). doi:10.1038/s41572-020-0205-x. - DOI - PubMed

Publication types

MeSH terms