

This is a preprint.
Single cell RNA-sequencing of feline peripheral immune cells with V(D)J repertoire and cross species analysis of T lymphocytes
- PMID: 38826195
- PMCID: PMC11142102
- DOI: 10.1101/2024.05.21.595010
Single cell RNA-sequencing of feline peripheral immune cells with V(D)J repertoire and cross species analysis of T lymphocytes
Update in
-
Single cell RNA-sequencing of feline peripheral immune cells with V(D)J repertoire and cross species analysis of T lymphocytes.Front Immunol. 2024 Nov 15;15:1438004. doi: 10.3389/fimmu.2024.1438004. eCollection 2024. Front Immunol. 2024. PMID: 39620216 Free PMC article.
Abstract
Introduction: The domestic cat (Felis catus) is a valued companion animal and a model for virally induced cancers and immunodeficiencies. However, species-specific limitations such as a scarcity of immune cell markers constrain our ability to resolve immune cell subsets at sufficient detail. The goal of this study was to characterize circulating feline T cells and other leukocytes based on their transcriptomic landscape and T-cell receptor repertoire using single cell RNA-sequencing.
Methods: Peripheral blood from 4 healthy cats was enriched for T cells by flow cytometry cell sorting using a mouse anti-feline CD5 monoclonal antibody. Libraries for whole transcriptome, alpha/beta T cell receptor transcripts and gamma/delta T cell receptor transcripts were constructed using the 10x Genomics Chromium Next GEM Single Cell 5' reagent kit and the Chromium Single Cell V(D)J Enrichment Kit with custom reverse primers for the feline orthologs.
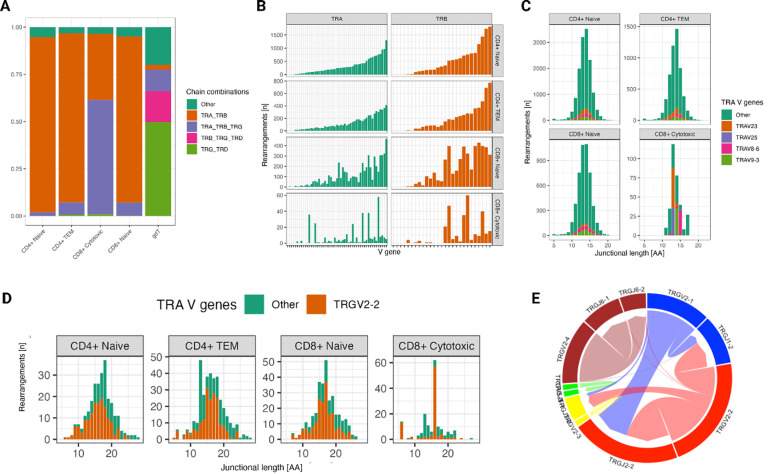
Results: Unsupervised clustering of whole transcriptome data revealed 7 major cell populations - T cells, neutrophils, monocytic cells, B cells, plasmacytoid dendritic cells, mast cells and platelets. Sub cluster analysis of T cells resolved naive (CD4+ and CD8+), CD4+ effector T cells, CD8+ cytotoxic T cells and gamma/delta T cells. Cross species analysis revealed a high conservation of T cell subsets along an effector gradient with equitable representation of veterinary species (horse, dog, pig) and humans with the cat. Our V(D)J repertoire analysis demonstrated a skewed T-cell receptor alpha gene usage and a restricted T-cell receptor gamma junctional length in CD8+ cytotoxic T cells compared to other alpha/beta T cell subsets. Among myeloid cells, we resolved three clusters of classical monocytes with polarization into pro- and anti-inflammatory phenotypes in addition to a cluster of conventional dendritic cells. Lastly, our neutrophil sub clustering revealed a larger mature neutrophil cluster and a smaller exhausted/activated cluster.
Discussion: Our study is the first to characterize subsets of circulating T cells utilizing an integrative approach of single cell RNA-sequencing, V(D)J repertoire analysis and cross species analysis. In addition, we characterize the transcriptome of several myeloid cell subsets and demonstrate immune cell relatedness across different species.
Keywords: T cells; T-cell receptor repertoire; V(D)J; cross species analysis; feline; myeloid cells; single cell RNA-sequencing (scRNA-seq).
Figures


Similar articles
-
Single cell RNA-sequencing of feline peripheral immune cells with V(D)J repertoire and cross species analysis of T lymphocytes.Front Immunol. 2024 Nov 15;15:1438004. doi: 10.3389/fimmu.2024.1438004. eCollection 2024. Front Immunol. 2024. PMID: 39620216 Free PMC article.
-
Topology and expressed repertoire of the Felis catus T cell receptor loci.BMC Genomics. 2020 Jan 6;21(1):20. doi: 10.1186/s12864-019-6431-5. BMC Genomics. 2020. PMID: 31906850 Free PMC article.
-
Canine peripheral blood TCRαβ T cell atlas: Identification of diverse subsets including CD8A+ MAIT-like cells by combined single-cell transcriptome and V(D)J repertoire analysis.Front Immunol. 2023 Feb 23;14:1123366. doi: 10.3389/fimmu.2023.1123366. eCollection 2023. Front Immunol. 2023. PMID: 36911660 Free PMC article.
-
Meta-Analysis of Leukocyte Diversity in Atherosclerotic Mouse Aortas.Circ Res. 2020 Jul 17;127(3):402-426. doi: 10.1161/CIRCRESAHA.120.316903. Epub 2020 Jul 16. Circ Res. 2020. PMID: 32673538 Free PMC article. Review.
-
Probing infectious disease by single-cell RNA sequencing: Progresses and perspectives.Comput Struct Biotechnol J. 2020;18:2962-2971. doi: 10.1016/j.csbj.2020.10.016. Epub 2020 Oct 21. Comput Struct Biotechnol J. 2020. PMID: 33106757 Free PMC article. Review.
References
-
- Rowan AN. Companion Animal Statistics in the USA. 2018. [cited 2024 Apr 30]; Available from: https://www.wellbeingintlstudiesrepository.org/demscapop/7/
-
- Larkin M, Radich R. AVMA. Am Vet Med Assoc; 2021. [cited 2024 Apr 5]. Pet population still on the rise, with fewer pets per household. Available from: https://avmajournals.avma.org/display/post/news/pet-population-still-on-...
-
- Powers JA, Chiu ES, Kraberger SJ, Roelke-Parker M, Lowery I, Erbeck K, et al. Feline Leukemia Virus (FeLV) Disease Outcomes in a Domestic Cat Breeding Colony: Relationship to Endogenous FeLV and Other Chronic Viral Infections. J Virol [Internet]. 2018. Sep 15;92(18). Available from: 10.1128/JVI.00649-18 - DOI - PMC - PubMed
Publication types
Grants and funding
LinkOut - more resources
Full Text Sources
Molecular Biology Databases
Research Materials
Miscellaneous