[Preprint]. 2024 May 29:2024.05.24.595814.
doi: 10.1101/2024.05.24.595814.

A microglia-containing cerebral organoid model to study early life immune challenges

Affiliations

A microglia-containing cerebral organoid model to study early life immune challenges

Alice Buonfiglioli et al. bioRxiv. .

Update in

Abstract

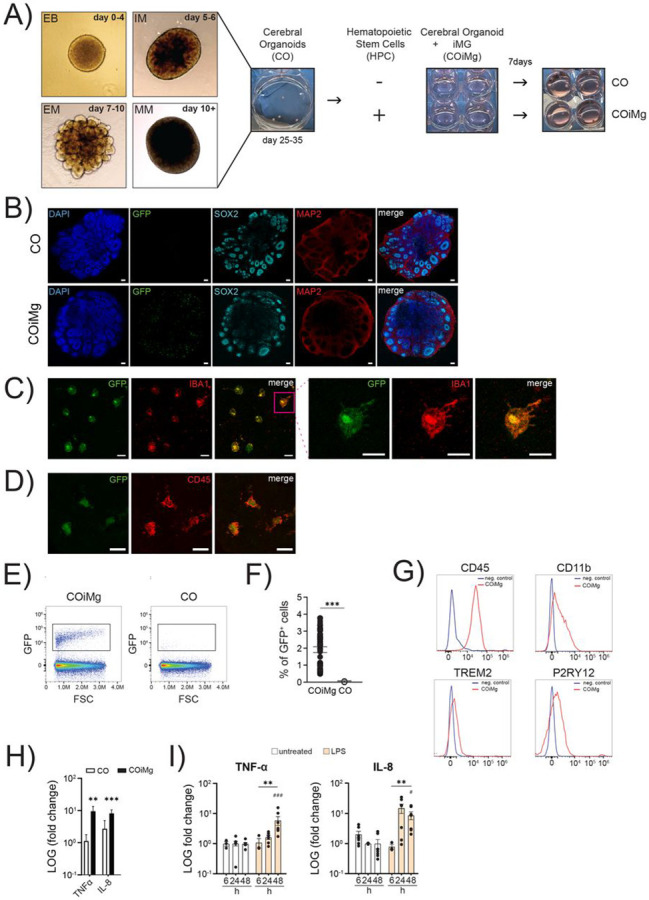
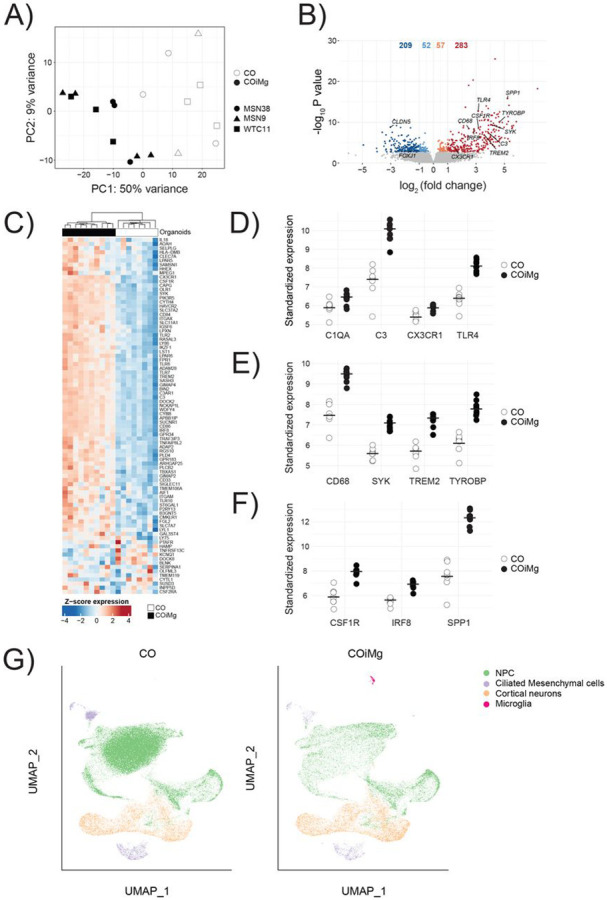
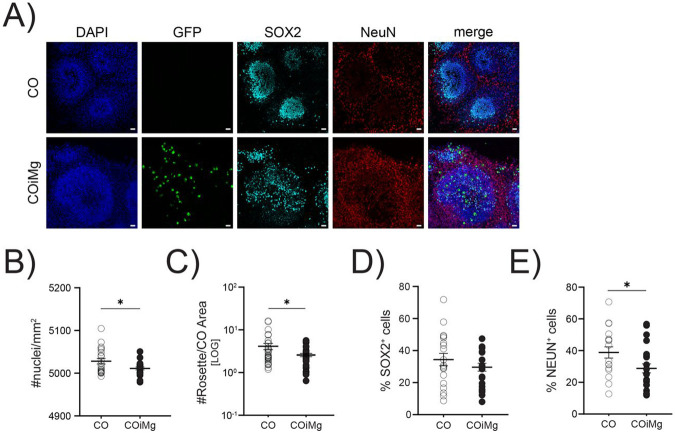
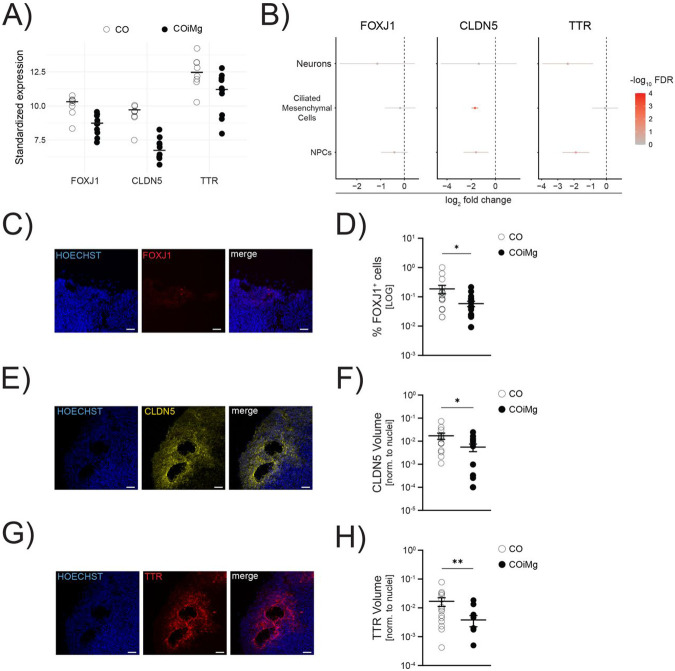
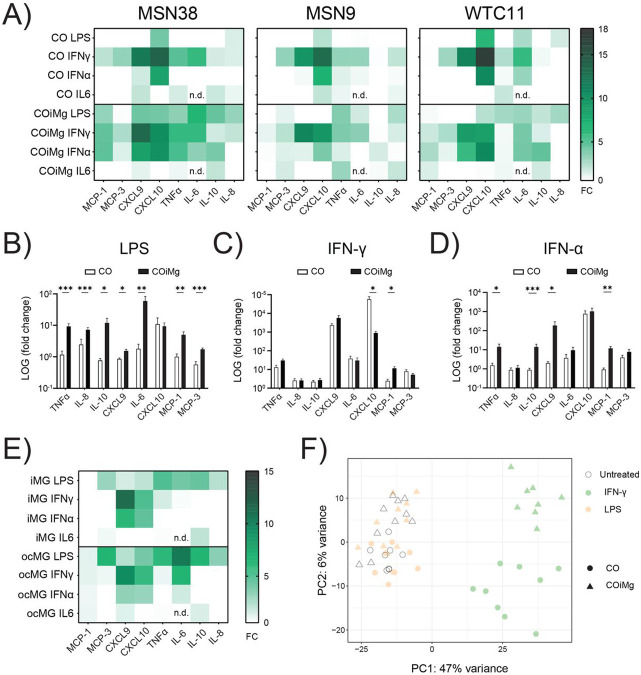
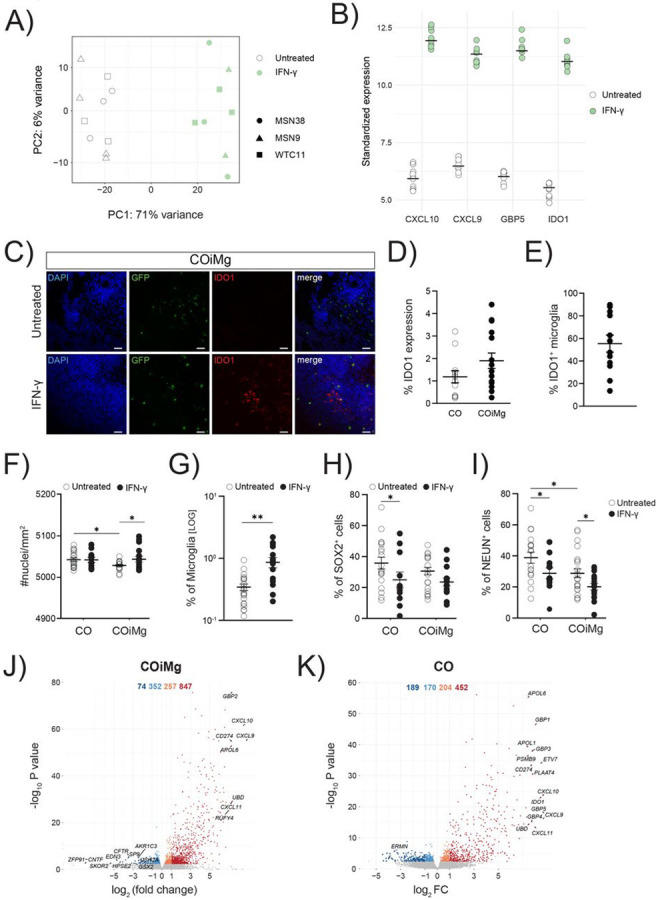
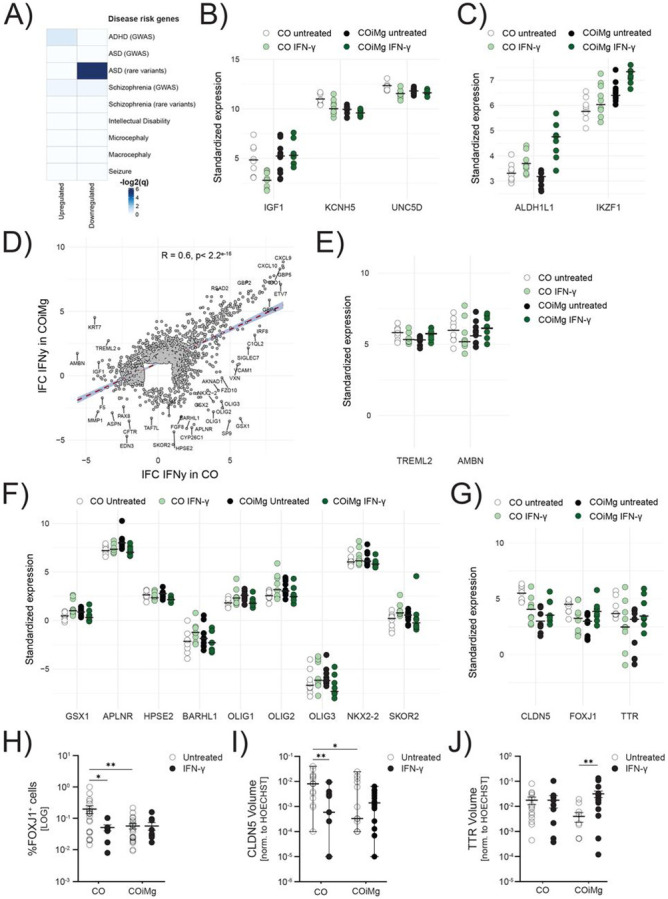
Prenatal infections and activation of the maternal immune system have been proposed to contribute to causing neurodevelopmental disorders (NDDs), chronic conditions often linked to brain abnormalities. Microglia are the resident immune cells of the brain and play a key role in neurodevelopment. Disruption of microglial functions can lead to brain abnormalities and increase the risk of developing NDDs. How the maternal as well as the fetal immune system affect human neurodevelopment and contribute to NDDs remains unclear. An important reason for this knowledge gap is the fact that the impact of exposure to prenatal risk factors has been challenging to study in the human context. Here, we characterized a model of cerebral organoids (CO) with integrated microglia (COiMg). These organoids express typical microglial markers and respond to inflammatory stimuli. The presence of microglia influences cerebral organoid development, including cell density and neural differentiation, and regulates the expression of several ciliated mesenchymal cell markers. Moreover, COiMg and organoids without microglia show similar but also distinct responses to inflammatory stimuli. Additionally, IFN-γ induced significant transcriptional and structural changes in the cerebral organoids, that appear to be regulated by the presence of microglia. Specifically, interferon-gamma (IFN-γ) was found to alter the expression of genes linked to autism. This model provides a valuable tool to study how inflammatory perturbations and microglial presence affect neurodevelopmental processes.

Keywords: IFN-γ; cerebral organoid; immune challenge; microglia; neurodevelopmental disorders.


Conflict of interest statement

Declaration of interests The authors declare no competing interests.

Figures

Figure 1.
Figure 1.. Generation and characterization of an immune-competent cerebral organoid model that responds to inflammatory triggers.
(A) Schematic illustration of the generation of COiMg, including CO differentiation and Cerebral Organoid differentiation and the co-culturing protocol. (B) Representative images of CO and COiMg stained with the neural markers SOX2 and MAP2. Microglia are labelled with GFP. HOECHST was used for nuclei staining. 10X Magnification. Scale bar, 100μm. (C,D) Representative images of COiMg stained with the microglial markers IBA1 (C) and CD45 (D). Microglia are labelled with GFP. 20X and 63X Magnification. Scale bar, 20 and 10 μm, respectively. (E) CO (in white) and COiMg (in black) were dissociated and FACS was performed to analyze the presence of microglia, expressed as GFP+ cells. Density plot of COiMg and CO gated for GFP+ cells. Cells were pre-gated for singlets and viability. (F) Percentages of GFP+ cells were calculated out of single viable cells in both CO and COiMg. Data are represented as points and error bars as mean ± SEM. N= 3 biological replicates (batches). Welch’s t-test was performed. *** P ≤ 0.001. (G) Histogram plots depicting the microglial marker CD45, CD11b, TREM2 and P2RY12 expression in COiMg (in red). Unstained sample was used as negative control. (H) CO (in white) and COiMg (in black), derived from MSN38 iPSC donor line, were stimulated with LPS (100 ng/mL) for 48 h. TNF-α and IL-8 release was determined via ELISA and expressed as fold change release normalized to untreated samples. Mann Whitney t-test was performed. ** P ≤ 0.01, *** P ≤ 0.001. Data are represented as bars and error bars as mean ± SEM. N= 3 or more biological replicates (batches). (I) COiMg were stimulated with LPS (100 ng/mL) for 6, 24 and 48 h. TNF-α and IL-8 release was determined via ELISA and expressed as fold change release normalized to untreated samples. Kruskal-Wallis test, followed by Dunn’s post-hoc test, was performed. # P ≤ 0.01, ** P ≤ 0.01, ### P ≤ 0.001. Data are represented as mean ± SEM. N= 3 or more biological replicates (batches).
Figure 2.
Figure 2.. Microglia-containing cerebral organoids express microglial genes.
(A) Bulk RNAseq PCA Plot of the first two PCs displaying CO and COiMg sample distance in all three donor iPSC lines. N=8-9 per condition, and N=3 per line (white = CO, black = COiMg, circle = MSN38, triangle=MSN9, square = WTC11). PCs were calculated based on the top 500 variable genes. (B) Volcano plot showing differentially expressed genes. Microglial genes were annotated. Each dot represents a gene. Colorization shows genes differentially expressed at fold change < 0.1 (lightblue = downregulated at log2FC < 0, orange = upregulated at log2FC > 0, darkred = upregulated at log2FC > 1, darkblue = downregulated at log2FC < −1). (C) Heatmap of row-scaled vst-standardized and corrected gene expression of microglia genes in CO and COiMg. (D,E,F) Dotplots of vst-standardized and corrected expression of specific microglial markers: C1QA, C3, CX3CR1, TLR4, CD68, SYK, TREM2, TYROBP, CSF1R, IRF8 and SPP1. Each dot represents one organoid. (G) UMAP of CO and COiMg showing cluster identity for NPC, Ciliated Mesenchymal cells, Cortical Neurons and Microglia. Each dot is a single cell.
Figure 3.
Figure 3.. Microglia presence decreased cell density and the percentage of NEUN+ population in cerebral organoids.
(A) Representative images of CO and COiMg stained with the neural stem cell marker SOX2 and the neuronal marker NEUN. Microglia are labelled with GFP. HOECHST was used for nuclei staining. 20X Magnification. Scale bar, 10μm. (B) Quantification of number of nuclei per mm2 was performed in CO and COiMg. Data are represented as points and error bars as mean ± SEM. N= 3 biological replicates (batches) per line. Welch’s t-test was performed. * P ≤ 0.05. (C) Quantification of number of rosettes per organoid area was performed in CO and COiMg. Data are represented as points and error bars as mean ± SEM. N= 3 biological replicates (batches) per line. Welch’s t-test was performed. * P ≤ 0.05. (D,E) Percentage of SOX2+ (D) and NeuN+ (E) cells was calculated in CO and COiMg. Data are represented as points and error bars as mean ± SEM. N= 3 biological replicates (batches) per line; all three lines were pulled. Unpaired t-test was performed. * P ≤ 0.05.
Figure 4.
Figure 4.. Microglia presence decreases the expression of cilia-associated markers on the transcriptional and protein level.
(A) Dotplots of vst-standardized and corrected expression of CLDN5, FOXJ1 and TTR genes derived from bulk RNAseq. Each dot represents one organoid. (B) Downregulated expression of CLDN5, FOXJ1 and TTR in Neurons, Ciliated Mesenchymal Cells and Radial Glia, extracted from the scRNAseq. (C) Representative image of CO stained with FOXJ1. HOECHST was used for nuclei staining. 20X Magnification. Scale bar, 50μm. (D) Percentage of FOXJ1+ cells quantified in CO and COiMg. Data are represented as points and error bars as mean ± SEM. N= 2 biological replicates (batches) per line. Mann Whitney t-test was performed. * P ≤ 0.05. (E) Representative image of CO stained with CLDN5. HOECHST was used for nuclei staining. 20X Magnification. Scale bar, 50μm. (F) Quantification of CLDN5 surface volume normalized to HOECHST volume was performed in CO and COiMg. Data are represented as points and error bars as mean ± SEM. N= 2 biological replicates (batches) per line. Unpaired t-test was performed. * P ≤ 0.05. (G) Representative image of CO stained with TTR. HOECHST was used for nuclei staining. 20X Magnification. Scale bar, 50μm. (H) Quantification of TTR surface volume normalized to HOECHST volume was performed in CO and COiMg. Data are represented as points and error bars as mean ± SEM. N= 2 biological replicates (batches) per line. Mann Whitney t-test was performed. ** P ≤ 0.01.
Figure 5.
Figure 5.. Effect of different inflammatory triggers on cerebral organoids with or without microglia.
(A) CO and COiMg, derived from all three donor iPSC lines, were stimulated for 48 h with the inflammatory ligands LPS, IFN-γ, IFN-α and IL6 (all at a concentration of 100 ng/mL), supernatants were collected, and cytokine and chemokine release was analyzed via Multiplex ELISA. Data are shown in a heatmap representing cytokine release normalized to untreated conditions. N= 3 biological replicates (batches) per line. (B,C,D) CO and COiMg were stimulated for 48 h with the inflammatory ligands LPS (B), IFN-γ (C) and IFN-α (D), supernatants were collected and cytokine and chemokine release was analyzed via Multiplex ELISA. Data, expressed as fold change release compared to untreated conditions, are shown as bars and error bars as mean ± SEM. N= 3 biological replicates (batches) per line; all three lines were pulled. (E) iMG and ocMG were stimulated for 48 h with the inflammatory ligands LPS, IFN-γ, IFN-α and IL6, supernatants were collected and cytokine and chemokine release was analyzed via Multiplex ELISA. Data are shown in a heatmap representing cytokine release normalized to untreated conditions. N= 3 per microglial model. (F) PCA plot of the first two principal components displaying CO and COiMg usample distances in untreated and stimulated conditions (white = untreated, orange = LPS and lightgreen = IFN-γ) from bulk RNAseq. N= 3 per stimulants per iPSC line. PCs were calculated based on the top 500 variable genes.
Figure 6.
Figure 6.. IFN-γ-mediated signaling pathways are upregulated in both CO and COiMg.
(A) PCA plot of the first two PCs displaying COiMg sample distances in untreated and stimulated conditions (white = untreated, green = IFN-γ) from bulk RNAseq. N= 3 per stimulants per iPSC line. PCs were calculated based on the top 500 variable genes. (B) Dotplots of vst-standardized and corrected bulk RNAseq expression of the differentially upregulated genes of CXCL10, CXCL9, GBP5 and IDO1 in IFN-γ-treated COiMg. (C) Representative image of COiMg untreated (upper) or treated with IFN-γ (lower) stained with IDO1. Microglia are labelled with GFP. HOECHST was used for nuclei staining. 20X Magnification. Scale bar, 50 μm. (D) Percentage of IDO1 expression in CO and COiMg. Data are represented as points and error bars as mean ± SEM. N= 2 biological replicates (batches) per line. All three lines pulled. (E) Percentage of IDO1+ microglia was calculated in COiMg. Data are represented as points and error bars as mean ± SEM. N= 2 biological replicates (batches) per line. All three lines pulled. (F) Quantification of number of nuclei per mm2 was performed in untreated and IFN-γ-treated CO and COiMg. Data are represented as points and error bars as mean ± SEM. N= 3 biological replicates (batches) per line. Two-way ANOVA test was performed. * P ≤ 0.05. (G) Percentage of microglia, expressed on a logarithmic scale, was calculated in untreated and IFN-γ-treated COiMg. Data are shown as points with mean ± SEM. N= 2 biological replicates (batches) per line. All three lines pulled. Mann Whitney t-test was performed. ** P ≤ 0.01. (H,I) Percentage of SOX2+ (H) and NeuN+ (I) cells was calculated in untreated and IFN-γ-treated CO and COiMg. Data are represented as points and error bars as mean ± SEM. N= 3 biological replicates (batches) per line; all donor lines are pulled. Two-way ANOVA test, followed by Fisher’s LSD post-hoc test, was performed. * P ≤ 0.05. (J,K) Volcano plots showing differentially expressed genes in IFN-γ-treated COiMg (J) and CO (K). Each dot represents a gene. Colorization shows genes differentially expressed at fold change < 0.1 (lightblue = downregulated at log2FC < 0, orange = upregulated at log2FC > 0, darkred = upregulated at log2FC > 1, darkblue = downregulated at log2FC < −1).
Figure 7.
Figure 7.. Transcriptional and proteomic changes between CO and COiMg when treated with IFN-γ.
(A) Heatmap displaying the −log2(q-values) from GSEA testing overlap between IFN-γ-related DEGs and SFARI databases for psychiatric disorders. Higher −log2(q-values) is equivalent to higher significance of overlap. (B,C) Dotplot of vst-standardized and corrected bulk RNAseq expression values of SFARI ASD rare variants that were also differentially expressed under IFN-γ stimulation in CO and COiMg. (D) Scatter plot displaying the Pearson’s r correlation of log-fold changes (filtered for lFC > 1 and lFC < −1) between CO and COiMg treated with IFN-γ. Each dot represents one gene. (E,F) Dotplots of vst-standardized and corrected bulk RNAseq gene expression of selected DEGs between CO and COiMg, when treated with IFN-γ. (G) Dotplots of vst-standardized and corrected bulk RNAseq gene expression of FOXJ1, CLDN5 and TTR between CO and COiMg, when treated with IFN-γ. (H) Percentage of FOXJ1+ cells was quantified in CO and COiMg. Data are represented as points and error bars as mean ± SEM. N= 2 biological replicates (batches) per line. All three lines pulled. Two-way ANOVA test, followed by Fisher’s LSD post-hoc test, was performed. * P ≤ 0.05, ** P ≤ 0.01. (I) Quantification of CLDN5 surface volume, normalized to HOECHST volume, was performed in CO and COiMg. Data, expressed on a logarithmic scale, are represented as points and error bars as mean ± SEM. N= 2 biological replicates (batches) per line. All three lines pulled. Two-way ANOVA test, followed by Fisher’s LSD post-hoc test, was performed. * P ≤ 0.05, ** P ≤ 0.01. (J) Quantification of TTR surface volume, normalized to HOECHST volume, was performed in CO and COiMg. Data, expressed on a logarithmic scale, are represented as points and error bars as mean ± SEM. N= 2 biological replicates (batches) per line. All three lines pulled. Two-way ANOVA test, followed by Fisher’s LSD post-hoc test, was performed. ** P ≤ 0.01.

Similar articles

References

    1. Arenella M., Cadby G., De Witte W., Jones R. M., Whitehouse A. J., Moses E. K., Fornito A., Bellgrove M. A., Hawi Z., Johnson B., Tiego J., Buitelaar J. K., Kiemeney L. A., Poelmans G., & Bralten J. (2022). Potential role for immune-related genes in autism spectrum disorders: Evidence from genome-wide association meta-analysis of autistic traits. Autism, 26(2), 361–372. 10.1177/13623613211019547 - DOI - PMC - PubMed
    1. Arenella M., Fanelli G., Kiemeney L. A., McAlonan G., Murphy D. G., & Bralten J. (2023). Genetic relationship between the immune system and autism. Brain Behav Immun Health, 34, 100698. 10.1016/j.bbih.2023.100698 - DOI - PMC - PubMed
    1. Bach E. A., Aguet M., & Schreiber R. D. (1997). THE IFNγ RECEPTOR:A Paradigm for Cytokine Receptor Signaling. Annual Review of Immunology, 15(Volume 15, 1997), 563–591. https://doi.org/10.1146/annurev.immunol.15.1.563 - DOI - PubMed
    1. Bilbo S., & Stevens B. (2017). Microglia: The Brain's First Responders. Cerebrum, 2017. - PMC - PubMed
    1. Borst K., Dumas A. A., & Prinz M. (2021). Microglia: Immune and non-immune functions. Immunity, 54(10), 2194–2208. 10.1016/j.immuni.2021.09.014 - DOI - PubMed

Publication types