[Preprint]. 2024 May 22:2024.05.21.595135.
doi: 10.1101/2024.05.21.595135.

Norepinephrine Signals Through Astrocytes To Modulate Synapses

Affiliations

Norepinephrine Signals Through Astrocytes To Modulate Synapses

Katheryn B Lefton et al. bioRxiv. .

Update in

  • Norepinephrine signals through astrocytes to modulate synapses.
    Lefton KB, Wu Y, Dai Y, Okuda T, Zhang Y, Yen A, Rurak GM, Walsh S, Manno R, Myagmar BE, Dougherty JD, Samineni VK, Simpson PC, Papouin T. Lefton KB, et al. Science. 2025 May 15;388(6748):776-783. doi: 10.1126/science.adq5480. Epub 2025 May 15. Science. 2025. PMID: 40373122

Abstract

Locus coeruleus (LC)-derived norepinephrine (NE) drives network and behavioral adaptations to environmental saliencies by reconfiguring circuit connectivity, but the underlying synapse-level mechanisms are elusive. Here, we show that NE remodeling of synaptic function is independent from its binding on neuronal receptors. Instead, astrocytic adrenergic receptors and Ca2+ dynamics fully gate the effect of NE on synapses as the astrocyte-specific deletion of adrenergic receptors and three independent astrocyte-silencing approaches all render synapses insensitive to NE. Additionally, we find that NE suppression of synaptic strength results from an ATP-derived and adenosine A1 receptor-mediated control of presynaptic efficacy. An accompanying study from Chen et al. reveals the existence of an analogous pathway in the larval zebrafish and highlights its importance to behavioral state transitions. Together, these findings fuel a new model wherein astrocytes are a core component of neuromodulatory systems and the circuit effector through which norepinephrine produces network and behavioral adaptations, challenging an 80-year-old status quo.


Conflict of interest statement

Competing interests: Authors declare that they have no competing interests.

Figures

Fig. 1:
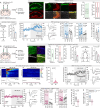
Fig. 1:. NE and LC-NE activity inhibit presynaptic efficacy
(A) Schematic of the recording conditions. (B) Left, Time-course of the effect of 20μM NE (applied at t=0, greyed area) on fEPSP slope and PPF. Each circle is the average of three data points per minute. (1) and (2) indicate the approximate epochs at which sample traces were obtained and quantifications performed for the baseline and NE conditions. Right, Representative traces showing the effect of NE on the slope of the first fEPSP (top) and on the PPF of the second fEPSP (bottom) from a same recording. Stimulation artefacts were cropped for clarity. (C) Pair-wise quantification of the effect of NE on fEPSP slope and PPF for the experiments shown in (B). (D) Correlation between NE-induced fEPSP decrease and PPF increase in experiments shown in (B) and (C). (E) Representative recording of EPSCs amplitude in response to minimal stimulations, showing failures (grey) and successes (black). (F) Left, Averaged time course (per minute) of minimal-stimulation experiments showing the effect of 20μM NE on synaptic efficacy (grey) and potency (black). Right, Representative traces illustrating the effect of NE on efficacy (grey traces, failures; black traces, successes) and potency (average of successes) over 1min epochs. (G) Quantification and pair-wise comparison of the effect of NE on synaptic efficacy, potency and strength for individual experiments shown in (F). (H) Schematic illustration of the experimental procedure for expressing ChR2 in LC-NE fibers. (I) IHC images of ChR2-EYFP expression in the LC (left) and hippocampal CA1 (right) at 12 weeks, and quantification of efficiency and specificity of ChR2-EYFP expression in the LC (center). Tyrosine hydroxylase (TH) is used as a marker of NE-producing neurons (n= 22 sections, 4 animals). Cereb.: Cerebellum; 4V: fourth ventricle; Verm.: Vermis; s.p.: stratum pyramidale, s.r.: stratum radiatum; s.l.m.: stratum lacunasorum moleculare. Arrowheads indicate ChR2-EYFP-expressing LC-NE projections with major bifurcation points (asterisks). (J) Schematic of the recording and optogenetic stimulation conditions. (K) Time-course of the effect of the optical stimulation of LC-NE fibers on fEPSPs and PPF, and representative traces. Insets show the detailed time-course (20s bins) at the onset and offset of light (s.e.m. omitted for clarity). (L) Pair-wise quantification of the effect of light (1Hz, 10min) on fEPSP slope and PPF for the experiments shown in (K) and in EYFP-control slices. (M) Plot summarizing the effect of light in ChR2-positive slices, EYFP-control slices, and ChR2-positive slices in the presence of silodosin (50nM, silo.). (N) Plot summarizing the effect of NE on synaptic strength in the presence of blockers of ɑ2-AR (yohimbine, 500nM), β-AR (propranolol, 1μM), ɑ1B-AR (LY746–314, 1μM), ɑ1-AR (prazosin, 1μM), ɑ1A-AR (silodosin, 50nM) or the ɑ1A-AR agonist A61603 (70nM). (O,P) Time-course of the effect of 20μM NE on fEPSPs and PPF in the presence of silodosin (50nM), representative traces, and pair-wise quantification. Data are shown as mean ± s.e.m.
Fig. 2:
Fig. 2:. Astrocyte Ca2+ dynamics gate the effect of NE on synapses
(A) Approach for astrocyte Ca2+ silencing with iβARK. (B) Representative IHC images of iβARK-mCherry expression in the hippocampal CA1, along with quantification of efficiency and specificity (n=5 slices). (C) Plot of the stimulation intensity/fEPSP slope relationship (left, unpaired Student’s t-test on slope/stim ratio) and summary bar graphs of PPF values (right) in RFP-control and iβARK slices at baseline. (D) Kymograph (each row shows the average fluorescence across ROAs of a single astrocyte) and 5 representative ΔF/F0 traces (from individual ROAs) of spontaneous Ca2+ transients in RFP-control and iβARK slices. Horizontal time axis applies to the kymograph and representative traces. (E) Pots of the peak amplitude, frequency, and kinetics of spontaneous Ca2+ transients in RFP-control and iβARK slices. Each data point shows the average fluorescence across ROAs for an individual astrocyte. (F) Kymographs (each row shows the whole-cell fluorescence of a single astrocyte) and average ΔF/F0 traces (± s.e.m.) across all astrocytes in response to 20μM NE application in RFP-control and iβARK slices. (G) Plot of the peak ΔF/F0 response in RFP-control and iβARK conditions for experiments shown in (F). (H,I) Time-courses of the effect of 20μM NE on fEPSP slope and PPF, and representative traces, in RFP-control and iβARK slices. (J) Pair-wise quantifications of the effect of NE on fEPSP slope and PPF for the experiments shown in (H) and (I). (K) Plots summarizing the effect of NE on fEPSP slope in RFP-control and iβARK slices. (L) Correlation between the effect of 20μM NE on astrocyte peak Ca2+ responses and fEPSP slope across three methods of astrocyte silencing and RFP-controls (see SupFig.3, SupFig.4 and Table S1). Data are shown as mean ± s.e.m.
Fig. 3:
Fig. 3:. Astrocytic, but not neuronal α1A-ARs are required for NE to affect synapses
(A) Approach for the neuronal deletion of Adra1a. (B) Representative IHC images of Cre-GFP expression in hippocampal CA1 and CA3 neurons, along with quantification of efficiency and specificity (n= 4 sections, 2 animals). (C) Quantification of Adra1a gDNA levels, normalized to Atcb (β-actin), in GFP+ and GFP- cells sorted from N-Adra1aKO animal hippocampi (n = 3). (D) Time-course of the effect of 20μM NE on fEPSPs and PPF in N-Adra1aKO slices and representative traces. (E-F) Pair-wise quantification of the effect of NE on fEPSP slope and PPF in N-Adra1aKO and N-Adra1aCre-GFP control slices, and summary plot of the effect of NE on fEPSPs in both conditions. (G) Approach for the astrocytic deletion of Adra1a. (H) Representative IHC images of Cre-GFP expression in hippocampal CA1 astrocytes, along with quantification of efficiency and specificity (n = 6 sections, 2 animals). (I) Left, quantification of bulk Adra1a gDNA levels, normalized to Actb (β-actin), in hippocampi from A-Adra1aCre-GFP controls (n = 4) and A-Adra1aKO (n = 3). Right, quantification of Adra1a gDNA levels, normalized to Actb (β-actin), in GFP+ and GFP- cells sorted from A-Adra1aKO hippocampi (n = 3). (J,K) Kymographs (each row shows the whole-cell fluorescence of a single astrocyte), average ΔF/F0 traces (± s.e.m.) across all astrocytes, and quantification of the peak Ca2+ signal in response to 20μM NE application in A-Adra1aCre-GFP and A-Adra1aKO slices. (L-O) Time-courses of the effect of NE on fEPSPs and PPF, and representative traces, in A-Adra1acontrol (L) and A-Adra1aKO slices (M), pair-wise quantification of the effect of NE on fEPSP slope and PPF (N), and summary plot of the effect of NE in both conditions (O). (P) Summary plot of the inhibitory effect of NE on fEPSPs, relative to controls, in A-Adra1aKO and N-Adra1aKO slices.
Fig. 4:
Fig. 4:. NE leverages ATP-Adenosine-A1R signaling to modulate synaptic efficacy
(A) Left, plot summarizing the effect of 20μM NE in the presence of A1R antagonists (CPT, 200nM, or DPCPX, 100nM), an adenosine scavenger (ADA, 1U/mL), a cocktail of P2X/P2Y (PPADS, 10μM), A2A (ZM241385, 50nM) and A2B (PSB603 50nM) receptor antagonists, a cocktail of mGluR inhibitors (CPPG, 5μM; MPEP, 3.6μM; YM298198, 2μM) or in slices from NT5eKO mice. Right, schematic of the ATP-Adenosine-A1R pathways showing different points of genetic or pharmacological intervention. (B) Time-course of the effect of NE on fEPSPs and PPF in the presence of the A1R antagonist CPT and representative traces. (C) Pair-wise quantification for the experiments shown in (B). (D) Approach for the deletion of Adora1 in CA3 or CA1 neurons. (E) Representative IHC images of Cre-GFP expression in CA1- and CA3-injected animals, along with quantification of regional specificity (n = 4 slices, 2 animals). (F,G) Time-course, representative traces and quantification of the effect of 5μM adenosine on fEPSPs in CA1-Ado1KD and CA3-Ado1KD slices. (H-J) Time-course, representative traces, pair-wise quantification and summary plot of the effect of 20μM NE on fEPSPs in CA1- Ado1KD and CA3-Ado1KD slices. (K,L) Time-course, representative traces and summary plot of the effect of 20μM NE on fEPSPs and PPF in NT5eKO slices. (M,N) Time course, representative traces and quantification of the effect of adenosine on fEPSPs in NT5eKO and control slices.

Similar articles

References

    1. Chandler D. J. et al. , Redefining noradrenergic neuromodulation of behavior: impacts of a modular Locus Coeruleus architecture. Journal of Neuroscience 39, 8239–8249 (2019). - PMC - PubMed
    1. Breton-Provencher V., Drummon G. T., Sur M., Locus coeruleus norepinephrine in learned behavior: anatomical modularity and spatiotemporal integration in targets. Frontiers in Neural Circuits 15, (2021). - PMC - PubMed
    1. Berridge C. W., Waterhouse B. D., The locus coeruleus-noradrenergic system: modulation of behavioral state and state-dependent cognitive processes. Brain Research Reviews 42, 33–84 (2003). - PubMed
    1. Breton-Provencher V., Drummond G. T., Feng J., Li Y., Sur M., Spatiotemporal dynamics of noradrenaline during learned behavior. Nature 606, 732–737 (2022). - PMC - PubMed
    1. Bulbring E., The methylation of noradrenaline by minced suprarenal tissue. British Journal of Pharmacology 4, (1949). - PMC - PubMed

Publication types