[Preprint]. 2024 Nov 23:2024.05.23.590306.
doi: 10.1101/2024.05.23.590306.

Classification of psychedelics and psychoactive drugs based on brain-wide imaging of cellular c-Fos expression

Affiliations

Classification of psychedelics and psychoactive drugs based on brain-wide imaging of cellular c-Fos expression

Farid Aboharb et al. bioRxiv. .

Update in

Abstract

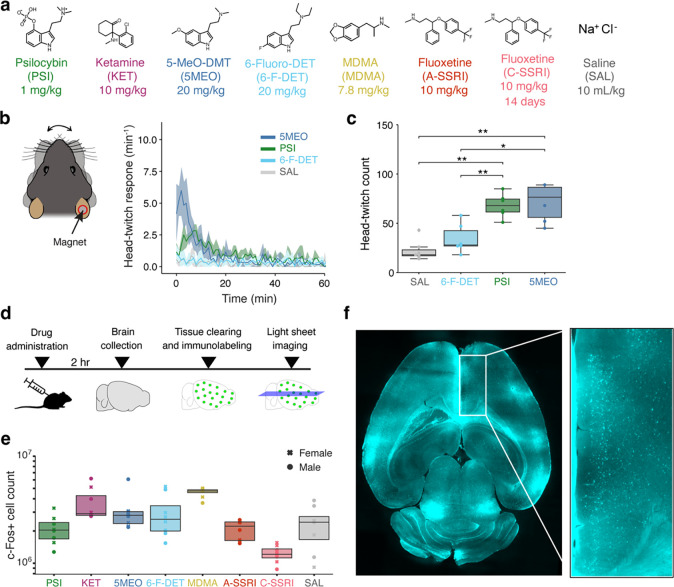
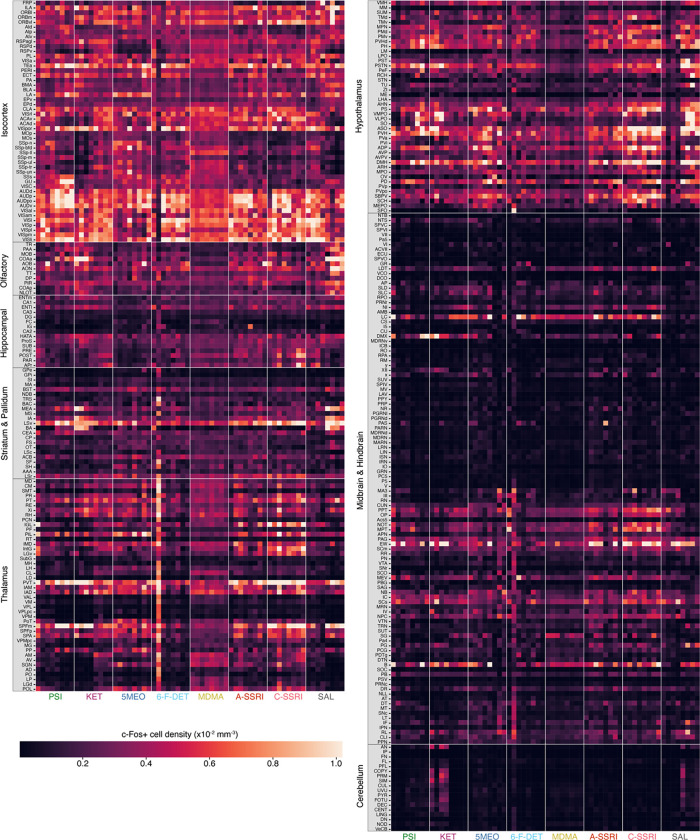
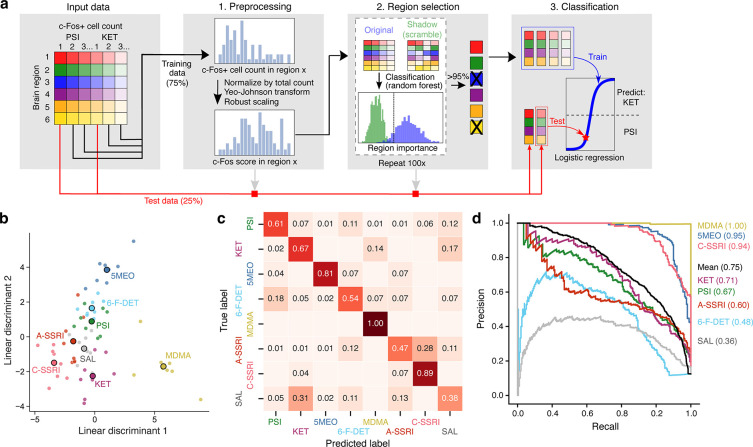
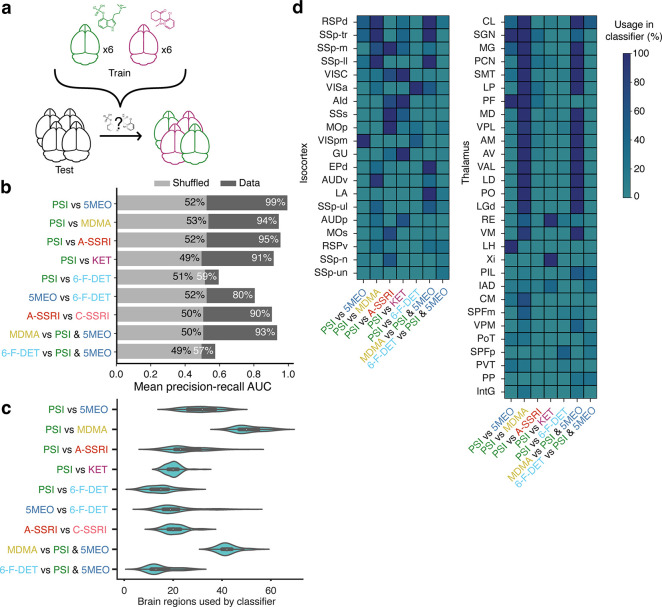
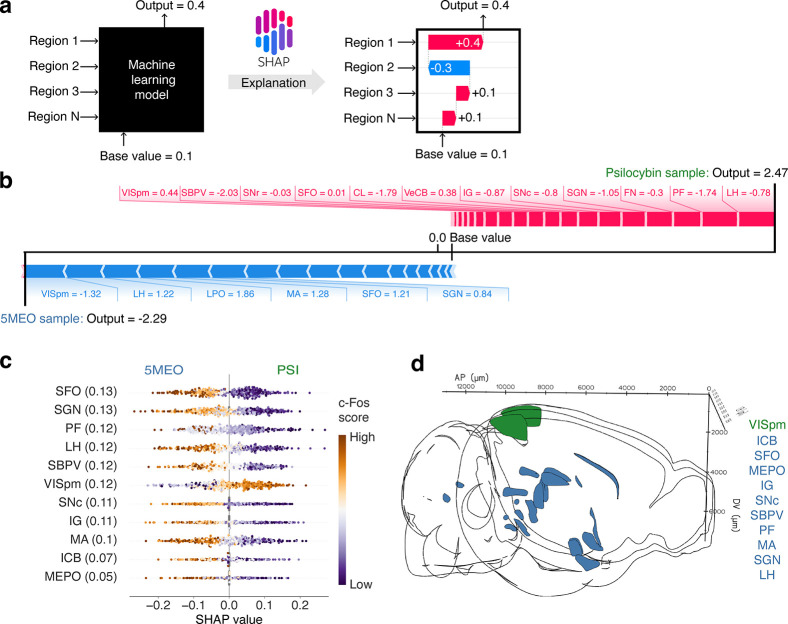
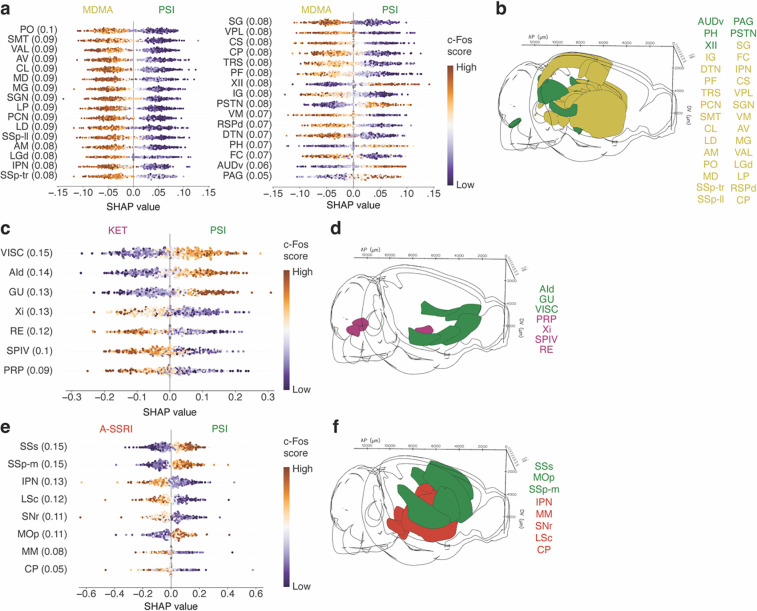
Psilocybin, ketamine, and MDMA are psychoactive compounds that exert behavioral effects with distinguishable but also overlapping features. The growing interest in using these compounds as therapeutics necessitates preclinical assays that can accurately screen psychedelics and related analogs. We posit that a promising approach may be to measure drug action on markers of neural plasticity in native brain tissues. We therefore developed a pipeline for drug classification using light sheet fluorescence microscopy of immediate early gene expression at cellular resolution followed by machine learning. We tested male and female mice with a panel of drugs, including psilocybin, ketamine, 5-MeO-DMT, 6-fluoro-DET, MDMA, acute fluoxetine, chronic fluoxetine, and vehicle. In one-versus-rest classification, the exact drug was identified with 67% accuracy, significantly above the chance level of 12.5%. In one-versus-one classifications, psilocybin was discriminated from 5-MeO-DMT, ketamine, MDMA, or acute fluoxetine with >95% accuracy. We used Shapley additive explanation to pinpoint the brain regions driving the machine learning predictions. Our results support a novel approach for characterizing and validating psychoactive drugs with psychedelic properties.

Keywords: MDMA; Psilocybin; antidepressant; drug discovery; entactogen; immediate early gene; ketamine; neural plasticity.


Conflict of interest statement

Competing interests A.C.K. has been a scientific advisor or consultant for Boehringer Ingelheim, Empyrean Neuroscience, Freedom Biosciences, and Psylo. A.C.K. has received research support from Intra-Cellular Therapies. A.P.K has received research support from Transcend Therapeutics and Freedom Biosciences. A.P.K. has a provisional patent application related to psychedelics. The other authors report no financial relationships with commercial interests.

Figures

Fig. 1.
Fig. 1.. Imaging brain-wide c-Fos expression at cellular resolution following drug administration.
a. Chemical structures for the 8 conditions included in this study: psilocybin (PSI), ketamine (KET), 5-MeO-DMT (5MEO), 6-fluoro-DMT (6-F-DET), MDMA, acute fluoxetine (A-SSRI), chronic fluoxetine (C-SSRI, daily for 14 days), and saline vehicle (SAL). b. Time course of head-twitch response following the administration of 5-MeO-DMT, psilocybin, 6-fluoro-DET, or saline vehicle. Line, mean. Shading, 95% confidence interval based on 1000 bootstraps. N = 3 males and 3 females for each drug, except 4 males and 3 females for saline. c. Box plot of the total number of head twitches detected within a 2-hour period after drug administration. Wilcoxon rank-sum test. *, P < 0.05, **, P < 0.01. d. Experimental timeline. e. Box plot of the total number of c-Fos+ cells in the brain for each drug condition. Cross, female individual. Circle, male individual. N = 64 mice, including 4 males and 4 females for each drug. f. An example of the fluorescence images of c-Fos+ cells in the mouse brain for a psilocybin-treated mouse acquired by light sheet fluorescence microscopy. Inset, magnified view of the dorsal anterior cingulate cortex. For b and c, the psilocybin and saline vehicle data had been shown in a prior study.
Fig. 2.
Fig. 2.. c-Fos+ cell density listed by brain region for all samples by drugs.
The c-Fos+ cell density was defined as the c-Fos+ cell count in each brain region divided by the total number of c-Fos+ cells in each brain and the spatial volume of the brain region. The pixels in the heatmap are positioned by brain region (row) and animal grouped by drug (column). The intensity of the pixel is pseudo-colored by the value of the c-Fos+ cell density. The brain regions including acronyms and other details are provided in Supplementary Table 1.
Fig. 3.
Fig. 3.. A machine learning pipeline for drug prediction and performance of one-versus-rest classification.
a. The pipeline consisted of three steps. First, c-Fos+ cell counts for each brain region undergo normalization, Yeo-Johnson transformation, and robust scaling, into c-Fos scores. Second, the Boruta procedure is used to select the set of informative brain regions. Third, c-Fos scores from this set of brain regions were used to fit a ridge logistic regression model. For each iteration, 75% of the data in each drug condition were used for region selection and training through the three steps, and the remaining 25% of the data were withheld initially, but then processed and tested with the ridge logistic regression model. The entire process was iterated using different splits of the data for 100 times. b. Linear discriminant analysis of the c-Fos scores to visualize the data in a low dimensional space. c. The confusion matrix showing the mean proportion of predicted labels for each of the true labels across all splits. d. The composite precision-recall curves for each drug condition across all splits and the grand average across all drugs. The values in parentheses are the area under the precision-recall curve for the compounds.
Fig. 4.
Fig. 4.. Performance of one-versus-one classification.
a. Schematic illustrating the one-versus-one classification problem. b. The mean area under the precision-recall curve across all splits for different binary classifiers. Dark gray, real data. Light gray, shuffled data. c. The number of brain regions selected via the Boruta procedure for inclusion in the regression model. d. Heatmaps showing the fraction of splits when a cortical (left) or thalamic (right) region was included in the regression model. The regions are sorted based on usage in all classifiers. Regions that were included in <75% of the splits across all conditions are not shown.
Fig. 5.
Fig. 5.. Shapley additive explanation for identifying brain regions driving the prediction of 5-MeO-DMT from psilocybin.
a. Diagram illustrating the concept behind SHAP values. The ridge regression model is akin to a black box that takes c-Fos scores as inputs to produce a prediction. SHAP values can be computed to quantitatively assess how strong and in what direction the c-Fos score of each brain region contributes to the prediction. b. Example force plots for a psilocybin sample and a 5-MeO-DMT sample from one split, illustrating how actual c-Fos scores of brain regions add to shift the model’s output from the base value to the final value. c. Plot relating a region’s c-Fos scores to the SHAP values across individual splits of the 100 iterations for the 5-MeO-DMT-versus-psilocybin classification. Brain regions were shown only if they were used by >=75% of the splits and listed in rank order by the absolute value of the mean difference in SHAP values between the two drug conditions. The values in parentheses are the absolute value of the mean difference in SHAP values between the two drug conditions. d. Visualization of the brain regions included in c, color coded according to the compound which evoked higher c-Fos score in the region.
Fig. 6.
Fig. 6.. Brain regions driving the prediction of MDMA, ketamine, or fluoxetine from psilocybin.
a, b. Similar to Fig. 5c, d for MDMA-versus psilocybin classification. c, d. Similar to Fig. 5c, d for ketamine-versus psilocybin classification. e, f. Similar to Fig. 5c, d for acute fluoxetine-versus psilocybin classification.

Similar articles

References

    1. Kelmendi B, Kaye AP, Pittenger C, Kwan AC. Psychedelics. Curr Biol 32, R63–R67 (2022). - PMC - PubMed
    1. Vollenweider FX, Preller KH. Psychedelic drugs: neurobiology and potential for treatment of psychiatric disorders. Nat Rev Neurosci 21, 611–624 (2020). - PubMed
    1. Davis AK, et al. Effects of Psilocybin-Assisted Therapy on Major Depressive Disorder: A Randomized Clinical Trial. JAMA Psychiatry 78, 481–489 (2021). - PMC - PubMed
    1. Carhart-Harris R, et al. Trial of Psilocybin versus Escitalopram for Depression. N Engl J Med 384, 1402–1411 (2021). - PubMed
    1. Goodwin GM, et al. Single-Dose Psilocybin for a Treatment-Resistant Episode of Major Depression. N Engl J Med 387, 1637–1648 (2022). - PubMed

Publication types