[Preprint]. 2024 Nov 7:2024.05.24.24307811.
doi: 10.1101/2024.05.24.24307811.

Fine-scale spatial and social patterns of SARS-CoV-2 transmission from identical pathogen sequences

Affiliations

Fine-scale spatial and social patterns of SARS-CoV-2 transmission from identical pathogen sequences

Cécile Tran-Kiem et al. medRxiv. .

Update in

  • Fine-scale patterns of SARS-CoV-2 spread from identical pathogen sequences.
    Tran-Kiem C, Paredes MI, Perofsky AC, Frisbie LA, Xie H, Kong K, Weixler A, Greninger AL, Roychoudhury P, Peterson JM, Delgado A, Halstead H, MacKellar D, Dykema P, Gamboa L, Frazar CD, Ryke E, Stone J, Reinhart D, Starita L, Thibodeau A, Yun C, Aragona F, Black A, Viboud C, Bedford T. Tran-Kiem C, et al. Nature. 2025 Apr;640(8057):176-185. doi: 10.1038/s41586-025-08637-4. Epub 2025 Mar 5. Nature. 2025. PMID: 40044856 Free PMC article.

Abstract

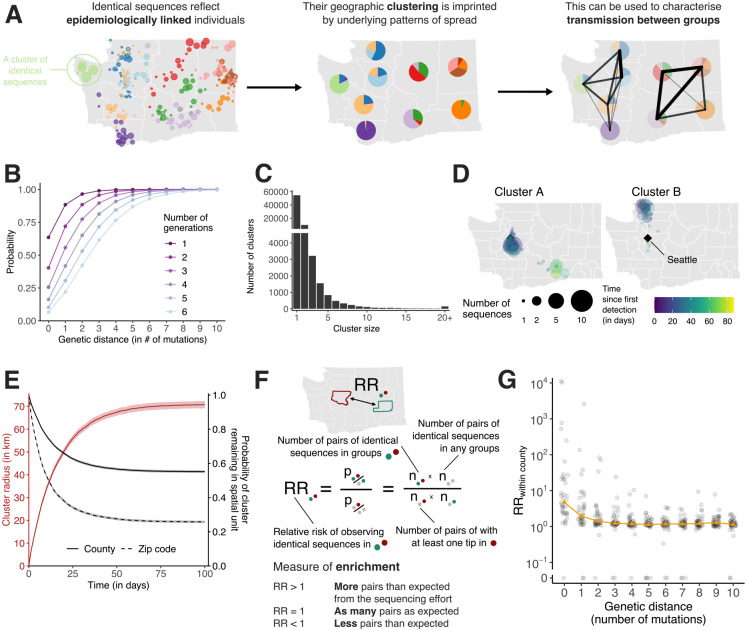
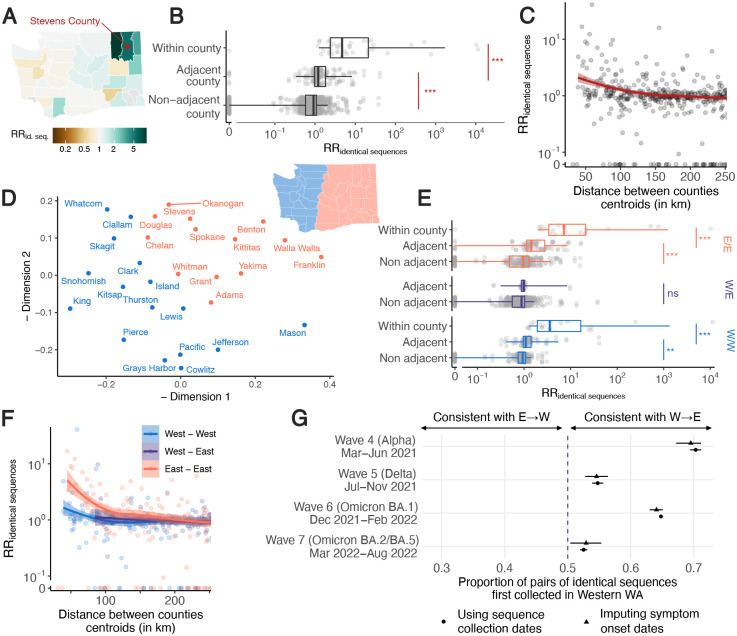
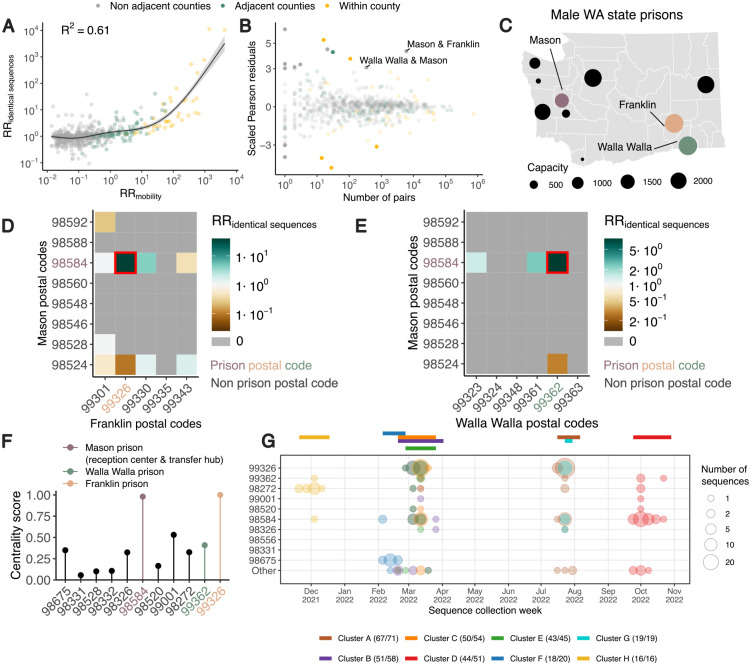
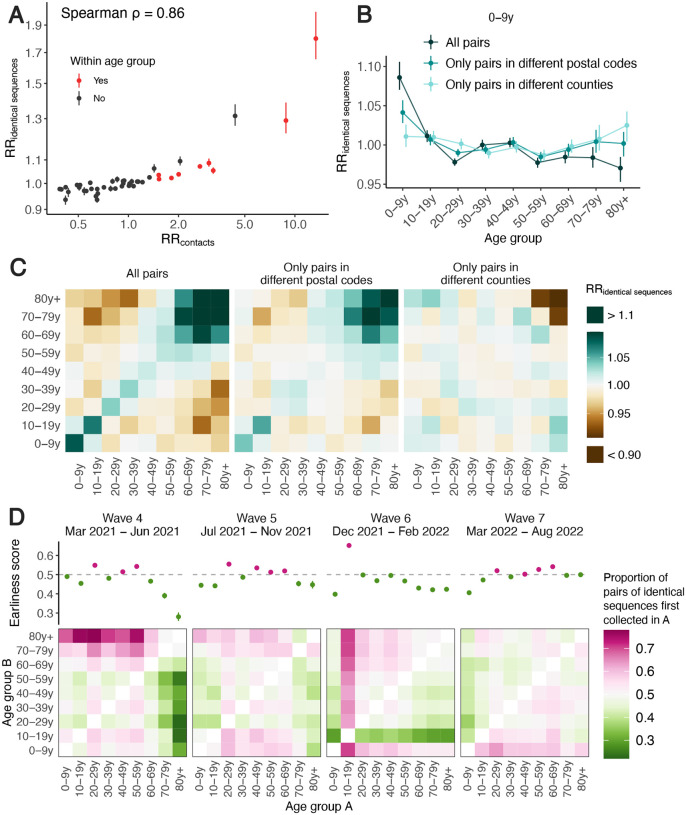
Pathogen genomics can provide insights into underlying infectious disease transmission patterns, but new methods are needed to handle modern large-scale pathogen genome datasets and realize this full potential. In particular, genetically proximal viruses should be highly informative about transmission events as genetic proximity indicates epidemiological linkage. Here, we leverage pairs of identical sequences to characterise fine-scale transmission patterns using 114,298 SARS-CoV-2 genomes collected through Washington State (USA) genomic sentinel surveillance with associated age and residence location information between March 2021 and December 2022. This corresponds to 59,660 sequences with another identical sequence in the dataset. We find that the location of pairs of identical sequences is highly consistent with expectations from mobility and social contact data. Outliers in the relationship between genetic and mobility data can be explained by SARS-CoV-2 transmission between postal codes with male prisons, consistent with transmission between prison facilities. We find that transmission patterns between age groups vary across spatial scales. Finally, we use the timing of sequence collection to understand the age groups driving transmission. Overall, this work improves our ability to leverage large pathogen genome datasets to understand the determinants of infectious disease spread.


Conflict of interest statement

ALG reports contract testing from Abbott, Cepheid, Novavax, Pfizer, Janssen and Hologic, research support from Gilead, and salary and stock grants for LabCorp an immediate family member, outside of the described work. All other authors declare no competing interests.

Figures

Figure 1.
Figure 1.. Temporal and spatial signature of spread in clusters of identical SARS-CoV-2 sequences.
A. The clustering of identical pathogen sequences across population groups reflects underlying disease transmission patterns at the population level and can be use to characterise spread patterns between groups. In this toy figure, each colour represents a different cluster of identical sequences. B. Probability for two individuals separated by a fixed number of transmission generations of being infected by viruses at a given genetic distance assuming a Poisson process for the occurrence of substitutions (at a rate μ=8.9810-2 substitutions per day) and Gamma distributed generation time (of mean 5.9 days and standard deviation 4.8 days). C. Size distribution of clusters of identical sequences in the WA dataset. Clusters of size 1 correspond to singletons and are hence not included in the relative risk computations. D. Spatio-temporal dynamics of sequence collection in two large clusters of identical sequences. Black diamonds indicate the location of Seattle, the largest city in WA. E. Radius of clusters of identical sequences and probability for all sequences within a cluster of identical sequences of remaining in the same spatial units as a function of time since first sequence collection. In D, the cluster radius is computed as the mean spatial expansion of clusters of identical sequences. F. Definition of the relative risk of observing pairs of sequences in two subgroups as a measure of enrichment. G. Relative risk of observing pairs of sequences within the same county as a function of the genetic distance separating them. Grey points correspond to values for individual counties. Orange triangles correspond to the median across counties.
Figure 2.
Figure 2.. Identical sequences reveal patterns of spread between WA counties.
A. Illustration of the pairwise relative risk of observing identical sequences between counties, using sequences shared between Stevens County (red point) and other counties in WA as an example. Similar maps for the other counties are depicted in Figure S6. B. Relative risk of observing pairs of identical sequences by counties’ adjacency status. C. Relative risk of observing pairs of identical sequences as a function of the geographic distance between counties’ centroids. D. Similarity between WA counties obtained from MDS based on the relative risk of observing pairs of identical sequences in two counties. Counties are colored by East / West region membership. E. Relative risk of observing pairs of identical sequences by counties’ adjacency status stratified by counties East / West region membership. F. Relative risk of observing pairs of identical sequences as a function of the geographic distance between counties’ centroids stratified by counties East / West region membership. G. Proportion of pairs of identical sequences observed in Eastern and Western WA that were first observed in Western WA. In C and F, the lines correspond to LOESS curves on the logarithmic scale. In B and E, p-values for Wilcoxon tests: *** < 0.0001, ** < 0.001, * < 0.05, ns ≥ 0.05. In B, Wwithin,adjacent=6195p=3.710-12 and Wadjacent,non adjacent=65542p<2.210-16. In E, for within Eastern WA, Wwithin,adjacent=120.5p=6.710-6 and Wadjacent,non adjacent=4555.5p=4.010-6. For within Western WA, Wwithin,adjacent=95p=9.910-7 and Wadjacent,non adjacent=4555.53626p=1.110-4. For between Eastern and Western WA, W=2719(p=0.17).
Figure 3.
Figure 3.. Comparison of the location of identical sequences with expectations from mobility data reveals spread between WA male prisons’ postal codes.
A. Relationship between the relative risk of observing identical sequences in two counties and the relative risk of movement between these counties as obtained from mobile phone mobility data. The trend line corresponds to predicted relative risk of observing identical sequences in two regions from a GAM. R2 indicates the variance explained by the GAM. B. Scaled Pearson residuals of the GAM plotted in A as a function of the number of pairs of identical sequences observed in pairs of counties. C. Map of male state prisons in WA. Mason, Walla Walla and Franklin male prisons are colored. D. Relative risk of observing identical sequence between Mason and Franklin County’s postal codes. E. Relative risk of observing identical sequence between Mason and Walla Walla County’s postal codes. F. Centrality score (eigenvector centrality) for each postal code that is the home of a male state prison. G. Week of sequence collection of 8 large clusters of identical sequences identified in postal codes with WA male state prisons. In G, the top colored segments indicate the period during which each cluster was identified.
Figure 4.
Figure 4.. Patterns of SARS-CoV-2 transmission between age groups in WA.
A. Relative risk of observing pairs of identical sequences in two age groups as a function of the relative risk of contact between these age groups. B. Impact of the spatial scale on the relative risk of observing pairs of identical sequences in the 0–9 y.o. and other age groups. We display similar plots for the other age groups in Figure S20. C. Relative risk of observing identical sequences between two age groups across all pairs of sequences, only pairs in different postal codes and only pairs in different counties. D. Proportion of pairs of identical sequences observed in age groups A and B that were first collected in age group A across different epidemic waves (heatmaps). The dot plots depict the earliness scores of age group A across epidemic waves. In A and B, vertical segments correspond to 95% subsampling confidence intervals. In D, vertical segments correspond to 95% binomial confidence intervals. In D, the heatmaps represent symmetric matrices P=pi,j characterised by pi,j+pj,i=1.

Similar articles

  • Fine-scale patterns of SARS-CoV-2 spread from identical pathogen sequences.
    Tran-Kiem C, Paredes MI, Perofsky AC, Frisbie LA, Xie H, Kong K, Weixler A, Greninger AL, Roychoudhury P, Peterson JM, Delgado A, Halstead H, MacKellar D, Dykema P, Gamboa L, Frazar CD, Ryke E, Stone J, Reinhart D, Starita L, Thibodeau A, Yun C, Aragona F, Black A, Viboud C, Bedford T. Tran-Kiem C, et al. Nature. 2025 Apr;640(8057):176-185. doi: 10.1038/s41586-025-08637-4. Epub 2025 Mar 5. Nature. 2025. PMID: 40044856 Free PMC article.
  • Within-host diversity improves phylogenetic and transmission reconstruction of SARS-CoV-2 outbreaks.
    Torres Ortiz A, Kendall M, Storey N, Hatcher J, Dunn H, Roy S, Williams R, Williams C, Goldstein RA, Didelot X, Harris K, Breuer J, Grandjean L. Torres Ortiz A, et al. Elife. 2023 Sep 21;12:e84384. doi: 10.7554/eLife.84384. Elife. 2023. PMID: 37732733 Free PMC article.
  • Cryptic transmission of SARS-CoV-2 in Washington State.
    Bedford T, Greninger AL, Roychoudhury P, Starita LM, Famulare M, Huang ML, Nalla A, Pepper G, Reinhardt A, Xie H, Shrestha L, Nguyen TN, Adler A, Brandstetter E, Cho S, Giroux D, Han PD, Fay K, Frazar CD, Ilcisin M, Lacombe K, Lee J, Kiavand A, Richardson M, Sibley TR, Truong M, Wolf CR, Nickerson DA, Rieder MJ, Englund JA; Seattle Flu Study Investigators; Hadfield J, Hodcroft EB, Huddleston J, Moncla LH, Müller NF, Neher RA, Deng X, Gu W, Federman S, Chiu C, Duchin J, Gautom R, Melly G, Hiatt B, Dykema P, Lindquist S, Queen K, Tao Y, Uehara A, Tong S, MacCannell D, Armstrong GL, Baird GS, Chu HY, Shendure J, Jerome KR. Bedford T, et al. medRxiv [Preprint]. 2020 Apr 6:2020.04.02.20051417. doi: 10.1101/2020.04.02.20051417. medRxiv. 2020. Update in: Science. 2020 Oct 30;370(6516):571-575. doi: 10.1126/science.abc0523. PMID: 32511596 Free PMC article. Updated. Preprint.
  • Sentinel Surveillance System Implementation and Evaluation for SARS-CoV-2 Genomic Data, Washington, USA, 2020-2021.
    Oltean HN, Allen KJ, Frisbie L, Lunn SM, Torres LM, Manahan L, Painter I, Russell D, Singh A, Peterson JM, Grant K, Peter C, Cao R, Garcia K, Mackellar D, Jones L, Halstead H, Gray H, Melly G, Nickerson D, Starita L, Frazar C, Greninger AL, Roychoudhury P, Mathias PC, Kalnoski MH, Ting CN, Lykken M, Rice T, Gonzalez-Robles D, Bina D, Johnson K, Wiley CL, Magnuson SC, Parsons CM, Chapman ED, Valencia CA, Fortna RR, Wolgamot G, Hughes JP, Baseman JG, Bedford T, Lindquist S. Oltean HN, et al. Emerg Infect Dis. 2023 Feb;29(2):242-251. doi: 10.3201/eid2902.221482. Epub 2023 Jan 3. Emerg Infect Dis. 2023. PMID: 36596565 Free PMC article. Review.
  • The role of pathogen genomics in assessing disease transmission.
    Sintchenko V, Holmes EC. Sintchenko V, et al. BMJ. 2015 May 11;350:h1314. doi: 10.1136/bmj.h1314. BMJ. 2015. PMID: 25964672 Review.

References

    1. Russell CA, Jones TC, Barr IG, Cox NJ, Garten RJ, et al. (2008) The global circulation of seasonal influenza a (H3N2) viruses. Science 320: 340–346. - PubMed
    1. Bedford T, Riley S, Barr IG, Broor S, Chadha M, et al. (2015) Global circulation patterns of seasonal influenza viruses vary with antigenic drift. Nature 523: 217–220. - PMC - PubMed
    1. Moncla LH, Black A, DeBolt C, Lang M, Graff NR, et al. (2021) Repeated introductions and intensive community transmission fueled a mumps virus outbreak in washington state. Elife 10. - PMC - PubMed
    1. Layan M, Müller NF, Dellicour S, De Maio N, Bourhy H, et al. (2023) Impact and mitigation of sampling bias to determine viral spread: Evaluating discrete phylogeography through CTMC modeling and structured coalescent model approximations. Virus Evol 9: vead010. - PMC - PubMed
    1. Brito AF, Semenova E, Dudas G, Hassler GW, Kalinich CC, et al. (2022) Global disparities in SARS-CoV-2 genomic surveillance. Nat Commun 13: 7003. - PMC - PubMed

Publication types