[Preprint]. 2024 Aug 14:2024.03.27.587041.
doi: 10.1101/2024.03.27.587041.

Human BioMolecular Atlas Program (HuBMAP): 3D Human Reference Atlas Construction and Usage

Affiliations

Human BioMolecular Atlas Program (HuBMAP): 3D Human Reference Atlas Construction and Usage

Katy Börner et al. bioRxiv. .

Update in

  • Human BioMolecular Atlas Program (HuBMAP): 3D Human Reference Atlas construction and usage.
    Börner K, Blood PD, Silverstein JC, Ruffalo M, Satija R, Teichmann SA, Pryhuber GJ, Misra RS, Purkerson JM, Fan J, Hickey JW, Molla G, Xu C, Zhang Y, Weber GM, Jain Y, Qaurooni D, Kong Y; HRA Team; Bueckle A, Herr BW 2nd. Börner K, et al. Nat Methods. 2025 Apr;22(4):845-860. doi: 10.1038/s41592-024-02563-5. Epub 2025 Mar 13. Nat Methods. 2025. PMID: 40082611 Free PMC article.

Abstract

The Human BioMolecular Atlas Program (HuBMAP) aims to construct a reference 3D structural, cellular, and molecular atlas of the healthy adult human body. The HuBMAP Data Portal (https://portal.hubmapconsortium.org) serves experimental datasets and supports data processing, search, filtering, and visualization. The Human Reference Atlas (HRA) Portal (https://humanatlas.io) provides open access to atlas data, code, procedures, and instructional materials. Experts from more than 20 consortia are collaborating to construct the HRA's Common Coordinate Framework (CCF), knowledge graphs, and tools that describe the multiscale structure of the human body (from organs and tissues down to cells, genes, and biomarkers) and to use the HRA to understand changes that occur at each of these levels with aging, disease, and other perturbations. The 6th release of the HRA v2.0 covers 36 organs with 4,499 unique anatomical structures, 1,195 cell types, and 2,089 biomarkers (e.g., genes, proteins, lipids) linked to ontologies and 2D/3D reference objects. New experimental data can be mapped into the HRA using (1) three cell type annotation tools (e.g., Azimuth) or (2) validated antibody panels (OMAPs), or (3) by registering tissue data spatially. This paper describes the HRA user stories, terminology, data formats, ontology validation, unified analysis workflows, user interfaces, instructional materials, application programming interface (APIs), flexible hybrid cloud infrastructure, and previews atlas usage applications.


Figures

Figure 1:
Figure 1:. Human Reference Atlas (HRA) components and linkages.
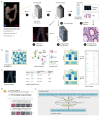
a. The anatomical structures, cell types and biomarkers (ASCT+B) tables document the nested part_of structure of organs (e.g., cells that make up functional tissue units, successively larger anatomical structures, an entire organ such as the kidney, which is part_of the body). The cells that make up (are located_in) each of the anatomical structures are organized in a multi-level cell type typology with ‘cell’ at the root and more and more specialized child nodes. The biomarkers used to characterize cell types might have one of five types: genes, proteins, metabolites, proteoforms, and lipids organized in a biomarker typology. Gray arrows indicate crosswalks that connect other HRA DOs to ASCT+B tables. b. The HRA 3D reference objects represent the shape, size, location, and rotation of 1,215 3D anatomical structures of 356 types for 65 organs with crosswalks to ASCT+B tables. Shown are ‘renal papilla’ and ‘renal pyramid’ in the kidney. c. 2D reference illustrations document the shape, size, and spatial layout of 3,726 2D cells of 131 types for 22 FTUs in 10 organs with crosswalks to ASCT+B tables. Shown is the kidney nephron. d. Labeled training data exist for FTUs in five organs with crosswalks (gray arrows) to anatomical structures and cell types in the ASCT+B tables. e. 13 Organ Mapping Antibody Panels (OMAPs) are linked to 197 Antibody Validation Reports (AVRs) and there exist crosswalks to cell types and biomarkers in ASCT+B tables. f. 10 Azimuth references for healthy adult organs plus crosswalks to cell types and biomarkers in ASCT+B tables. g. HRApop reports cell type populations for anatomical structures compiled from single-cell experimental data. Exemplarily shown is the left cardiac atrium (blue) and the interventricular septum (orange) of the female heart plus a bar graph with the top-five cell types that have the highest percentage across these two anatomical structures. Note that some cell types appear only in one anatomical structure. Annotations were made with Azimuth. h. The HRAlit database links HRA DOs to existing ontologies (e.g., Uberon, CL), expert ORCID, publication evidence, funding, and experimental data used for HRApop computation.
Figure 2:
Figure 2:. Mapping experimental data to the HRA.
a. A tissue block is 3D spatially registered and semantically annotated using the Registration User Interface or the Millitome, see (1). A smaller part of the tissue block might be used for sc/snRNA-seq analysis (not shown) or cut into tissue sections (2). Tissue sections are analyzed using one or more assay types (3). Shown are single cell transcriptomics (e.g., sc/snRNA-seq), OMAP-aligned spatial proteomics (e.g., CODEX, Cell DIVE), and high resolution hematoxylin and eosin (H&E) stained histology images. Spatial alignment of different assay types for the very same or different tissue sections is non-trivial (5). H&E data is used to segment functional tissue units (FTUs) using trained machine learning models (6). 3D reconstruction of tissue volumes is accomplished by aligning data from multiple serial tissue sections computationally (4) followed by 3D segmentation and annotation (7). 2D or 3D data is analyzed to identify the distance of different cell types to the vasculature (VCCF Visualizations) as a multiscale common coordinate framework from which no other cell is very distant (8). b. Single cell/nucleus data (sc/snRNA-seq) is stored as a cell by gene matrix; cell types are annotated using Azimuth or other cell type annotation tools; results are aggregated to cell type by gene biomarker expression value matrices that are aligned with the ASCT+B tables; and are used in diverse HRA user interfaces (e.g., Exploration User Interface and FTU Explorer). c. OMAP-aligned spatial data generated using validated antibody panels linked to AVRs are analyzed to compute cell type by protein biomarker expression value matrices that are aligned with the ASCT+B tables using semi-automated workflows. d. The Exploration User Interface provides full provenance for donors (sex, age, BMI), data providers (upload date, contact name, affiliation), tissue blocks and sections (size, number, date, and contact info for RUI registration), and datasets (assay type) with links to raw data in the HuBMAP Data Portal, other data portals, or publications. e. CWL workflows detail what tools (yellow) are run on which input/output data (blue). Shown is the Azimuth cell type annotation workflow.
Figure 3:
Figure 3:. Human Reference Atlas Usage.
a. HRA can be used to compare the distribution of parenchymal cells including endothelial, epithelial, and muscle that compose the blood vessels, airways and gas exchanging functional lung structures, and resident immune cells including macrophages, to local vasculature (VCCF Visualizations) in healthy (top) and diseased (bottom) lung using multiplexed immunofluorescence microscopy images with bronchiole (br) and an accompanying small pulmonary artery (pa). Scale bar legend: white: 5 mm, red: 200 μm, yellow: 100 μm. The graphs on the right show distance distributions for cell types present in the healthy lung (top) and diseased BPD lung (bottom); the violin plot (middle) shows a comparison between distance distributions for cell types common in both datasets. Datasets are on GitHub. b. Multi-level cell neighborhoods can be computed to analyze and communicate the structure and function of FTUs; tissue image with cell type annotations and zoom into H&E with FTU segmentations (red outlines) and zoom into the multiplexed image (CODEX) is shown in left, neighborhoods are given in the middle; hierarchy of FTUs, neighborhoods, communities, and cell types are shown on the right. Datasets are on GitHub.

Similar articles

References

    1. HuBMAP Consortium et al. The human body at cellular resolution: the NIH Human Biomolecular Atlas Program. Nature 574, 187–192 (2019). - PMC - PubMed
    1. Jain S. et al. Advances and prospects for the Human BioMolecular Atlas Program (HuBMAP). Nat. Cell Biol. (2023) doi: 10.1038/s41556-023-01194-w. - DOI - PMC - PubMed
    1. Börner K. et al. Anatomical structures, cell types and biomarkers of the Human Reference Atlas. Nat. Cell Biol. 23, 1117–1128 (2021). - PMC - PubMed
    1. Hunter P. et al. A vision and strategy for the virtual physiological human: 2012 update. Interface Focus 3, 20130004 (2013). - PMC - PubMed
    1. De Bono B., Safaei S., Grenon P. & Hunter P. Meeting the multiscale challenge: representing physiology processes over ApiNATOMY circuits using bond graphs. Interface Focus 8, 20170026 (2018). - PMC - PubMed

Publication types