[Preprint]. 2024 May 24:rs.3.rs-4356333.
doi: 10.21203/rs.3.rs-4356333/v1.

Microfluidic Ecology Unravels the Genetic and Ecological Drivers of T4r Bacteriophage Resistance in E. coli: Insights into Biofilm-Mediated Evolution

Affiliations

Microfluidic Ecology Unravels the Genetic and Ecological Drivers of T4r Bacteriophage Resistance in E. coli: Insights into Biofilm-Mediated Evolution

Krisztina Nagy et al. Res Sq. .

Abstract

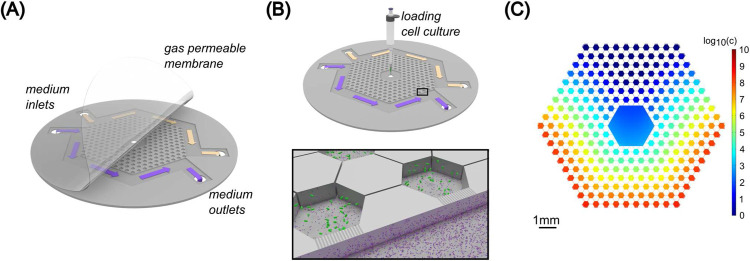
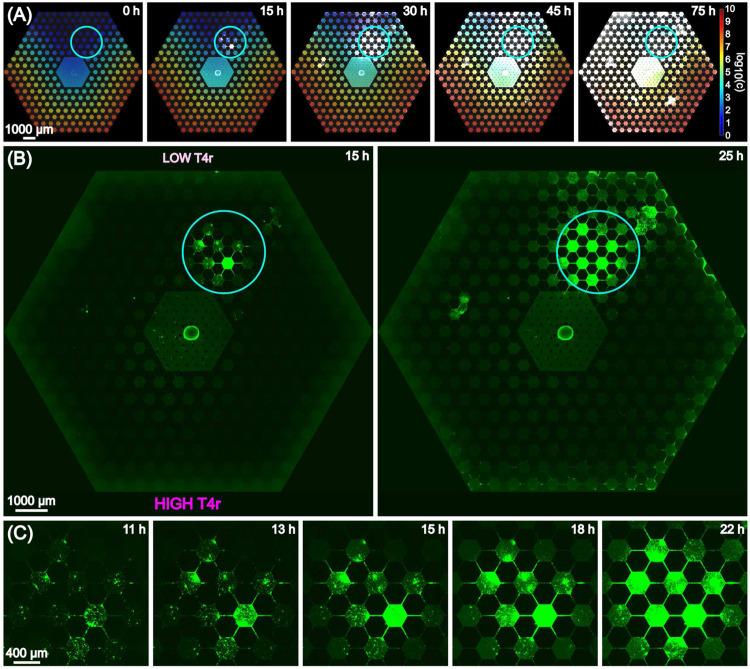
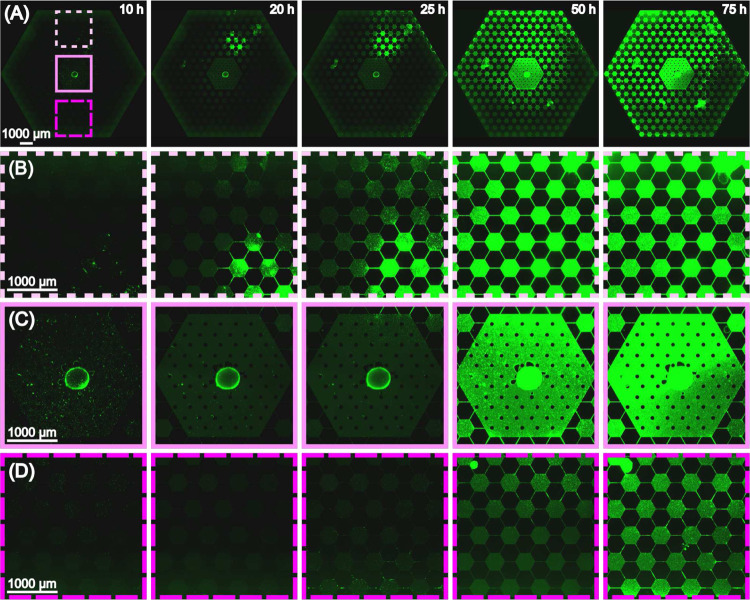
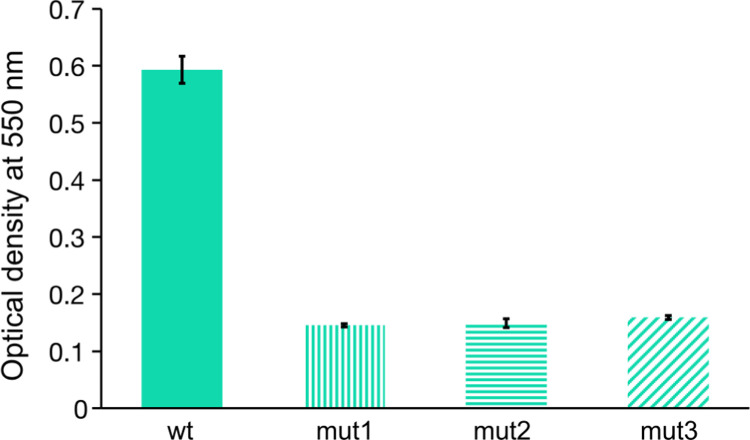
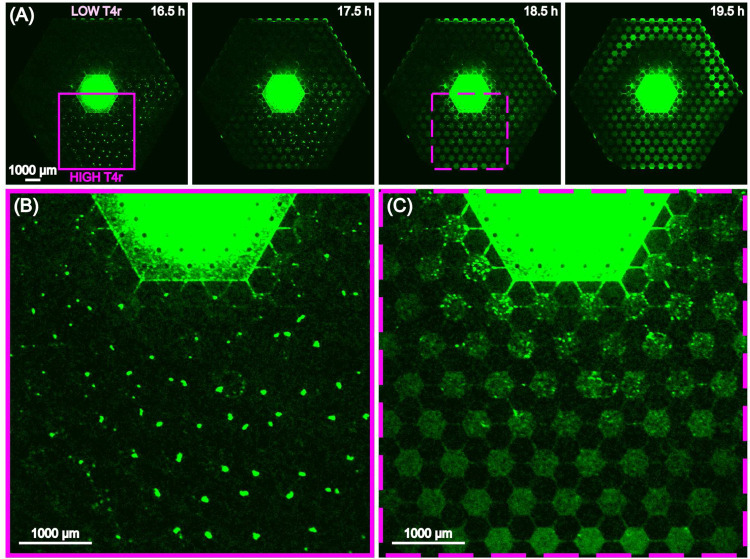
We use a microfluidic ecology which generates non-uniform phage concentration gradients and micro-ecological niches to reveal the importance of time, spatial population structure and collective population dynamics in the de novo evolution of T4r bacteriophage resistant motile E. coli. An insensitive bacterial population against T4r phage occurs within 20 hours in small interconnected population niches created by a gradient of phage virions, driven by evolution in transient biofilm patches. Sequencing of the resistant bacteria reveals mutations at the receptor site of bacteriophage T4r as expected but also in genes associated with biofilm formation and surface adhesion, supporting the hypothesis that evolution within transient biofilms drives de novo phage resistance.


Conflict of interest statement

Additional Declarations: There is NO Competing Interest.

Figures

Figure 1.
Figure 1.
Microfluidic setup. A) 3D drawing of the microfluidic device (not-to-scale). The etched silicon chip is sealed with a 25 μm thick gas permeable LUMOX film, pressurized from the front. Arrows indicate the direction of medium flow. Yellow color is used for pure LB (top channel) and the purple color corresponds to LB supplemented with T4r phages (bottom channel). B) Mounting of the chip in a LUMOX dish with applied external sealing back air pressure. Bacteria are inoculated into the middle inlet hole with a pipette. The inset shows the phage (purple particles) gradient forming from the bottom channel. Shallow (100 nm deep) nanoslits connect the side channels and the outer hexagon chambers. C) Simulation of the phage gradient present in the device at the initial stage of the experiment. Phage concentration c is indicated by the colorbar in logarithmic scale. The unit of c is virion/ml.
Figure 2.
Figure 2.
Progression of bacterial growth in T4r phage gradient. The emergence of an insensitive population at the low-phage concentration side of the device is outlined by a solid circle. (A) Snapshots of fluorescence microscopy images overlaid on the calculated T4r concentration gradient over a period of 75 hours. Phage concentration (c) is represented in logarithmic scale. The unit of c is virion/ml. (B) Stitched image of the full microfluidic array from 15 hours to 25 hours after inoculation. The solid blue circle outlines the hot spot of the insensitive bacterial population against T4r phage. (C) Emergence of insensitive sub-population from small clusters of bacteria over a time scale from 11 hours to 22 hours
Figure 3.
Figure 3.
(A) Stitched images of the full array from 10 hours to 75 hours after inoculation. The dashed and solid squares outline regions of the habitat with different phage concentrations. (B) Zoom-in images of the top region of low T4r density.(C) Zoom-in images at the inoculation region in the center of the device. (D) Zoom-in images of the bottom region of high T4r density.
Figure 4.
Figure 4.
Growth properties of the ancestor and three mutant E. coli strains. (A) Growth of the ancestor (red dashed line) and three mutant (mut1: dotted blue line; mut2: continuous yellow line; mut3: dashed green line) strains in phage-free LB media. (B) Growth of the ancestor (red dashed line) and 3 mutant (mut1: dotted blue line; mut2: continuous yellow line; mut3: dashed green line) strains in the presence of high phage concentration (MOI=1000, the initial cell number is 100000). (C) Growth of the ancestor strain in LB media at different MOI. T4r was added to mid-log phase bacteria culture, the initial bacteria cell number is 10000000. (D) Growth of the three mutant strains when applying phage (MOI=10) at mid-log phase culture. The initial cell number is 10000000 (mut1: dotted blue line; mut2: continuous yellow line; mut3: dashed green line).
Figure 5.
Figure 5.
Biofilm forming ability of the ancestral and the mutant strains evolved in the microfluidic device in the presence of bacteriophage T4r gradient. The applied crystal violet staining shows the amount of surface-adhered biofilm after 48 hours of incubation at 37°C. Three replicates were performed for each sample.
Figure 6.
Figure 6.
(A) Expansion of resistant E. coli in a gradient of T4r phage from 16.5 hours after inoculation to 19.5 hours. (B) Expanded view at 16.5 hours of the region at high T4r concentration where the bacteria transiently form small clusters. (C) Rapid dissolution of the bacterial aggregates and movement to nanoslits.

Similar articles

References

    1. Pires D. P., Melo L. D. R., and Azeredo J.. Understanding the complex phage-host interactions in biofilm communities. Annu Rev Virol, 8(1):73–94, 2021. - PubMed
    1. Carlson K. and Kozinski A. W.. Nonreplicated dna and dna fragments in t4r-bacteriophage particles - phenotypic mixing of a phage protein. Journal of Virology, 13(6):1274–1290, 1974. - PMC - PubMed
    1. Burch L. H., Zhang L. L., Chao F. G., Xu H., and Drake J. W.. The bacteriophage t4 rapid-lysis genes and their mutational proclivities. Journal of Bacteriology, 193(14):3537–3545, 2011. - PMC - PubMed
    1. Luria S. E. and Delbruck M.. Mutations of bacteria from virus sensitivity to virus resistance. Genetics, 28(6):491–511, 1943. - PMC - PubMed
    1. Jablonka E. and Raz G.. Transgenerational epigenetic inheritance: Prevalence, mechanisms, and implications for the study of heredity and evolution. Quarterly Review of Biology, 84(2):131–176, 2009. 446lx Times Cited:935 Cited References Count:236. - PubMed

Publication types

LinkOut - more resources