

This is a preprint.
A hierarchy of processing complexity and timescales for natural sounds in human auditory cortex
- PMID: 38826304
- PMCID: PMC11142240
- DOI: 10.1101/2024.05.24.595822
A hierarchy of processing complexity and timescales for natural sounds in human auditory cortex
Update in
-
A hierarchy of processing complexity and timescales for natural sounds in the human auditory cortex.Proc Natl Acad Sci U S A. 2025 May 6;122(18):e2412243122. doi: 10.1073/pnas.2412243122. Epub 2025 Apr 28. Proc Natl Acad Sci U S A. 2025. PMID: 40294254
Abstract
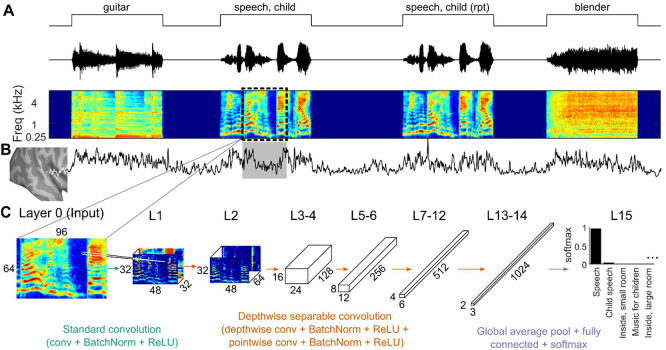
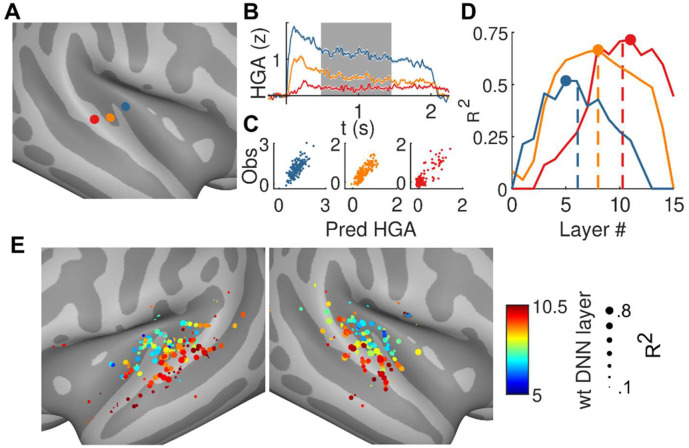
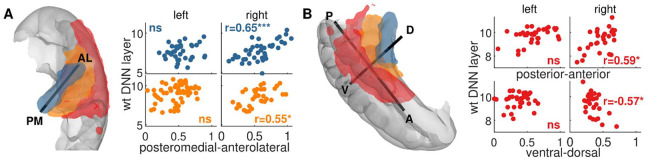
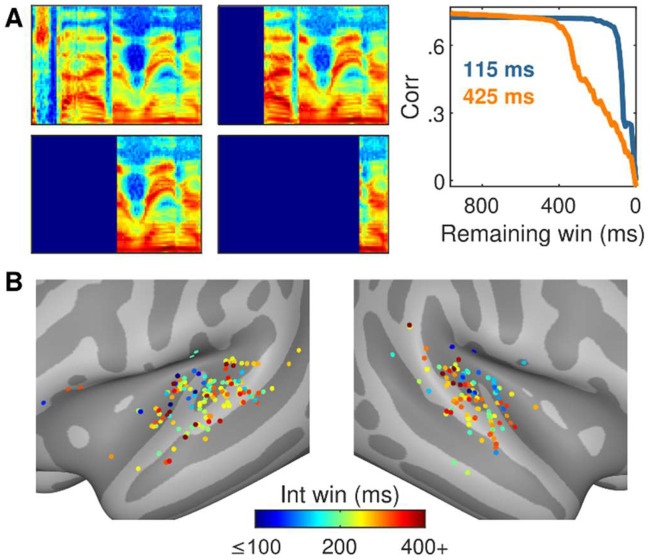
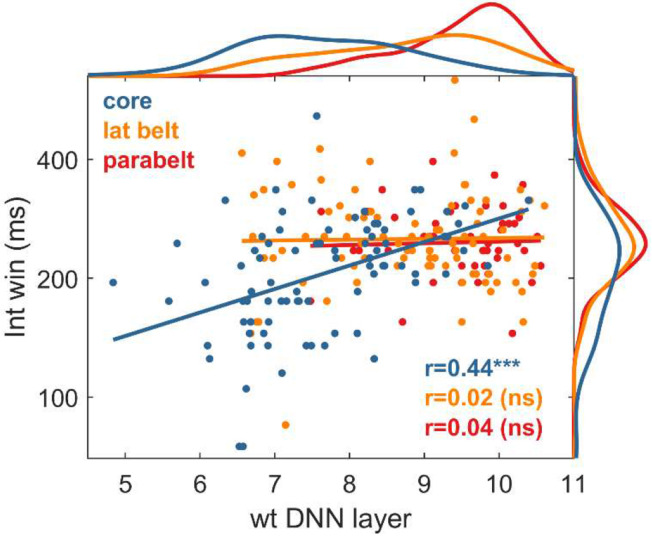
Efficient behavior is supported by humans' ability to rapidly recognize acoustically distinct sounds as members of a common category. Within auditory cortex, there are critical unanswered questions regarding the organization and dynamics of sound categorization. Here, we performed intracerebral recordings in the context of epilepsy surgery as 20 patient-participants listened to natural sounds. We built encoding models to predict neural responses using features of these sounds extracted from different layers within a sound-categorization deep neural network (DNN). This approach yielded highly accurate models of neural responses throughout auditory cortex. The complexity of a cortical site's representation (measured by the depth of the DNN layer that produced the best model) was closely related to its anatomical location, with shallow, middle, and deep layers of the DNN associated with core (primary auditory cortex), lateral belt, and parabelt regions, respectively. Smoothly varying gradients of representational complexity also existed within these regions, with complexity increasing along a posteromedial-to-anterolateral direction in core and lateral belt, and along posterior-to-anterior and dorsal-to-ventral dimensions in parabelt. When we estimated the time window over which each recording site integrates information, we found shorter integration windows in core relative to lateral belt and parabelt. Lastly, we found a relationship between the length of the integration window and the complexity of information processing within core (but not lateral belt or parabelt). These findings suggest hierarchies of timescales and processing complexity, and their interrelationship, represent a functional organizational principle of the auditory stream that underlies our perception of complex, abstract auditory information.
Conflict of interest statement
Conflict of Interest: The authors have declared that no competing interests exist.
Figures
Similar articles
-
A hierarchy of processing complexity and timescales for natural sounds in the human auditory cortex.Proc Natl Acad Sci U S A. 2025 May 6;122(18):e2412243122. doi: 10.1073/pnas.2412243122. Epub 2025 Apr 28. Proc Natl Acad Sci U S A. 2025. PMID: 40294254
-
Cortical connections of auditory cortex in marmoset monkeys: lateral belt and parabelt regions.Anat Rec (Hoboken). 2012 May;295(5):800-21. doi: 10.1002/ar.22451. Epub 2012 Mar 28. Anat Rec (Hoboken). 2012. PMID: 22461313 Free PMC article.
-
Functional organization of human auditory cortex: investigation of response latencies through direct recordings.Neuroimage. 2014 Nov 1;101:598-609. doi: 10.1016/j.neuroimage.2014.07.004. Epub 2014 Jul 12. Neuroimage. 2014. PMID: 25019680 Free PMC article.
-
Processing of complex sounds in the auditory cortex of cat, monkey, and man.Acta Otolaryngol Suppl. 1997;532:34-8. doi: 10.3109/00016489709126142. Acta Otolaryngol Suppl. 1997. PMID: 9442842 Review.
-
Auditory processing in primate cerebral cortex.Curr Opin Neurobiol. 1999 Apr;9(2):164-70. doi: 10.1016/s0959-4388(99)80022-1. Curr Opin Neurobiol. 1999. PMID: 10322185 Review.
References
-
- Giordano B. L., McAdams S., Zatorre R. J., Kriegeskorte N., Belin P., Abstract Encoding of Auditory Objects in Cortical Activity Patterns. Cereb. Cortex 23, 2025–2037 (2013). - PubMed
-
- Staib M., Frühholz S., Cortical voice processing is grounded in elementary sound analyses for vocalization relevant sound patterns. Prog. Neurobiol. 200, 101982 (2021). - PubMed
Publication types
Grants and funding
LinkOut - more resources
Full Text Sources