

This is a preprint.
Evaluation of altered cell-cell communication between glia and neurons in the hippocampus of 3xTg-AD mice at two time points
- PMID: 38826305
- PMCID: PMC11142088
- DOI: 10.1101/2024.05.21.595199
Evaluation of altered cell-cell communication between glia and neurons in the hippocampus of 3xTg-AD mice at two time points
Update in
-
Evaluation of altered cell-cell communication between glia and neurons in the hippocampus of 3xTg-AD mice at two time points.J Cell Commun Signal. 2025 Feb 28;19(1):e70006. doi: 10.1002/ccs3.70006. eCollection 2025 Mar. J Cell Commun Signal. 2025. PMID: 40026671 Free PMC article.
Abstract
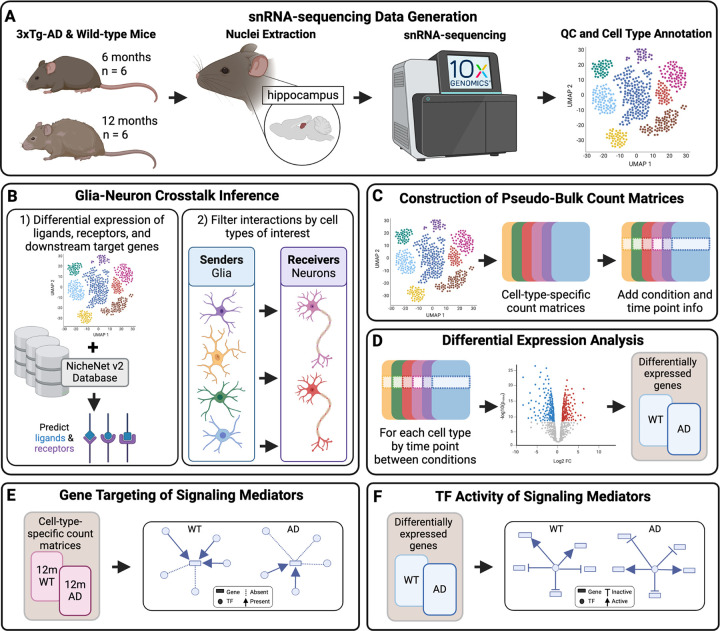
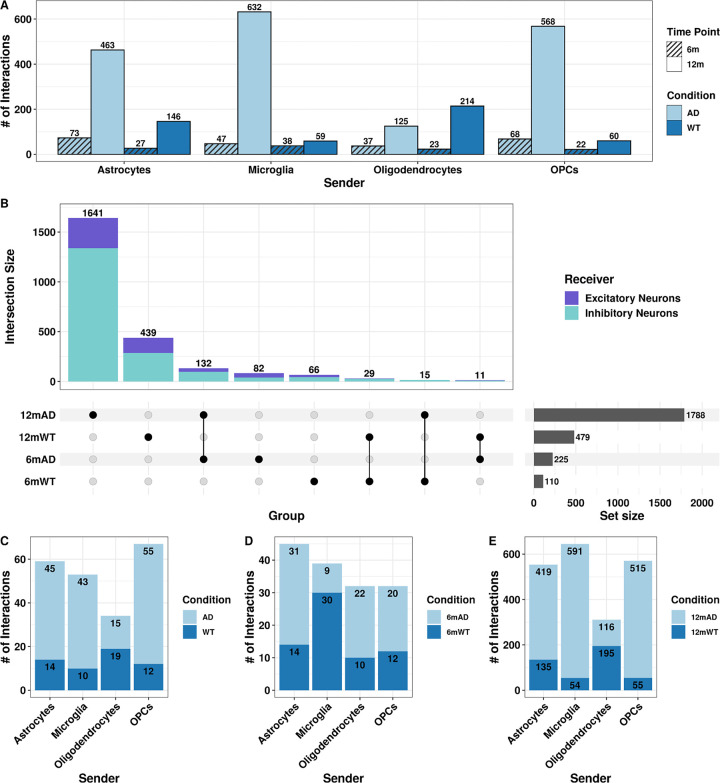
Alzheimer's disease (AD) is the most common form of dementia and is characterized by progressive memory loss and cognitive decline, affecting behavior, speech, and motor abilities. The neuropathology of AD includes the formation of extracellular amyloid-β plaque and intracellular neurofibrillary tangles of phosphorylated tau, along with neuronal loss. While neuronal loss is an AD hallmark, cell-cell communication between neuronal and non-neuronal cell populations maintains neuronal health and brain homeostasis. To study changes in cellcell communication during disease progression, we performed snRNA-sequencing of the hippocampus from female 3xTg-AD and wild-type littermates at 6 and 12 months. We inferred differential cell-cell communication between 3xTg-AD and wild-type mice across time points and between senders (astrocytes, microglia, oligodendrocytes, and OPCs) and receivers (excitatory and inhibitory neurons) of interest. We also assessed the downstream effects of altered glia-neuron communication using pseudobulk differential gene expression, functional enrichment, and gene regulatory analyses. We found that glia-neuron communication is increasingly dysregulated in 12-month 3xTg-AD mice. We also identified 23 AD-associated ligand-receptor pairs that are upregulated in the 12-month-old 3xTg-AD hippocampus. Our results suggest increased AD association of interactions originating from microglia. Signaling mediators were not significantly differentially expressed but showed altered gene regulation and TF activity. Our findings indicate that altered glia-neuron communication is increasingly dysregulated and affects the gene regulatory mechanisms in neurons of 12-month-old 3xTg-AD mice.
Keywords: Alzheimer’s disease; cell-cell communication; microglia; networks; neurodegeneration; signaling; snRNA-seq.
Conflict of interest statement
Conflict of interest disclosure: The authors declare that they do not have competing interests.
Figures


Similar articles
-
Evaluation of altered cell-cell communication between glia and neurons in the hippocampus of 3xTg-AD mice at two time points.J Cell Commun Signal. 2025 Feb 28;19(1):e70006. doi: 10.1002/ccs3.70006. eCollection 2025 Mar. J Cell Commun Signal. 2025. PMID: 40026671 Free PMC article.
-
Altered glia-neuron communication in Alzheimer's Disease affects WNT, p53, and NFkB Signaling determined by snRNA-seq.Cell Commun Signal. 2024 Jun 7;22(1):317. doi: 10.1186/s12964-024-01686-8. Cell Commun Signal. 2024. PMID: 38849813 Free PMC article.
-
Altered Glia-Neuron Communication in Alzheimer's Disease Affects WNT, p53, and NFkB Signaling Determined by snRNA-seq.bioRxiv [Preprint]. 2024 May 10:2023.11.29.569304. doi: 10.1101/2023.11.29.569304. bioRxiv. 2024. Update in: Cell Commun Signal. 2024 Jun 7;22(1):317. doi: 10.1186/s12964-024-01686-8. PMID: 38076822 Free PMC article. Updated. Preprint.
-
Plasma and cerebrospinal fluid amyloid beta for the diagnosis of Alzheimer's disease dementia and other dementias in people with mild cognitive impairment (MCI).Cochrane Database Syst Rev. 2014 Jun 10;2014(6):CD008782. doi: 10.1002/14651858.CD008782.pub4. Cochrane Database Syst Rev. 2014. PMID: 24913723 Free PMC article.
-
The Black Book of Psychotropic Dosing and Monitoring.Psychopharmacol Bull. 2024 Jul 8;54(3):8-59. Psychopharmacol Bull. 2024. PMID: 38993656 Free PMC article. Review.
References
-
- Causes and Risk Factors for Alzheimer’s Disease. Alzheimer’s Disease and Dementia https://alz.org/alzheimers-dementia/what-is-alzheimers/causes-and-risk-f....
-
- World Health Organization: Dementia. https://www.who.int/news-room/fact-sheets/detail/dementia#:~:text=Alzhei....
-
- Barker W. W. et al. Relative Frequencies of Alzheimer Disease, Lewy Body, Vascular and Frontotemporal Dementia, and Hippocampal Sclerosis in the State of Florida Brain Bank. Alzheimer Dis. Assoc. Disord. 16, 203 (2002). - PubMed
-
- Dementia statistics. https://www.alzint.org/about/dementia-facts-figures/dementia-statistics/.
Publication types
Grants and funding
LinkOut - more resources
Full Text Sources
Molecular Biology Databases
Miscellaneous