[Preprint]. 2024 May 23:rs.3.rs-4402499.
doi: 10.21203/rs.3.rs-4402499/v1.

Unraveling the Variability of Human Satiation: Implications for Precision Obesity Management

Affiliations

Unraveling the Variability of Human Satiation: Implications for Precision Obesity Management

Andres Acosta et al. Res Sq. .

Update in

Abstract

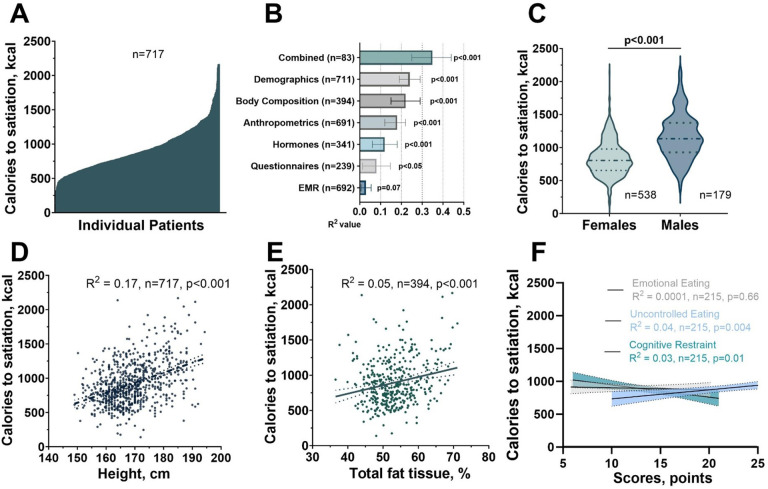
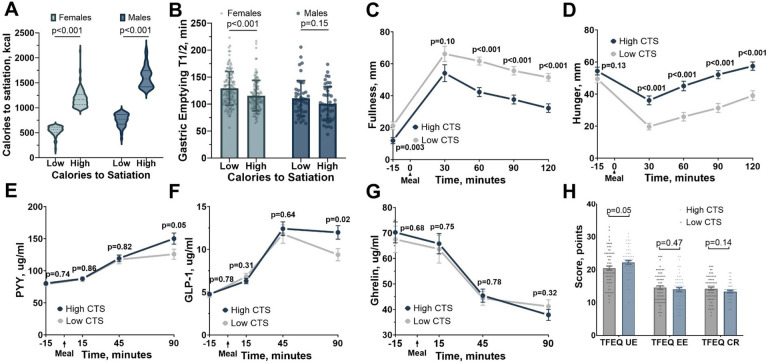
Satiation is the physiologic process that regulates meal size and termination, and it is quantified by the calories consumed to reach satiation. Given its role in energy intake, changes in satiation contribute to obesity's pathogenesis. Our study employed a protocolized approach to study the components of food intake regulation including a standardized breakfast, a gastric emptying study, appetite sensation testing, and a satiation measurement by an ad libitummeal test. These studies revealed that satiation is highly variable among individuals, and while baseline characteristics, anthropometrics, body composition and hormones, contribute to this variability, these factors do not fully account for it. To address this gap, we explored the role of a germline polygenic risk score, which demonstrated a robust association with satiation. Furthermore, we developed a machine-learning-assisted gene risk score to predict satiation and leveraged this prediction to anticipate responses to anti-obesity medications. Our findings underscore the significance of satiation, its inherent variability, and the potential of a genetic risk score to forecast it, ultimately allowing us to predict responses to different anti-obesity interventions.


Figures

Figure 1
Figure 1. Experimental design.
A) Data collection by deep-phenotype testing done in 717 participants. Illustrates the testing day starting at 7 a.m., including resting energy expenditure assessment, blood sampling, radio-labeled breakfast, gastric emptying scans, body composition by DEXA imaging, ad libitum meal test, and behavioral questionnaires. B) Feature extraction for satiation characterization. Shows male (n=179) and female (n=538) satiation distribution by calories to satiation, highlighting factors like hormones and genetics. C) Model training and Validation for Gene Risk Score Development. Demonstrates the creation and validation of a polygenic risk score (PRS) and machine-learning optimized gene risk score for satiation. D) Model extrapolation for Prediction of Response to anti-obesity medications. Depicts the model’s effectiveness in predicting response to obesity interventions using outcomes in a 52-week randomized, placebo-controlled trial of phentermine-topiramate ER (n=50) and a 16-week randomized, placebo-controlled trial of liraglutide (n=110) by categorizing participants according to CTS by ad libitum meal or by genotype groups.
Figure 2
Figure 2. Comprehensive Analysis of Satiation Variability and Influencing Factors.
A) Inter-Individual Variability in Satiation. This figure illustrates the distribution of satiation responses among 717 participants, highlighting the wide range of caloric intake to satiation. B) Proportional variance explained (R2) for satiation variability attributed to individual input variables, obtained from separate non-hierarchical regression models. Error bars represent the 95% confidence interval. R2 values were calculated through multivariable linear regression. C) Sex-Related Effects on Satiation Parameters. This violin plot showcases the distinct impact of sex on satiation parameters, revealing higher calories to satiation in males (p<0.001). D) Anthropometric Influence on Satiation. Univariate linear regression analyses display the weak correlation between calories to satiation and height in 717 participants. E) Body Composition Influence on Satiation. Univariate linear regression analyses display the weak correlation between calories to satiation and total fat percent in 395 participants that completed a DEXA scan. F) Questionnaire-Based Satiation Patterns. Demonstrates the limited contribution of behavioral questionnaires to explain the variability of objective measurements of satiation as demonstrated by the weak correlation between calories to satiation and scores in the components of the three-factor eating questionnaire: uncontrolled eating, cognitive restrain, and emotional eating completed in 215 participants.
Figure 3
Figure 3. Multifaceted Insights into High and Low Calories to Satiation Phenotypes
A) Comparative Analysis of High and Low Satiation Groups by Sex. This figure illustrates the comprehensive distinction between high and low calories to satiation, further categorized as high calories to satiation (n=179) with >977 kcal for females (n=134) and >1374 kcal for males (n=45), and low calories to satiation (n=161) with <650 kcal for females (n=134) and <927 kcal for males (n=44). B) Gastric Emptying Time by Gender in High and Low Calories to Satiation with significant differences in solid gastric emptying half-time in females (p<0.001) but not in males (p=0.15). C) Fullness by visual analog scale (VAS) after consuming a 320-kcal breakfast – High Calories to Satiation (n=70) vs. Low Calories to Satiation (n=79). D) Hunger Levels After a 320-kcal Breakfast - High Calories to Satiation (n=70) vs. Low Calories to Satiation (n=79). E) Profile of Gastrointestinal Hormones Fasting and Postprandial in High and Low Calories to Satiation: Profile of Peptide YY (PYY) Levels in High (n=83) and Low Satiation (n=59) showing not significant difference between groups at any time point. F) Profile of GLP-1 Levels in High (n=123) and Low Calories to Satiation (n=101) showing only significant differences between groups at 90 minutes. G) Profile of Ghrelin Levels in High (n=85) and Low Calories to Satiation (n=58) showing not significant difference between groups at any time point. H) Distribution of Eating Behavior Scores in the three-factor eating questionnaire (n=215) (cognitive restraint, uncontrolled eating, emotional eating) between High and Low Calories to Satiation.
Figure 4
Figure 4. Development and Validation of a Machine Learning Assisted Gene Risk Score for High Calories to Satiation in People with Obesity
A) Risk allele distribution for satiation. The number of risk alleles associated with higher calories to satiation was normally distributed in our population. Each circle represents the mean number of calories to satiation during the ad libitum meal test for each risk allele score. The solid line represents the linear regression for the risk allele score and calories to satiation (R2 = 0.55; β coefficient, 6.78; 95% CI, 5.46 to 8.11). B) Receiver Operating Characteristics curve for the Machine Learning Assisted Gene Risk Score in the training (n=483), validation (n=50), and independent validation cohort (n=110). C) Caloric intake in males and females according to their Machine Learning Assisted Gene Risk Score (CTSGRS) groups. Participants predicted as low CTSGRS had a lower caloric intake than participants predicted as high CTSGRS. D-G) There were no differences in body mass index, or other parameters associated with postprandial satiety such as fasting gastric volume or post-prandial gastric volume when dividing participants according to their CTSGRS group.
Figure 5
Figure 5. Weight loss response by baseline ad libitum meal energy intake and machine-learning assisted gene risk score prediction in response to placebo vs phentermine-topiramate ER and placebo vs liraglutide.
A) Weight loss in all participants of a 52-week randomized clinical trial with placebo and phentermine-topiramate ER and underwent satiation testing at baseline. B) Weight loss by sex-stratified satiation by calories to satiation in the ad libitum meal in participants assigned to placebo and phentermine-topiramate ER, where participants assigned to phentermine and high calories to satiation by ad libitum meal had the greatest total body weight loss percentage. C) Weight loss by sex-stratified satiation by the machine-learning assisted gene risk score (CTSGRS) classified as low or high in participants assigned to placebo and phentermine-topiramate ER, where participants assigned to phentermine-topiramate ER and high CTSGRS had the greatest total body weight lost percentage. D) Weight loss in all participants of a 16-week randomized clinical trial of liraglutide vs placebo and underwent satiation testing at baseline. E) Weight loss by sex-stratified satiation by ad libitum meal in participants assigned to liraglutide vs placebo, where participants assigned to liraglutide and low calories to satiation by ad libitum meal had the greatest total body weight loss percentage. F) Weight loss by sex-stratified satiation by machine-learning assisted gene risk score (CTSGRS) in participants assigned to liraglutide vs placebo, where participants assigned to liraglutide and low calories to satiation by CTSGRS had the greatest total body weight lost percentage.

Similar articles

  • Genetic and physiological insights into satiation variability predict responses to obesity treatment.
    Cifuentes L, Anazco D, O'Connor T, Hurtado MD, Ghusn W, Campos A, Fansa S, McRae A, Madhusudhan S, Kolkin E, Ryks M, Harmsen WS, Ciotlos S, Abu Dayyeh BK, Hensrud DD, Camilleri M, Acosta A. Cifuentes L, et al. Cell Metab. 2025 Aug 5;37(8):1655-1666.e5. doi: 10.1016/j.cmet.2025.05.008. Epub 2025 Jun 6. Cell Metab. 2025. PMID: 40482646 Clinical Trial.
  • The Black Book of Psychotropic Dosing and Monitoring.
    DeBattista C, Schatzberg AF. DeBattista C, et al. Psychopharmacol Bull. 2024 Jul 8;54(3):8-59. Psychopharmacol Bull. 2024. PMID: 38993656 Free PMC article. Review.
  • Nutritional labelling for healthier food or non-alcoholic drink purchasing and consumption.
    Crockett RA, King SE, Marteau TM, Prevost AT, Bignardi G, Roberts NW, Stubbs B, Hollands GJ, Jebb SA. Crockett RA, et al. Cochrane Database Syst Rev. 2018 Feb 27;2(2):CD009315. doi: 10.1002/14651858.CD009315.pub2. Cochrane Database Syst Rev. 2018. PMID: 29482264 Free PMC article.
  • Systemic Inflammatory Response Syndrome.
    Baddam S, Burns B. Baddam S, et al. 2025 Jun 20. In: StatPearls [Internet]. Treasure Island (FL): StatPearls Publishing; 2025 Jan–. 2025 Jun 20. In: StatPearls [Internet]. Treasure Island (FL): StatPearls Publishing; 2025 Jan–. PMID: 31613449 Free Books & Documents.
  • Short-Term Memory Impairment.
    Cascella M, Al Khalili Y. Cascella M, et al. 2024 Jun 8. In: StatPearls [Internet]. Treasure Island (FL): StatPearls Publishing; 2025 Jan–. 2024 Jun 8. In: StatPearls [Internet]. Treasure Island (FL): StatPearls Publishing; 2025 Jan–. PMID: 31424720 Free Books & Documents.

References

    1. World Obesity. Economic impact of overweight and obesity to surpass $4 trillion by 2035, <https://www.worldobesity.org/news/economic-impact-of-overweight-and-obes...> (2023).
    1. Rubino F. et al. Lancet Diabetes & Endocrinology Commission on the Definition and Diagnosis of Clinical Obesity. The Lancet Diabetes & Endocrinology 11, 226–228 (2023). - PubMed
    1. Acosta A. et al. Selection of Antiobesity Medications Based on Phenotypes Enhances Weight Loss: A Pragmatic Trial in an Obesity Clinic. Obesity (Silver Spring) 29, 662–671 (2021). 10.1002/oby.23120 - DOI - PMC - PubMed
    1. Acosta A. et al. Quantitative gastrointestinal and psychological traits associated with obesity and response to weight-loss therapy. Gastroenterology 148, 537–546.e534 (2015). 10.1053/j.gastro.2014.11.020 - DOI - PMC - PubMed
    1. Halawi H. et al. Effects of liraglutide on weight, satiation, and gastric functions in obesity: a randomised, placebo-controlled pilot trial. Lancet Gastroenterol Hepatol 2, 890–899 (2017). 10.1016/s2468-1253(17)30285-6 - DOI - PubMed

Publication types

LinkOut - more resources