[Preprint]. 2024 Dec 5:2024.05.24.595756.
doi: 10.1101/2024.05.24.595756.

Merging Metabolic Modeling and Imaging for Screening Therapeutic Targets in Colorectal Cancer

Affiliations

Merging Metabolic Modeling and Imaging for Screening Therapeutic Targets in Colorectal Cancer

Niki Tavakoli et al. bioRxiv. .

Update in

Abstract

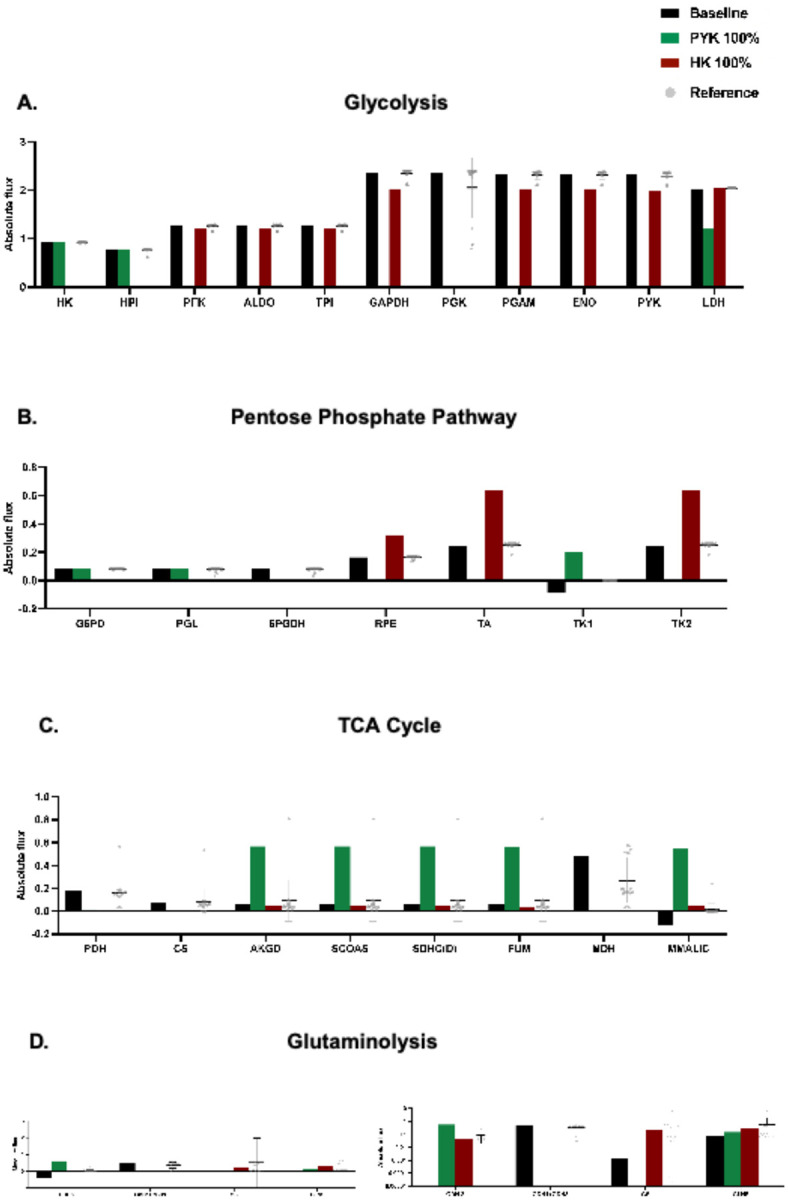
Cancer-associated fibroblasts (CAFs) play a key role in metabolic reprogramming and are well-established contributors to drug resistance in colorectal cancer (CRC). To exploit this metabolic crosstalk, we integrated a systems biology approach that identified key metabolic targets in a data-driven method and validated them experimentally. This process involved a novel machine learning-based method to computationally screen, in a high-throughput manner, the effects of enzyme perturbations predicted by a computational model of CRC metabolism. This approach reveals the network-wide effects of metabolic perturbations. Our results highlighted hexokinase (HK) as a crucial target, which subsequently became our focus for experimental validation using patient-derived tumor organoids (PDTOs). Through metabolic imaging and viability assays, we found that PDTOs cultured in CAF-conditioned media exhibited increased sensitivity to HK inhibition, confirming the model predictions. Our approach emphasizes the critical role of integrating computational and experimental techniques in exploring and exploiting CRC-CAF crosstalk.

Keywords: cancer associated fibroblast; colorectal cancer; fluorescence lifetime imaging microscopy; metabolic modeling; tumor microenvironment.


Conflict of interest statement

Declaration of interests The authors declare no conflict of interest.

Figures

Figure 1:
Figure 1:. Project pipeline.
(A) Computational portion of the study. Left: for each culture condition, metabolic reactions were subjected to knockdowns from zero (baseline) to 100% (full knockout) in increments of 20%. Middle: we applied a representation learning approach to reduce the dimensionality of our generated data, which enabled identification of enzyme perturbations that strongly impact the metabolic network. Right: to explore their effects, these flux changes were compared against baseline conditions (no knockdown), as well as against non-significant perturbations across the same and distinct cell conditions. (B) Experimental validation of in silico results through measurement of metabolic signatures (e.g. FLIM; left) and drug response assays (right). We returned to the computational model to generate additional calculations to compare to the experimentally observed metabolic imaging and drug responses, symbolizing the bidirectional arrows between panels A and B.
Figure 2:
Figure 2:. Heatmap displaying the impact of complete (100%) enzyme knockouts on absolute reaction fluxes.
(A) KRASCAF condition and (B) KRASCRC condition. Rows represent individual enzyme knockdowns, while columns depict the effects of each perturbation on the rest of the network (predicted enzyme response). The color axis illustrates the absolute flux of enzymes after each perturbation, with color intensity indicating flux values from 0 to 2 hr−1, which covers the majority of the flux data. To enhance readability, any values exceeding 2 hr−1 have been masked as black. Outlined boxes highlight effects within individual pathways of central carbon metabolism, making it easier to visualize intra-pathway adjustments due to each knockdown.
Figure 3:
Figure 3:. Dimensionality reduction and data analysis.
(A) Predicted reaction fluxes due to metabolic perturbations projected in 2D space. (B-C) Distributions of distances between each simulation point in 2D space to its cluster centroid for KRASCAF and KRASCRC respectively. The dotted red lines represent the distance separating the top 5th percentile of distances furthest from the centroid. (D) Influential metabolic perturbations identified for KRASCAF and KRASCRC, according to central carbon metabolism pathways. (E) Labeling of simulated perturbations and identification of significant reactions in KRASCAF 2D projected space.
Figure 4:
Figure 4:. Comparative analysis of the impact of significant perturbations on metabolic pathways for the KRASCAF condition.
Bar plots depicting the fluxes for baseline (no perturbation), PYK 100% knockdown (green), HK 100% knockdown (maroon), and reference (bottom 5th percentile of reactions furthest from the centroid; gray points) for reactions in (A) glycolysis, (B) PPP, (C) TCA cycle, and (D) glutaminolysis.
Figure 5:
Figure 5:. Hexokinase activity in PDTOs treated with 3-BP inhibitor.
KRASMUT PDTOs (000US) treated with 3-BP for 24 hours in CRC media and CAF-CM to measure inhibition of HK activity. Percentage of HK activity is normalized to the respective untreated conditions (CRC or CAF-CM media). ****p<0.001
Figure 6:
Figure 6:. HK inhibition alters metabolic activity and cell viability in CAF-conditioned PDTOs.
(A) Representative FLIM images and DRAQ7 staining of KRASMUT PDTOs (000US) in control CRC media or patient-matched CAF-CM after 72 hours of 3-BP treatment. Images are of a single z-slice; scale bar is 20 μm. (B) Quantified metabolic signature values comparing PDTOs in CRC media and CAF-CM conditions with 3-BP treatment. For CAF-CM conditions n = 2–3 (2 for 0uM and 3 for 25–100uM). For CRC conditions: n= 4. ***p<0.001(C) Model-predicted metabolic signature values comparing cells in CRC media and CAF-CM with HK knockdown on a log10 scale. The annotations on the figure indicate the fold-changes, relative to the baseline (untreated) case. (D) Calculated IC50 values from dose response curves of PDTOs treated with 3-BP in CRC media or CAF-CM. *p<0.05 (E) Model-predicted biomass flux for full knockdown of HK in CRC media and CAF-CM normalized to baseline (no model perturbation).
Figure 7:
Figure 7:. Dimensionality Reduction Pipeline.
(A) Our simulations resulted in 20 input matrices representing 5 levels of partial to full enzyme inhibition across 4 distinct cell culture conditions. (B): Each row of these matrices was input to a neural network, which iteratively learned the similarity and dissimilarity among data points, projecting them into a 2D space. (C): Through multiple simulation iterations, the algorithm refined point placement to enhance clustering of similar data points, with the distance between points indicating the level of similarity.

Similar articles

References

    1. Luengo A., Gui D.Y., and Vander Heiden M.G. (2017). Targeting Metabolism for Cancer Therapy. Cell Chem. Biol. 24, 1161–1180. 10.1016/j.chembiol.2017.08.028. - DOI - PMC - PubMed
    1. Hanahan D. (2022). Hallmarks of Cancer: New Dimensions. Cancer Discov. 12, 31–46. 10.1158/2159-8290.CD-21-1059. - DOI - PubMed
    1. Pavlova N.N., Zhu J., and Thompson C.B. (2022). The hallmarks of cancer metabolism: Still emerging. Cell Metab. 34, 355–377. 10.1016/j.cmet.2022.01.007. - DOI - PMC - PubMed
    1. Karta J., Bossicard Y., Kotzamanis K., Dolznig H., and Letellier E. (2021). Mapping the Metabolic Networks of Tumor Cells and Cancer-Associated Fibroblasts. Cells 10, 1–25. 10.3390/CELLS10020304. - DOI - PMC - PubMed
    1. Patel B.B., Ackerstaff E., Serganova I.S., Kerrigan J.E., Blasberg R.G., Koutcher J.A., and Banerjee D. (2017). Tumor stroma interaction is mediated by monocarboxylate metabolism. Exp. Cell Res. 352, 20–33. 10.1016/J.YEXCR.2017.01.013. - DOI - PMC - PubMed

Publication types