[Preprint]. 2024 May 21:2024.05.21.595064.
doi: 10.1101/2024.05.21.595064.

Inducible transposon mutagenesis for genome-scale forward genetics

Affiliations

Inducible transposon mutagenesis for genome-scale forward genetics

David W Basta et al. bioRxiv. .

Update in

Abstract

Transposon insertion sequencing (Tn-seq) is a powerful method for genome-scale functional genetics in bacteria. However, its effectiveness is often limited by a lack of mutant diversity, caused by either inefficient transposon delivery or stochastic loss of mutants due to population bottlenecks. Here, we introduce "InducTn-seq", which leverages inducible mutagenesis for temporal control of transposition. InducTn-seq generates millions of transposon mutants from a single colony, enabling the sensitive detection of subtle fitness defects and transforming binary classifications of gene essentiality into a quantitative fitness measurement across both essential and non-essential genes. Using a mouse model of infectious colitis, we show that InducTn-seq bypasses a highly restrictive host bottleneck to generate a diverse transposon mutant population from the few cells that initiate infection, revealing the role of oxygen-related metabolic plasticity in pathogenesis. Overall, InducTn-seq overcomes the limitations of traditional Tn-seq, unlocking new possibilities for genome-scale forward genetic screens in bacteria.


Conflict of interest statement

Competing interests The authors declare no competing interests.

Figures

Fig. 1 |
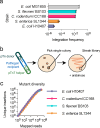
Fig. 1 |. InducTn-seq enables genome-scale forward genetics through inducible mutagenesis.
a, Traditional Tn-seq is often limited by the inefficient delivery of a transposon donor, which impedes the generation of a diverse mutant library. By contrast, InducTn-seq allows for the expansion of a single initial transconjugant (depicted as a gray colony) to generate a diverse mutant library. b, During animal colonization experiments, an initial host bottleneck leads to the random elimination of mutant cells, thereby reducing the diversity of the mutant library. With InducTn-seq, new transposon mutants can be generated within the animal after bypassing the initial bottleneck.
Fig. 2 |
Fig. 2 |. Design of an inducible mutagenesis system.
a, Diagram of the inducible transposon mutagenesis plasmid, pTn donor. The plasmid backbone contains a carbenicillin-selectable marker (carbR), a conditional origin of replication (R6k), and an origin of transfer (oriT). The Tn7 transposon (green brackets) contains a Tn5 transposase regulated by the arabinose-responsive PBAD promoter (cyan), a Tn5 transposon with a kanamycin-selectable marker (kanR, purple), and a transcriptionally silenced gentamicin-selectable marker (gentR, gray). The Tn5 transposase and transposon form the Tn5 transposition complex, which is flanked by Cre-recognized lox sequences. Cre excision of the complex enables the measurement of the population-level transposition frequency (see Extended Data Fig. 2 for details). Following integration of the Tn7 transposon at the attTn7 site (green arrow), arabinose-mediated induction of the Tn5 transposase results in random Tn5 transposition out of the attTn7 site (purple arrow). b, The frequency of Tn5 transposition out of the Tn7 site after growth in the presence or absence of arabinose, expressed as the ratio of kanR+gentR CFU to gentR CFU (see Extended Data Fig. 2 for details). The columns represent means, the error bars represent standard deviation, and the points represent replicates. c, The number of unique Tn5 insertion sites in a population of ~103 E. coli MG1655 colonies after growth with or without arabinose (induced or uninduced, respectively). 100 ng of template DNA was used for amplification of each sequencing library. d, Histogram displaying the number of Tn5 transposons inserted into the genome of ten colonies that underwent at least one Tn5 transposition event after arabinose induction. The genomic coordinates of the Tn5 transposons in each colony are provided in Supplementary Table 2.
Fig. 3 |
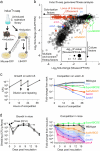
Fig. 3 |. Sensitive measurement of mutant fitness in both essential and non-essential genes.
a, Induced cells (ON) contain Tn5 insertions in genes classified as essential in the closely related E. coli strain BW25113 (genes depicted in red, e.g., obgE). Insertions in essential genes are selectively depleted when the population is expanded in the absence of induction (a), and progressively decrease with more generations of growth (b). In b, the ON population was serially diluted in LB without induction, ensuring logarithmic growth of the population over 17 generations. Individual lines in panel b correspond to the genes displayed in panel a. See Supplementary Table 3 for a complete list of all genes. c, Volcano plot comparing the fold change in the insertion frequency between OFF and ON. A significant fitness defect was defined as a Mann Whitney U P value <0.01 and log2 fold change <−1 relative to the frequency of insertions in the ON population. Genes previously classified as essential are marked as red points.
Fig. 4 |
Fig. 4 |. InducTn-seq creates high-density mutant libraries from a single bacterium.
a, The indicated enteric pathogens underwent conjugation with pTn donor and pTn7 helper. The integration frequency is expressed as the ratio of kanR CFU to total CFU. The bars represent means and the error bars represent standard deviation. n = 2 for each strain. b, A single, uninduced transconjugant colony of each strain was streaked onto a plate containing 0.2% arabinose. c, The number of unique Tn5 insertion sites detected by sequencing of the streaked libraries expanded from the single colony.
Fig. 5 |
Fig. 5 |. InducTn-seq bypasses the host bottleneck.
a, Female C57BL/6J mice were intragastrically inoculated with either a pool of ~3×10⁵ unique C. rodentium Tn5 insertion mutants (Traditional Tn-seq) or uninduced Tn5 transposition complex integrants (InducTn-seq), and colonization was monitored by serial dilution and plating of feces. For InducTn-seq, Tn5 transposition was induced on day 3 to 8 by providing ad libitum access to water containing 5% arabinose. n = 3 mice in each group. b, Samples from day 5 (Traditional Tn-seq) or day 8 (InducTn-seq) post-inoculation were sequenced to determine the number of unique mutants recovered from each animal. n = 3 mice in each group. c, Correlation of mutant frequency between animal replicates. Points represent genes, insertion frequency is calculated as reads per gene normalized to total reads in the sample, and histograms on the axes display the distribution of the data. d, The coefficient of determination (R2) comparing the log10 transformed insertion frequencies across replicates.
Fig. 6 |
Fig. 6 |. InducTn-seq reveals the role of oxygen-related metabolism during enteric infection.
a, Experimental scheme. Mutant populations isolated from the mouse (mouse-OFF) or following in vitro outgrowth in the absence of induction (LB-OFF) were each compared to the induced population generated in vitro (LB-ON). b, Fold change in the insertion frequency during infection (mouse-OFF) or during culture (LB-OFF) relative to induction (LB-ON), as schematized in a. Points represent genes and significance represents a Mann-Whitney U test comparing mouse-OFF to LB-ON. c-d, To validate the InducTn-seq results, barcoded strains with the indicated in-frame deletions were expanded separately and then pooled and either passaged on LB agar plates (c) or intragastrically administered to female C57BL/6J mice (d). The size of the bacterial population was determined by serial dilution and plating, while the relative abundance of each strain was measured by amplicon sequencing. Lines represent geometric means and error bars represent standard deviations of three barcoded strains per deletion competed in a single culture (c) or four barcoded strains per deletion competed in four mice (d). ND = barcode not detected.

References

    1. Van Opijnen T., Bodi K. L. & Camilli A. Tn-seq: high-throughput parallel sequencing for fitness and genetic interaction studies in microorganisms. Nat Methods 6, 767–772 (2009). - PMC - PubMed
    1. Goodman A. L. et al. Identifying genetic determinants needed to establish a human gut symbiont in its habitat. Cell Host Microbe 6, 279–289 (2009). - PMC - PubMed
    1. Langridge G. C. et al. Simultaneous assay of every Salmonella Typhi gene using one million transposon mutants. Genome Res 19, 2308–2316 (2009). - PMC - PubMed
    1. Gawronski J. D., Wong S. M. S., Giannoukos G., Ward D. V. & Akerley B. J. Tracking insertion mutants within libraries by deep sequencing and a genome-wide screen for Haemophilus genes required in the lung. Proceedings of the National Academy of Sciences 106, 16422–16427 (2009). - PMC - PubMed
    1. Chao M. C., Abel S., Davis B. M. & Waldor M. K. The design and analysis of transposon insertion sequencing experiments. Nat Rev Microbiol 14, 119–128 (2016). - PMC - PubMed

Publication types