[Preprint]. 2024 May 21:2024.05.20.594873.
doi: 10.1101/2024.05.20.594873.

Control of Physiologic Glucose Homeostasis via the Hypothalamic Modulation of Gluconeogenic Substrate Availability

Affiliations

Control of Physiologic Glucose Homeostasis via the Hypothalamic Modulation of Gluconeogenic Substrate Availability

Abdullah Hashsham et al. bioRxiv. .

Update in

Abstract

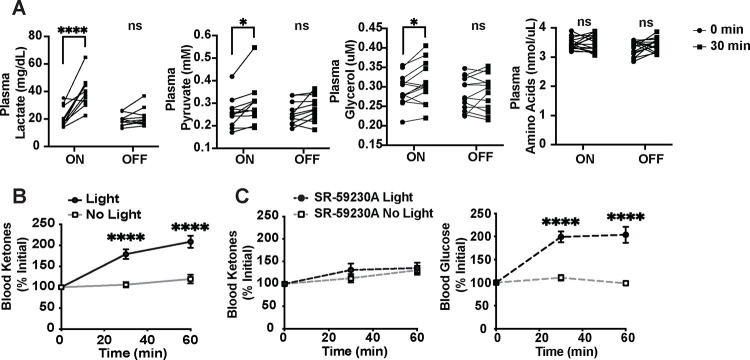
The brain augments glucose production during fasting, but the mechanisms are poorly understood. Here, we show that Cckbr-expressing neurons in the ventromedial hypothalamic nucleus (VMNCckbr cells) prevent low blood glucose during fasting through sympathetic nervous system (SNS)-mediated augmentation of adipose tissue lipolysis and substrate release. Activating VMNCckbr neurons mobilized gluconeogenic substrates without altering glycogenolysis or gluconeogenic enzyme expression. Silencing these cells (CckbrTetTox animals) reduced fasting blood glucose, impaired lipolysis, and decreased circulating glycerol (but not other gluconeogenic substrates) despite normal insulin, counterregulatory hormones, liver glycogen, and liver gluconeogenic gene expression. Furthermore, β3-adrenergic adipose tissue stimulation in CckbrTetTox animals restored lipolysis and blood glucose. Hence, VMNCckbr neurons impact blood glucose not by controlling islet or liver physiology, but rather by mobilizing gluconeogenic substrates. These findings establish a central role for hypothalamic and SNS signaling during normal glucose homeostasis and highlight the importance of gluconeogenic substrate mobilization during physiologic fasting.


Conflict of interest statement

Conflict of Interests Statement: MGM receives research support from AstraZeneca, Eli Lilly, and Novo Nordisk. OAM has received grant support from Regeneron Pharmaceuticals, Inc., CombiGene AB, and Rejuvenate Bio. The authors declare that they have no other conflicts of interest.

Figures

Figure 1:
Figure 1:. Activating VMNCckbr neurons mobilizes glucose without altering glycogen or gluconeogenic gene expression.
CckbrCre mice were injected with AAV-DIO-ChR2-eYFP unliterally into the VMN followed by optogenetic fiber placement to permit optogenetic activation of VMNCckbr neurons. Mice were fasted for 2 hours during the early light cycle prior to testing. Shown is (A) the glycemic response to light or no light control stimulation (n = 19) and (B) liver glycogen content from tissue collected after 30 minutes of light or control stimulation (n = 5 no light, 8 light). (C) A separate cohort of mice were treated with CP91,149, a glycogenolysis inhibitor, or vehicle at the start of the fasting period and glucose was measured before and 30 minutes after optogenetic stimulation (n = 5); the right-hand panel shows the percent change for light-stimulated vs no light conditions for each treatment. (D) mRNA expression of hepatic gluconeogenic genes was quantified following 30 minutes control or light delivery (n = 6 light off, 8 light on). Data are plotted as mean SEM. *p< 0.05, **p< 0.01, ****p<0.0001, by paired Student’s t-test (A, C) and unpaired Student’s t-test (B, C(t=0 comparison), D).
Figure 2:
Figure 2:. VMNCckbr neuron activation mobilizes gluconeogenic substrates and ketones.
Plasma concentration of gluconeogenic substrates were measured following 30 minutes optogenetic stimulation of VMNCckbr neurons and with no light control. Shown are concentrations of (A) plasma lactate, pyruvate, glycerol and amino acids (n = 10–15) and (B) and blood ketones (n = 9). (C-D) Blood ketone and glucose concentrations were measured at 30 minutes intervals during light stimulation in mice pre-treated with β3-adrenergic receptor antagonist SR-59230A or vehicle (n = 9). Data are plotted as individuals (A) or mean +/− SEM (B-D) and analyzed by paired Student’s t-test. *p< 0.05, ****p<0.0001.
Figure 3:
Figure 3:. Silencing VMNCckbr neurons decreases glucose during physiologic fasting without altering pancreatic hormones, glycogen, or gluconeogenic gene expression.
We injected CckbrCre mice with AAV-DIO-TetTox-EGFP bilaterally into the VMN (n = 11) or AAV-DIO-GFP as a control (n = 10). (A) Blood glucose over a 24 hour period was monitored via continuous glucose monitoring in a subset of mice (n = 4 CckbrTetTox and 5 control)(ZT = Zeitgeber Time, TT = Tetanus Toxin). Following a 4 hour fast we measured (B) plasma hormones, (C) hepatic gluconeogenic gene expression, and (D) liver glycogen content. (E) Mice were injected with glucagon following a 4 hour fast and blood glucose was measured (n = 15 CckbrTetTox and 10 control). Data are plotted as mean +/− SEM, analyzed by unpaired Student’s t-test. Differences in blood glucose by CGM was analyzed in 4-hr circadian windows by 2-way ANOVA. *p<0.05
Figure 4:
Figure 4:. Silencing VMNCckbr neurons impairs glycerol mobilization and lipolysis.
(A) Gluconeogenic substrates were measured following a 4 hour fast in CcbkrTetTox (n = 7) and GFP control mice (n = 5). (B) Plasma NEFA concentration was measured following a 4 hour fast. (C) Animals underwent a glycerol appearance assay with infusion of [3H]-labelled glycerol and glycerol appearance rate was calculated. CcbkrTetTox and control mice were injected with (D) pyruvate (2g/kg) or (E) glycerol (2 g/kg) following a 4-hour fast and blood glucose was measured at the indicated times. Data are plotted as mean +/− SEM. *p < 0.05, ***p < 0.001, by unpaired Student’s t-test.
Figure 5:
Figure 5:. Restoring sympathetic signaling ameliorates impaired lipolysis and glucose mobilization during physiologic fasting in CckbrTetTox mice.
(A) Glycerol, (B) glycerol appearance rate, and (C-D) blood glucose were measured in CckbrTetTox and control mice following a 4 hour fast at 0 and 10 minutes after β3-agonist CL316,243 i.v. infusion (n = 5). Data are plotted as mean SEM. *p < 0.05, ***p < 0.001, analyzed by unpaired Student’s t-test.
Figure 6:
Figure 6:. Silencing VMNCckbr neurons does not decrease adipose depots.
We injected AAV-DIO-TetTox-EGFP and GFP control virus bilaterally into the VMN of CckbrCre mice. At least 8 weeks after surgery, we collected gonadal and posterior subcutaneous white adipose tissue, (gWAT and psWAT respectively). Shown are (A) gWAT and (B) psWAT adipose tissue depot mass, average adipocyte area and adipocyte area versus frequency. (n = 6 – 8). Data are plotted as mean +/− SEM.

References

    1. Röder P. V., Wu B., Liu Y. & Han W. Pancreatic regulation of glucose homeostasis. Exp. Mol. Med. 48, e219–e219 (2016). - PMC - PubMed
    1. Alonge K. M., Porte D. Jr. & Schwartz M. W. Distinct Roles for Brain and Pancreas in Basal and Postprandial Glucose Homeostasis. Diabetes 72, 547–556 (2023). - PMC - PubMed
    1. McCrimmon R. J. & Sherwin R. S. Hypoglycemia in type 1 diabetes. Diabetes 59, 2333–2339 (2010). - PMC - PubMed
    1. Stanley S., Moheet A. & Seaquist E. R. Central Mechanisms of Glucose Sensing and Counterregulation in Defense of Hypoglycemia. Endocr. Rev. 40, 768–788 (2019). - PMC - PubMed
    1. Flak J. N. et al. A leptin-regulated circuit controls glucose mobilization during noxious stimuli. J. Clin. Invest. 127, 3103–3113. - PMC - PubMed

Publication types