[Preprint]. 2024 May 22:2023.09.10.557072.
doi: 10.1101/2023.09.10.557072.

The tidyomics ecosystem: Enhancing omic data analyses

Affiliations

The tidyomics ecosystem: Enhancing omic data analyses

William J Hutchison et al. bioRxiv. .

Update in

  • The tidyomics ecosystem: enhancing omic data analyses.
    Hutchison WJ, Keyes TJ; tidyomics Consortium; Crowell HL, Serizay J, Soneson C, Davis ES, Sato N, Moses L, Tarlinton B, Nahid AA, Kosmac M, Clayssen Q, Yuan V, Mu W, Park JE, Mamede I, Ryu MH, Axisa PP, Paiz P, Poon CL, Tang M, Gottardo R, Morgan M, Lee S, Lawrence M, Hicks SC, Nolan GP, Davis KL, Papenfuss AT, Love MI, Mangiola S. Hutchison WJ, et al. Nat Methods. 2024 Jul;21(7):1166-1170. doi: 10.1038/s41592-024-02299-2. Epub 2024 Jun 14. Nat Methods. 2024. PMID: 38877315

Abstract

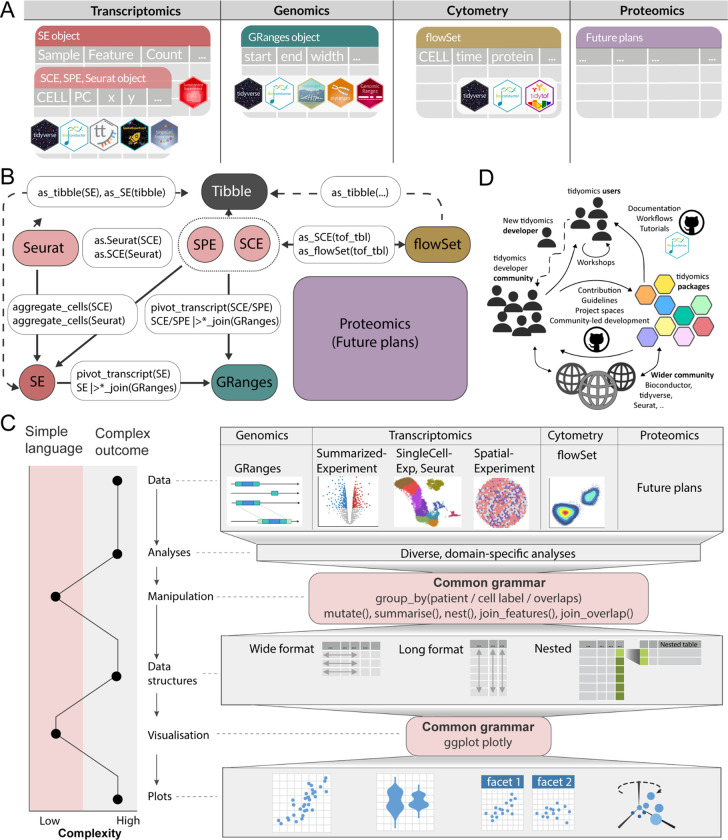
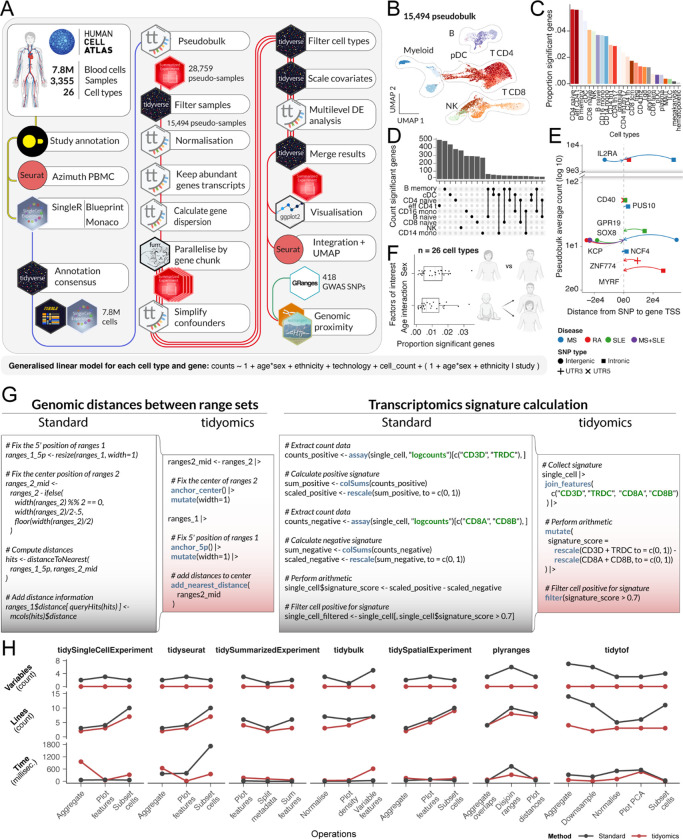
The growth of omic data presents evolving challenges in data manipulation, analysis, and integration. Addressing these challenges, Bioconductor1 provides an extensive community-driven biological data analysis platform. Meanwhile, tidy R programming2 offers a revolutionary standard for data organisation and manipulation. Here, we present the tidyomics software ecosystem, bridging Bioconductor to the tidy R paradigm. This ecosystem aims to streamline omic analysis, ease learning, and encourage cross-disciplinary collaborations. We demonstrate the effectiveness of tidyomics by analysing 7.5 million peripheral blood mononuclear cells from the Human Cell Atlas3, spanning six data frameworks and ten analysis tools.


Conflict of interest statement

Competing interest R.G. has received consulting income from Takeda and Sanofi, and declares ownership in Ozette Technologies. M.K. is an employee of and declares ownership in Achilles Therapeutics. The remaining authors declare no competing interests.

Figures

Figure 1:
Figure 1:. Overview of the tidyomics ecosystem.
A: Diagrams of data interfaces show consistent data representation for the diverse data containers. The hexagonal icons represent the compatible R packages for each data container. B: The landscape of rich data objects in R/Bioconductor, with tidyomics verbs as paths connecting these objects. The data containers are represented by rounded rectangles and functions that connect them as white boxes. SPE = SpatialExperiment, SCE = SingleCellExperiment, SE = SummarizedExperiment. C: Contrast between the simplicity of the tidy syntax/grammar and the complex outcome and input data containers (left). Example workflows include data, biological analysis, data/results manipulation and summarisation, diverse data structures, visualisation and resulting plots (right). The pink areas include the infrastructure that shares grammar across omics. D: Engagement within the tidyomics community is multifaceted, centring around a suite of R packages tailored for streamlined data analysis. This ecosystem is enhanced by comprehensive documentation, including usage guidelines and development tutorials. The community thrives on interactive learning, offering workshops created and led by its members. Collaboration, project development and guidelines are centralised in our tidyomics GitHub organisation. GitHub and Bioconductor are the primary discussion forums. Additionally, Bioconductor is a prominent repository for software packages, reinforcing the community’s connection to broader bioinformatics networks such as Bioconductor, tidyverse, and Seurat.
Figure 2:
Figure 2:. Performance of the tidyomics ecosystem.
A: tidyomics powers large-scale cross-framework analyses. We compared peripheral blood mononuclear cells between sexes at the pseudobulk level. The logos represent data and analysis frameworks. The connecting lines represent pipelines, coloured by the object type. Parallel lines represent parallel workflows. B: Pseudosample UMAP, coloured by cell type. C: Rank of cell types from the most to the least changed across sexes, coloured as per the B panel. D: Significant gene overlap across the top nine cell types for sex effect or its interaction with age. E: Overlap of sex-related genes in CD4 naive cells with GWAS SNPs for multiple sclerosis, rheumatoid arthritis, and systemic lupus erythematosus. F: Fraction of sex-related genes significant as a main effect or interaction with age. The box plot centre line represents the median value, and the lower and upper hinges represent the first and third quartiles. The lower whisker extends from the lower hinge to 1.5 times the interquartile range or the lowest value. The upper whisker extends from the upper hinge to 1.5 times the inter-quartile range or the highest value. G: Comparison of code readability between standard and tidyverse programming. Two tasks showcased are visualising a histogram of genomic distances (left) and calculating a multi-gene signature from single-cell data (right). H: The benchmark of variables, lines of code, and time efficiency of our ecosystem compared to standard (non-tidy) coding. The operations include common manipulations and analysis for each package (Methods).

References

    1. Gentleman R. C. et al. Bioconductor: open software development for computational biology and bioinformatics. Genome Biol. 5, R80 (2004). - PMC - PubMed
    1. Wickham H. et al. Welcome to the Tidyverse. Journal of Open Source Software 4, 1686 (2019).
    1. Regev A. et al. The Human Cell Atlas. Elife 6, e27041 (2017). - PMC - PubMed
    1. Tarazona S., Arzalluz-Luque A. & Conesa A. Undisclosed, unmet and neglected challenges in multi-omics studies. Nature Computational Science 1, 395–402 (2021). - PubMed
    1. Li P. Computation and Visualization of Package Download Counts and Percentiles [R package packageRank version 0.8.3]. (2023).

Methods references

    1. Rozenblatt-Rosen O. et al. Building a high-quality Human Cell Atlas. Nat. Biotechnol. 39, 149–153 (2021). - PubMed
    1. Hao Y. et al. Integrated analysis of multimodal single-cell data. Cell 184, 3573–3587.e29 (2021). - PMC - PubMed
    1. Mangiola S., Doyle M. A. & Papenfuss A. T. Interfacing Seurat with the R tidy universe. Bioinformatics 37, 4100–4107 (2021). - PMC - PubMed
    1. Aran D. et al. Reference-based analysis of lung single-cell sequencing reveals a transitional profibrotic macrophage. Nat. Immunol. 20, 163–172 (2019). - PMC - PubMed
    1. Fernández J. M. et al. The BLUEPRINT Data Analysis Portal. Cell Syst 3, 491–495.e5 (2016). - PMC - PubMed

Publication types