[Preprint]. 2024 May 23:2024.05.22.595241.
doi: 10.1101/2024.05.22.595241.

Genotype-to-phenotype mapping of somatic clonal mosaicism via single-cell co-capture of DNA mutations and mRNA transcripts

Affiliations

Genotype-to-phenotype mapping of somatic clonal mosaicism via single-cell co-capture of DNA mutations and mRNA transcripts

Dennis J Yuan et al. bioRxiv. .

Abstract

Somatic mosaicism is a hallmark of malignancy that is also pervasively observed in human physiological aging, with clonal expansions of cells harboring mutations in recurrently mutated driver genes. Bulk sequencing of tissue microdissection captures mutation frequencies, but cannot distinguish which mutations co-occur in the same clones to reconstruct clonal architectures, nor phenotypically profile clonal populations to delineate how driver mutations impact cellular behavior. To address these challenges, we developed single-cell Genotype-to-Phenotype sequencing (scG2P) for high-throughput, highly-multiplexed, single-cell joint capture of recurrently mutated genomic regions and mRNA phenotypic markers in cells or nuclei isolated from solid tissues. We applied scG2P to aged esophagus samples from five individuals with high alcohol and tobacco exposure and observed a clonal landscape dominated by a large number of clones with a single driver event, but only rare clones with two driver mutations. NOTCH1 mutants dominate the clonal landscape and are linked to stunted epithelial differentiation, while TP53 mutants and double-driver mutants promote clonal expansion through both differentiation biases and increased cell cycling. Thus, joint single-cell highly multiplexed capture of somatic mutations and mRNA transcripts enables high resolution reconstruction of clonal architecture and associated phenotypes in solid tissue somatic mosaicism.


Conflict of interest statement

Competing Interests D.A.L. serves on the Scientific Advisory Board of Mission Bio, Pangea, Alethiomics, Montage and Veracyte. D.A.L. has received prior research funding from 10x Genomics, Illumina, and Ultima Genomics unrelated to the current manuscript. D.D. and S.W. are employees of Mission Bio. D.D. is listed as an inventor on a granted patent (US patent 11365441) and a submitted patent (US patent application 16/839,057). S.W. is listed as an inventor on a submitted patent (US patent application 16/936,378) No other authors report competing interests.

Figures
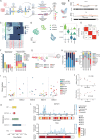
Figure 1.
Figure 1.. Targeted capture of mutation hotspots and RNA in single cells
A. Schematic representation of the scG2P workflow. Dissociated cells or nuclei undergo cell lysis and targeted reverse transcription (RT), followed by barcode addition and targeted loci amplification in two sequential encapsulations. DNA and RNA amplicons are separated by streptavidin bead capture for separate library preparation. This workflow combines DNA mutation hotspot capture to reconstruct clonal architecture with exon-exon capture of RNA targets for single-cell genotype to phenotype linkage. B. Tiling amplicon design and mutation frequency across NOTCH1 and TP53 genes. The number of mutations per codon, as previously reported from bulk sequencing of the esophagus (Yokoyama et al.), is displayed across the protein positions. The color scale represents the size of the rolling window used for calculating mutations per codon, with yellow indicating a 150 bp window and red indicating a 4 bp window. Black bars represent the presence of an amplicon covering the loci. Amplicon designs for NOTCH2, NOTCH3, and FAT1 are provided in Supplementary Figure 1. C. Heatmap of filtered variants detected in mixing study. Cell lines HCT116, KYSE270, and KYSE410 were mixed and processed using scG2P. The heatmap displays the detected filtered variants for each individual cell, clustered by cell line based on the variant allele frequencies (VAFs) of the DNA variants. Variants annotated in red were independently validated using whole-exome sequencing data from the Cancer Cell Line Encyclopedia (CCLE) database. The genotype of each variant is indicated as homozygous (HOM), heterozygous (HET), wild-type (WT), or missing. D. (Left) RNA expression-based uniform manifold approximation projection (UMAP) for cell line mixing experiment. HCT116 (n = 234 cells), KYSE270 (n = 403 cells), and KYSE410 (n = 355 cells) are colored according to their assigned cell line identity, determined by k-means clustering of the variant allele frequencies of DNA variants. (Right) Violin plots displaying the RNA expression levels (center log ratio) of four marker genes (KRT23, KRT5, KRT7, and EPCAM) across the three cell lines. E. Confusion matrix comparing RNA-based clustering labels (predicted) and DNA-based clustering labels (ground truth) of the cell line mixing study. The matrix displays the percentage of cells assigned to each cell line based on RNA expression profiles compared to the ground truth DNA-based assignments. Diagonal elements represent correctly classified cells, while off-diagonal elements indicate misclassifications. The mean accuracy across all cell lines is 0.95. F. Nonsynonymous mutations captured across driver genes, stratified by gene and sample. (Left) Bar plot displaying the number of nonsynonymous mutations detected in each driver gene across all samples. (Right) Bar plot showing the contribution of nonsynonymous mutations by each driver gene for each patient sample. G. Clonal structure of ESO-5. Terminal nodes represent distinct subclones, with node sizes proportional to the relative mutant cell fraction of each subclone. Branch lengths are scaled to reflect the acquisition of a single mutation. H. Mutational burden per clone and distribution of clonal mutations across driver genes. (Left) Fraction of cells harboring 0, 1, or 2 mutations per clone for cells passing the 50% genotyping completeness threshold. (Right) Fraction of cells with mutation in indicated driver gene, or combination of mutations in driver genes. I. Clones detected across all donors. Circles represent clones called in each donor, colored by driver mutations detected in the clone, and y-axis representing the fraction of total cells each clone makes up in the sample. J. (Top) Scatter plot illustrating the Pearson correlation between the proportion of wild-type cells and donor age (R = 0.84). (Bottom) Scatter plot illustrating the Pearson correlation between clonal diversity, computed by the Shannon entropy index, and donor age (R = 0.48). Each point represents a donor, and the lines represent the linear fit. K. Clone fractions of cells with single driver mutation. Box plot display the distribution of mean mutant cell fractions of clones for each mutated gene across all donors (Center line, median; box, IQR; whisker, 1.5*IQR). Only cells with single mutations were included. L. Fraction of cells with mutation in NOTCH1 and TP53 genes. The cell fractions (left y-axis) of detected variants for each sample are plotted along the protein positions of NOTCH1 and TP53. Each variant is annotated with its coding impact (missense, synonymous, in frame, or frameshift mutation). The mutant cell fraction plot is overlaid with the hotspot mutation density, as shown in B, representing the number of mutations per codon (right y-axis) as previously reported by Yokoyama et al. from bulk sequencing of the esophageal microdissections. The genotyping efficiency is displayed below each plot using a color scale that indicates the proportion of cells genotyped at each locus. Note that fraction of cells with mutation is represented by the clone fraction in all single-mutant clones, whereas in 2 out of 5 donors with detected double mutant clones, the mutant fraction is the sum of the parent clone and double mutant subclone fractions.
Figure 2.
Figure 2.. Esophageal epithelium is colonized by diverse somatic mutant clones with phenotypic biases
A. (Left) Uniform manifold approximation and projection (UMAP) of single cells from all samples using RNA expression, colored by annotated cell types. (Right) Dot plot displaying cell type marker genes (x-axis) used for cell type annotation (y-axis). Dot size represents the percentage of cells expressing the marker gene, and color scale indicates the mean expression level (centered log ratio) within each cell type. B. Violin plots comparing cell cycling scores (left) and differentiation scores (right) across assigned cell types. Cell cycle and differentiation scores were calculated as gene-module scores based on cycling and differentiation gene sets expression from the RNA panel. C. Diffusion map of epithelial single cells merged from ESO-1, ESO-2, ESO-3, and ESO-5, annotated by cell types (top) and overlaid with trajectory scores (bottom). The trajectory scores represent the differentiation stage of each cell along the inferred pseudotime trajectory. Fibroblasts from A were excluded from this analysis. D. Clonal composition across the pseudotime diffusion map representing the differentiation stage for the ESO-5 sample. Clone fractions are summed by driver gene mutation and relative abundance plotted against pseudotime quantiles representing differentiation trajectory. E. Mean differentiation scores of cells assigned to clones across all donor samples. Dot size represents the clone fraction and color indicates the mutant driver gene. The differentiation scores are min-max scaled within each sample to allow for comparison across samples. F. Mean differentiation and cycling scores of cells assigned to clones with single driver mutation, aggregated by mutant driver genes across all samples. Each point represents aggregation of cells with mutation in a specific driver gene, with error bars indicating the standard error of the mean across cells (SEM). G. Clones from the ESO-5 sample projected onto the differentiation and cell cycling score axes (mean score of cells assigned to clones). Each dot represents a clone, with the dot size proportional to the clone fraction and color indicating the mutant driver gene. WT clone fraction is fixed at 0.1 for visualization purposes. True WT proportions represented in Fig. 1H. H. Diffusion map from C overlaid with kernel density estimates over those dimensions for cells with TP53:p.R135W mutation. I. Volcano plot comparing differentially expressed transcripts between TP53 mutant cells and wild-type cells. Horizontal dotted line represents FDR < 0.05; vertical dotted lines represent average log2 fold change (log2FC) > 0.15. J. Clones from the ESO-5 sample projected according to their mean expression of KLF5 and TP63. Dot size represents the clone fraction, and color indicates the mutant driver gene. WT cells are fixed at clone fraction of 0.1 and used to visualize as comparison to clone scores.

References

    1. Frankell A. M. et al. The evolution of lung cancer and impact of subclonal selection in TRACERx. Nature 616, 525–533 (2023). - PMC - PubMed
    1. Landau D. A. et al. Evolution and impact of subclonal mutations in chronic lymphocytic leukemia. Cell 152, 714–726 (2013). - PMC - PubMed
    1. Landau D. A. et al. Mutations driving CLL and their evolution in progression and relapse. Nature 526, 525–530 (2015). - PMC - PubMed
    1. Martincorena I. et al. Somatic mutant clones colonize the human esophagus with age. Science 362, 911–917 (2018). - PMC - PubMed
    1. Martincorena I. & Campbell P. J. Somatic mutation in cancer and normal cells. Science 349, 1483–1489 (2015). - PubMed

Publication types