[Preprint]. 2024 Dec 1:2024.05.16.594581.
doi: 10.1101/2024.05.16.594581.

Intracellular Retention of Estradiol is Mediated by GRAM Domain-Containing Protein ASTER-B in Breast Cancer Cells

Affiliations

Intracellular Retention of Estradiol is Mediated by GRAM Domain-Containing Protein ASTER-B in Breast Cancer Cells

Hyung Bum Kim et al. bioRxiv. .

Update in

Abstract

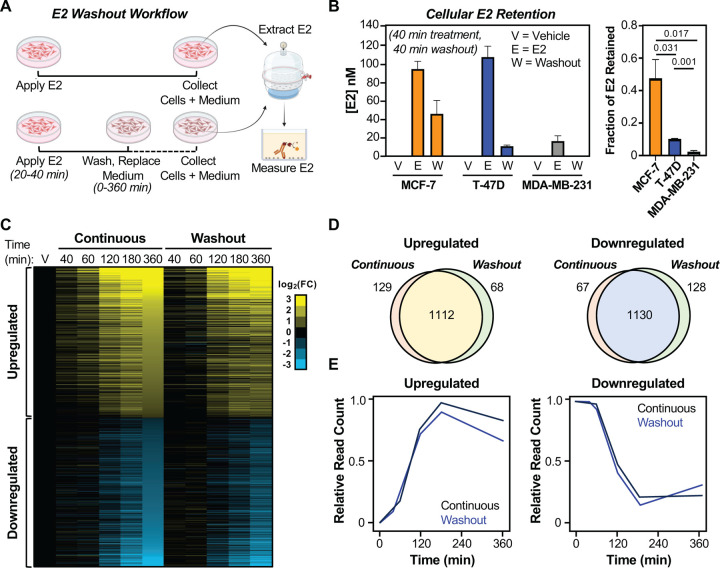
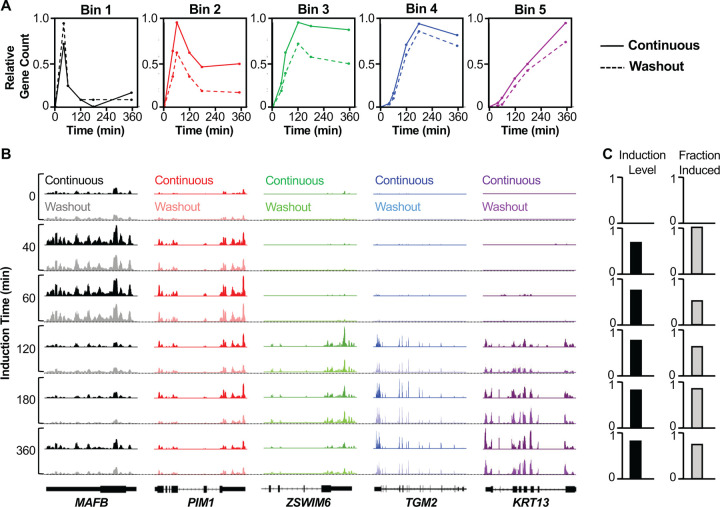
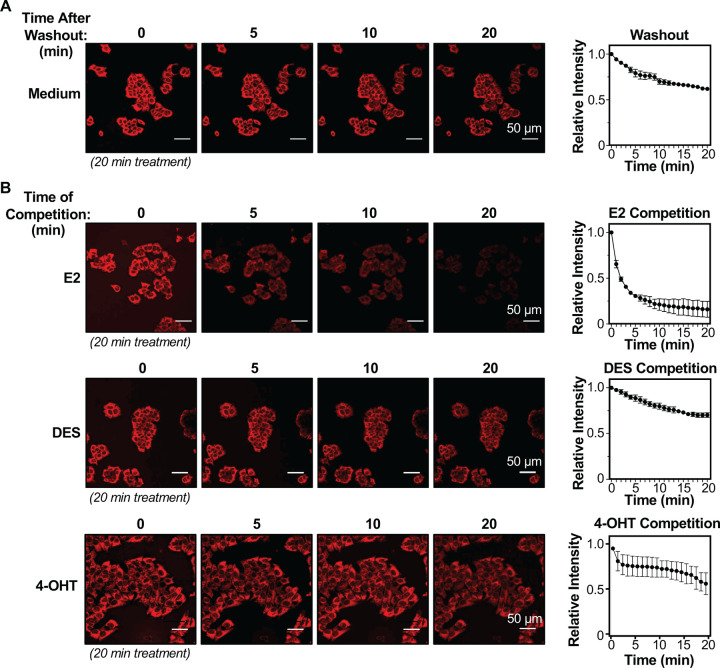
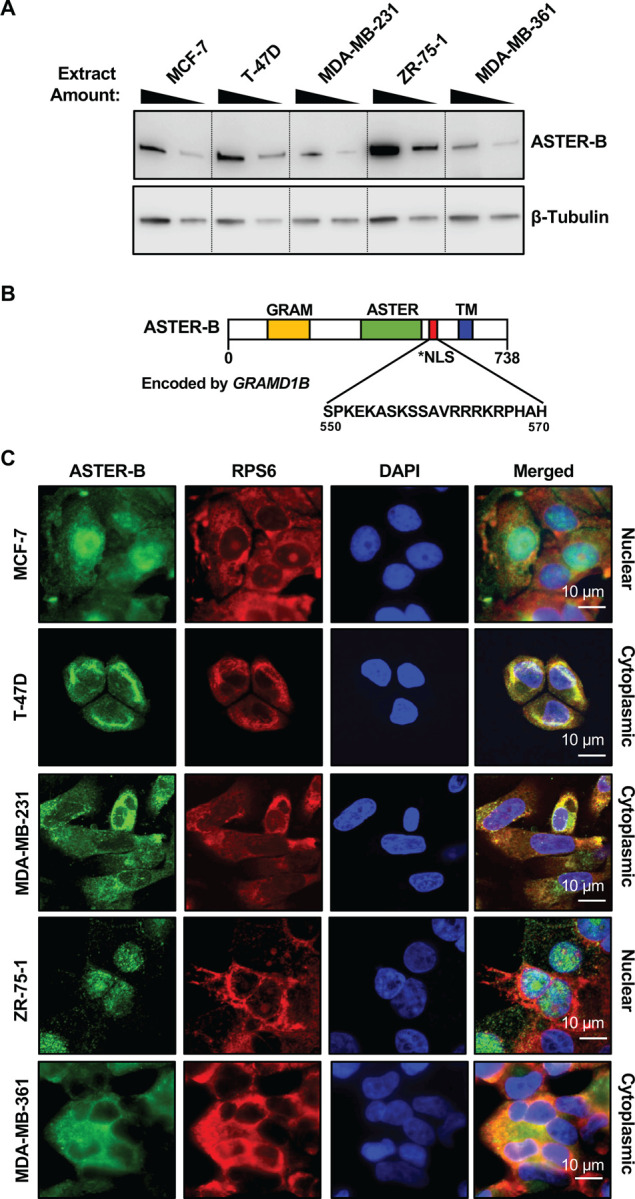
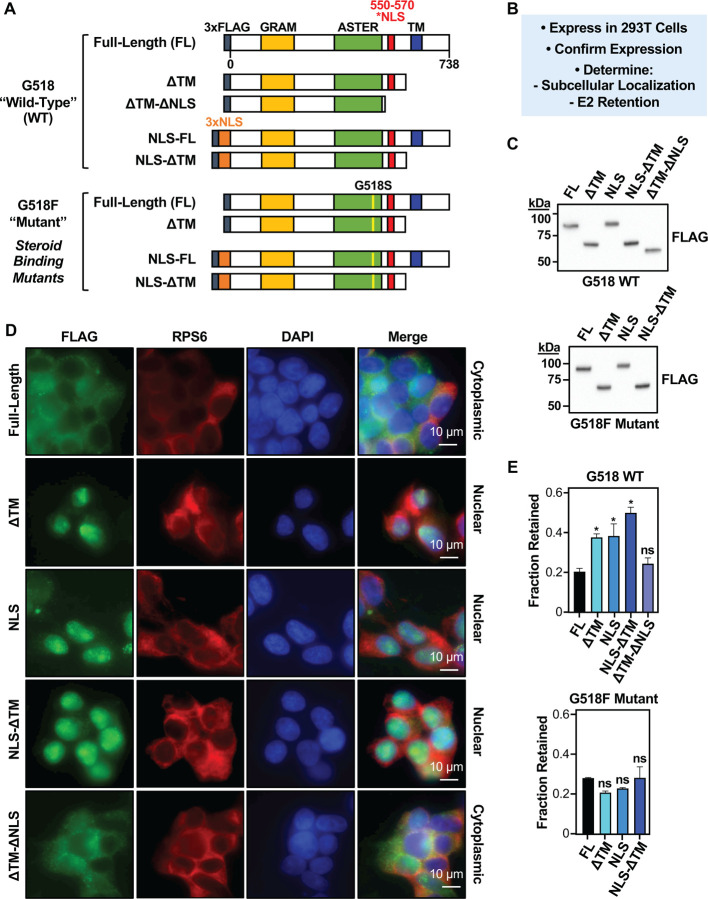
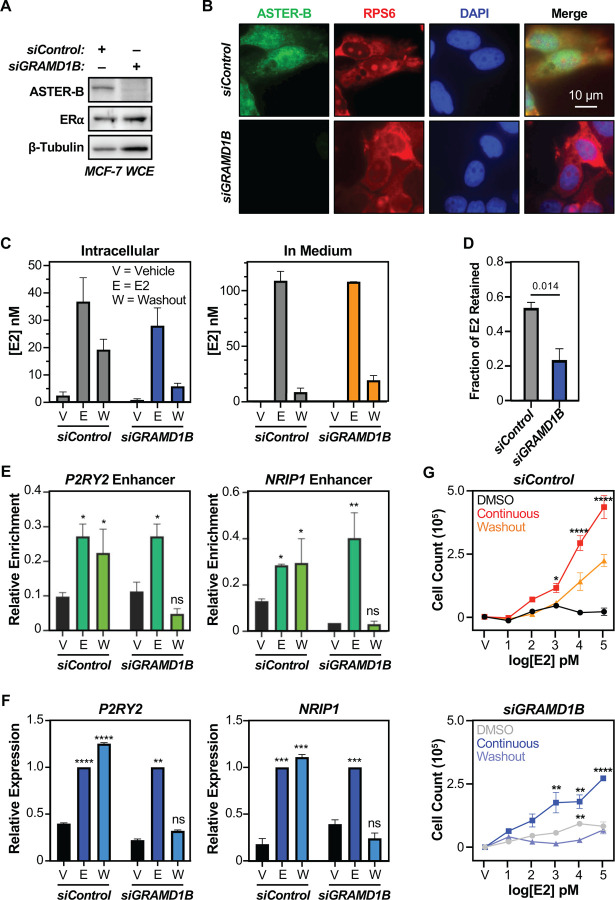
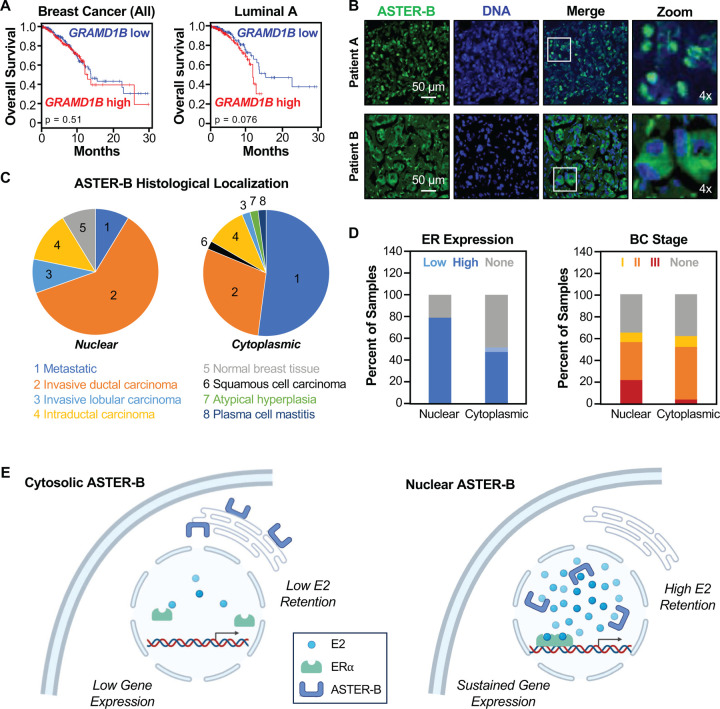
Elevated blood levels of estrogens have been associated with poor prognosis in estrogen receptor-positive (ER+) breast cancers, but the relationship between circulating hormone levels in the blood and intracellular hormone concentrations are not well characterized. We observed that MCF-7 cells treated acutely with 17β-estradiol (E2) retain a substantial amount of the hormone even upon removal of the hormone from the culture medium. Moreover, global patterns of E2-dependent gene expression are sustained for hours after acute E2 treatment and hormone removal. While circulating E2 is sequestered by sex hormone binding globulin (SHBG), the potential mechanisms of intracellular E2 retention are poorly understood. We found that a mislocalization of a steroid-binding GRAM-domain containing protein, ASTER-B, to the nucleus, which is observed in a subset of breast cancer patients, is associated with higher cellular E2 retention. Accumulation and retention of E2 are related to the steroidal properties of E2, and require nuclear localization and steroid binding by ASTER-B, as shown using a panel of mutant ASTER-B proteins. Finally, we observed that nuclear ASTER-B-mediated E2 retention is required for sustained hormone-induced ERα chromatin occupancy at enhancers and gene expression, as well as subsequent cell growth responses. Our results add intracellular hormone retention as a mechanism controlling E2-dependent gene expression and downstream biological outcomes.

Keywords: ASTER-B; E2; Estrogen receptor; breast cancer; gene expression; hormone.


Conflict of interest statement

Disclosures: The authors have no relevant conflicts to disclose. Disclosures The authors have no relevant conflicts to disclose.

Figures

Figure 1.
Figure 1.. Intracellular E2 retention in MCF-7 cells is associated with sustained gene expression after hormone removal.
(A) Schematic showing workflow of induction and washout experiments. (B) Cellular E2 levels of breast cancer cell lines including MCF-7, T-47D, and MDA-MB-231 as measured by an ELISA-based assay. Initial treatment with E2 was 40 min, followed by 20 min of washout. Fraction of E2 retained in cells were calculated by dividing measured E2 levels in the washout conditions with their respective E2 treated conditions. Significance was determined using multiple Student’s t-tests (non-parametric) with a Šidák-Bonferroni correction. p-values are indicated, n = 3. (C) Heatmap showing fold-change gene expression derived from RNA-seq of MCF-7 cells for continuous treatment and washout experiments. Initial treatment with E2 was 40 min, followed by 20 min of washout. Genes are ranked based on fold change at endpoint (360 mins) of continuous treatment conditions. (D) Venn diagrams showing the overlap of all differentially expressed genes between the continuous treatment and washout conditions for both upregulated (left panel) and downregulated (right panel) genes. (E) Graph showing relative reads per kilobase mapped reads (RPKM) for continuous treatment and washout conditions across different timepoints for upregulated (left panel) and downregulated (right panel) genes.
Figure 2.
Figure 2.. Analysis of steady-state gene expression upon continuous E2 treatments or after washout.
(A) Bins showing relative number of genes grouped based on time of maximum expression for both continuous and washout groups (Bin 1 = 40 min., Bin 2 = 1 hr., Bin 3 = 2 hr., Bin 4 = 3 hr., and Bin 5 = 6 hr.). Solid lines represent continuous treatment and dotted lines represent washout treatment. (B) Browser tracks of representative genes for each bin. From left to right black = Bin 1, red = Bin 2, green = Bin 3, blue = Bin 4, and purple = Bin 5. Darker colors represent continuous treatment and lighter colors represent washout treatment. (C) Graphs showing induction levels calculated by relative number of genes in washout group with fold-change induction >0.8 that of continuous treatment groups for each bin or fraction of genes induced calculated by the ratio of genes in the washout to continuous treatment that have fold-change induction >1.5.
Figure 3.
Figure 3.. Washout and competition analyses of E2 retention in MCF-7 cells.
(A) Washout with hormone-free stripped medium after acute treatment with 100 nM E2-Glow reagent for 20 min followed by 20 min of washout. Time t = 0 min indicates start of washout. Quantification of relative intensity of washout experiment images from n = 3 independent biological replicates normalized to value at t = 0 mins (time of washout). The scale is indicated. (B) Competition with 100X concentration of unlabeled E2 (top panel), 100X DES (middle panel), or 4-OHT (bottom panel) after acute treatment with 100 nM E2-Glow for 20 min. Time t = 0 min indicates time of addition of competitor. Quantification of competition experiment images from n = 3 independent biological replicates normalized to value at t = 0 mins (time after addition of unlabeled E2, DES, or 4-OHT). The scale is indicated.
Figure 4.
Figure 4.. ASTER-B localization in breast cancer cells.
(A) Western blot showing the expression of ASTER-B across breast cancer cell lines (MCF-7, T-47D, MDA-MB-231, ZR-75-1, and MDA-MB-361) at two dilutions of whole cell extracts. (B) Schematic showing the domain structure of ASTER-B protein. Putative nuclear localization signal (NLS) is highlighted in red along with its sequence. (C) Immunofluorescence images of breast cancer cell lines stained for ASTER-B (green), RPS6 endoplasmic reticulum stain (red), and DAPI nuclear stain (blue). The scale is indicated.
Figure 5.
Figure 5.. Effects of ectopic expression of ASTER-B mutant proteins on the cellular retention of E2.
(A) Schematic diagram showing the structure of FLAG-tagged ASTER-B wild-type and G518F steroid binding deficient mutant constructs used in the experiments outlined in (B). (C) Western blots showing the size and expression of the ASTER-B G518 wild-type (top) and G518F mutant (bottom) proteins. (D) Immunofluorescent staining showing localization of FLAG-tagged ASTER-B constructs (green), RPS6 endoplasmic reticulum stain (red), and DAPI nuclear stain (blue) in HEK-293T cells. The scale is indicated. (E) Cellular E2 levels of HEK-293T cells expressing ASTER-B wild-type (top) or mutant (bottom) constructs as measured by an ELISA-based assay. The fraction of E2 retained in cells was calculated by dividing the measured levels of E2 in the washout conditions with their respective E2-treated conditions. Significance was determined using multiple Student’s t-tests (non-parametric) with a Šidák-Bonferroni correction Significance values were assigned as follows: * p<0.033, n = 2.
Figure 6.
Figure 6.. ASTER-B nuclear localization is associated with cellular retention of E2, regulation of gene expression, and growth in MCF-7 cells.
(A and B) Western blot (A) and immunofluorescence images (B) showing knockdown of ASTER-B in MCF-7 cells. The scale in panel B is indicated. (C and D) Measurement of intracellular (left panel) and culture medium (right panel) E2 levels by ELISA-based quantification. In panel D, significance was determined using multiple Student’s t-tests (non-parametric) with a Šidák-Bonferroni correction. The p-value is indicated, n = 3. (E and F) Chromatin occupancy of ERα at enhancer regions and its corresponding gene expression at E2 regulated genes (P2RY2 and NRIP1) measured by ERα ChIP-qPCR and RT-qPCR respectively. For the ChIP-qPCR assays, initial treatment with E2 was 40 min, followed by 20 min of washout. For the RT-qPCR assays, initial treatment with E2 was 40 min, followed by 1 hour of washout. For statistical analysis, comparisons were made against vehicle control for their own treatment groups. Multiple Student’s unpaired t-tests (non-parametric) with a Šidák-Bonferroni correction used to determine significance. Significance values were assigned as follows: * p<0.033, ** p<0.002, *** p<0.0001, **** p<0.00001. n = 3. (G) Growth assay of MCF-7 cells treated continuously with 100 nM E2, or treated acutely for 40 mins on day 1 (washout), or treated with vehicle control. The cells were also treated with control siRNA (top panel) or siGRAMD1B (bottom panel). The cell counts were made on day 5 of the assay. Multiple Student’s unpaired t-tests (non-parametric) with a Šidák-Bonferroni correction used to determine significance. Significance values were assigned as follows: * p<0.033, ** p<0.002, *** p<0.0001, **** p<0.00001. n = 3.
Figure 7.
Figure 7.. Nuclear ASTER-B localization is associated with decreased survival.
(A) Kaplan-Meier survival plots of all TCGA breast cancer patients (n = 1064; left panel) and specifically luminal A subtype breast cancer patients (n = 415; right panel) with high (red line) or low (blue line) GRAMD1B mRNA expression level over a 5-year period. P-values were calculated using the Log-rank test. (B) Representative images of either nuclear (top panel) or cytoplasmic (bottom panel) ASTER-B (green) co-stained with DAPI (blue). (C) Pie charts showing the histological subtypes of patients with either nuclear localized (left panel) or cytoplasmic (right panel) ASTER-B as assessed by immunostaining of a commercial breast cancer tissue microarray. (D) Graphs showing ERα expression status (left panel) and breast cancer stages (right panel) of nuclear or cytoplasmic ASTER-B in a breast cancer tissue microarray as determined by immunohistochemistry (IHC) staining and histology respectively. (E) Schematic showing a working model of ASTER-B mediated E2 cellular retention. The schematics were generated using BioRender (BioRender.com). Details are provided in the text.

Similar articles

References

    1. Hanker AB, Sudhan DR, Arteaga CL. Overcoming Endocrine Resistance in Breast Cancer. Cancer Cell 2020;37(4):496–513 doi 10.1016/j.ccell.2020.03.009. - DOI - PMC - PubMed
    1. Endogenous H, Breast Cancer Collaborative G, Key TJ, Appleby PN, Reeves GK, Travis RC, et al. Sex hormones and risk of breast cancer in premenopausal women: a collaborative reanalysis of individual participant data from seven prospective studies. Lancet Oncol 2013;14(10):1009–19 doi 10.1016/S1470-2045(13)70301-2. - DOI - PMC - PubMed
    1. Zhang X, Tworoger SS, Eliassen AH, Hankinson SE. Postmenopausal plasma sex hormone levels and breast cancer risk over 20 years of follow-up. Breast Cancer Res Treat 2013;137(3):883–92 doi 10.1007/s10549-012-2391-z. - DOI - PMC - PubMed
    1. Pan H, Gray R, Braybrooke J, Davies C, Taylor C, McGale P, et al. 20-Year Risks of Breast-Cancer Recurrence after Stopping Endocrine Therapy at 5 Years. N Engl J Med 2017;377(19):1836–46 doi 10.1056/NEJMoa1701830. - DOI - PMC - PubMed
    1. Nelson LR, Bulun SE. Estrogen production and action. J Am Acad Dermatol 2001;45(3 Suppl):S116–24 doi 10.1067/mjd.2001.117432. - DOI - PubMed

Publication types

LinkOut - more resources