

This is a preprint.
Establishing neuroanatomical correspondences across mouse and marmoset brain structures
- PMID: 38826382
- PMCID: PMC11142350
- DOI: 10.21203/rs.3.rs-4373678/v1
Establishing neuroanatomical correspondences across mouse and marmoset brain structures
Abstract
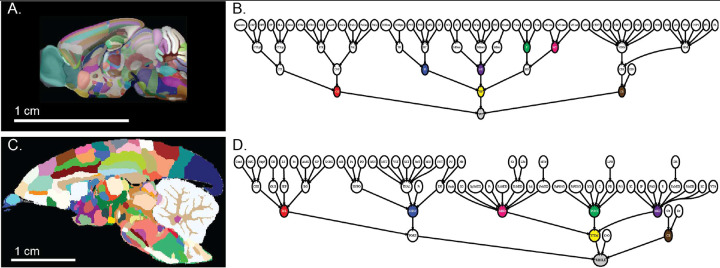
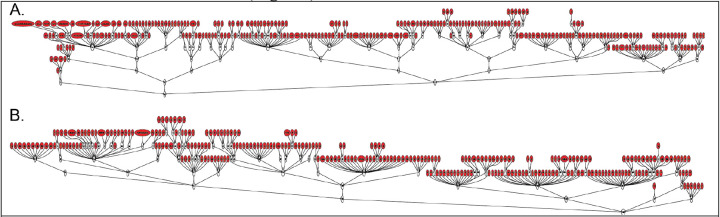
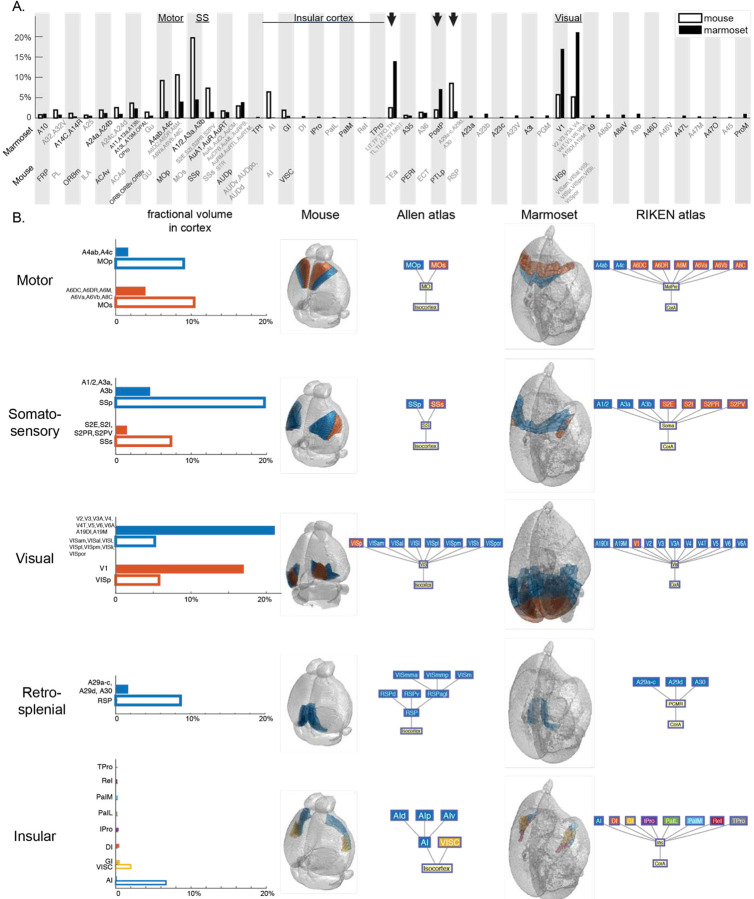
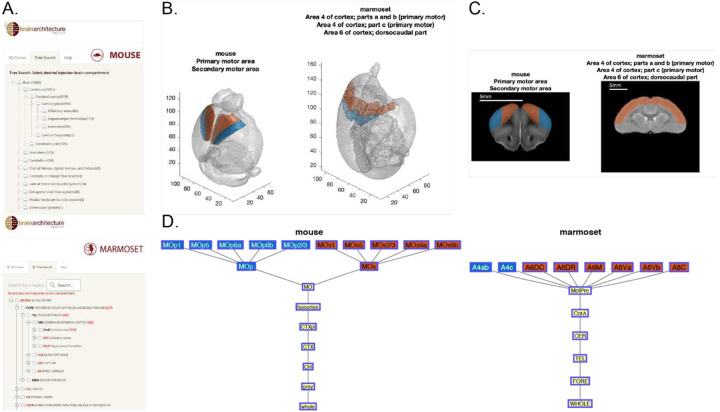
Interest in the common marmoset is growing due to evolutionarily proximity to humans compared to laboratory mice, necessitating a comparison of mouse and marmoset brain architectures, including connectivity and cell type distributions. Creating an actionable comparative platform is challenging since these brains have distinct spatial organizations and expert neuroanatomists disagree. We propose a general theoretical framework to relate named atlas compartments across taxa and use it to establish a detailed correspondence between marmoset and mice brains. Contrary to conventional wisdom that brain structures may be easier to relate at higher levels of the atlas hierarchy, we find that finer parcellations at the leaf levels offer greater reconcilability despite naming discrepancies. Utilizing existing atlases and associated literature, we created a list of leaf-level structures for both species and establish five types of correspondence between them. One-to-one relations were found between 43% of the structures in mouse and 47% in marmoset, whereas 25% of mouse and 10% of marmoset structures were not relatable. The remaining structures show a set of more complex mappings which we quantify. Implementing this correspondence with volumetric atlases of the two species, we make available a computational tool for querying and visualizing relationships between the corresponding brains. Our findings provide a foundation for computational comparative analyses of mesoscale connectivity and cell type distributions in the laboratory mouse and the common marmoset.
Conflict of interest statement
Competing interests. The authors claim no competing interest.
Figures
Similar articles
-
Establishing neuroanatomical correspondences across mouse and marmoset brain structures.bioRxiv [Preprint]. 2024 May 8:2024.05.06.592808. doi: 10.1101/2024.05.06.592808. bioRxiv. 2024. PMID: 38765971 Free PMC article. Preprint.
-
Comparative anatomy of marmoset and mouse cortex from genomic expression.J Neurosci. 2012 Apr 11;32(15):5039-53. doi: 10.1523/JNEUROSCI.4788-11.2012. J Neurosci. 2012. PMID: 22496550 Free PMC article.
-
Constructing and optimizing 3D atlases from 2D data with application to the developing mouse brain.Elife. 2021 Feb 11;10:e61408. doi: 10.7554/eLife.61408. Elife. 2021. PMID: 33570495 Free PMC article.
-
Current models of the marmoset brain.Neurosci Res. 2015 Apr;93:116-27. doi: 10.1016/j.neures.2015.01.009. Epub 2015 Mar 26. Neurosci Res. 2015. PMID: 25817023 Review.
-
Mini-atlas of the marmoset brain.Neurosci Res. 2015 Apr;93:128-35. doi: 10.1016/j.neures.2014.12.014. Epub 2015 Jan 5. Neurosci Res. 2015. PMID: 25573716 Review.
References
-
- Comparative Anatomy and Histology. (2018) doi:10.1016/c2014-0-03145-0. - DOI
Publication types
Grants and funding
LinkOut - more resources
Full Text Sources
