[Preprint]. 2024 May 22:rs.3.rs-3962451.
doi: 10.21203/rs.3.rs-3962451/v1.

Spatial interactions modulate tumor growth and immune infiltration

Affiliations

Spatial interactions modulate tumor growth and immune infiltration

Sadegh Marzban et al. Res Sq. .

Update in

Abstract

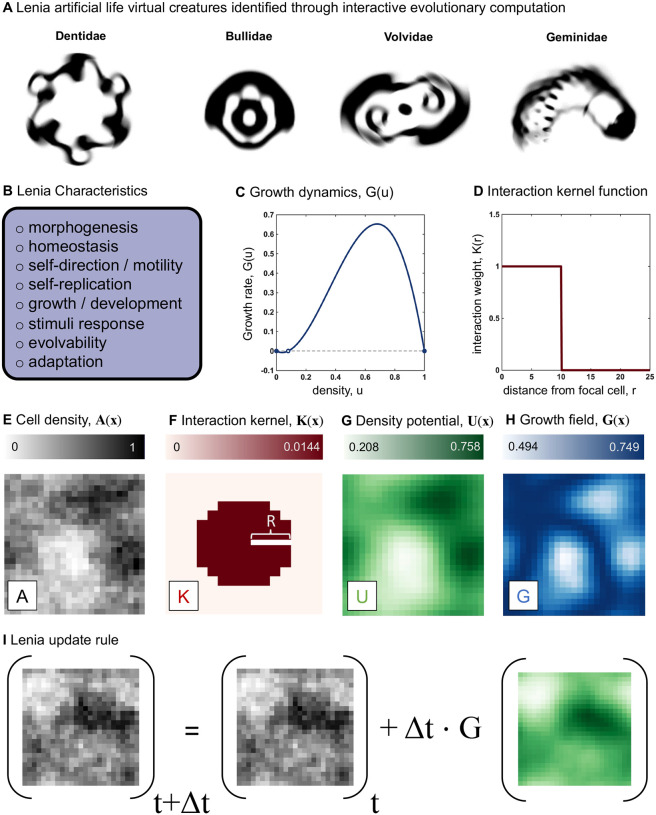
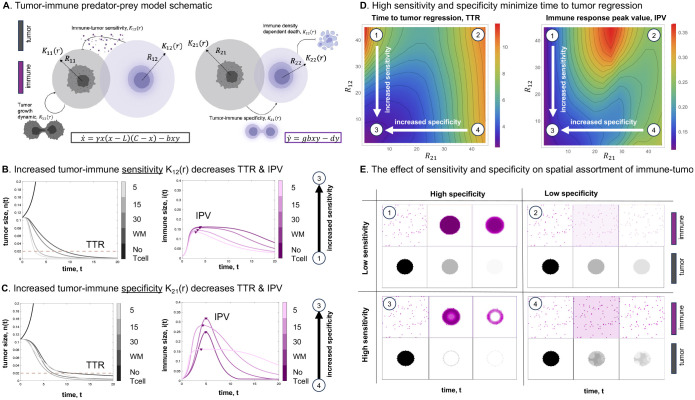
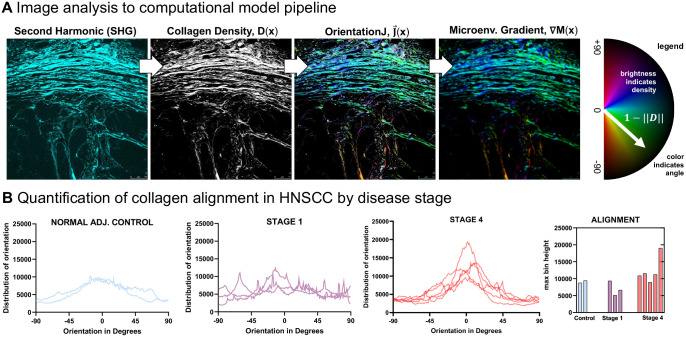
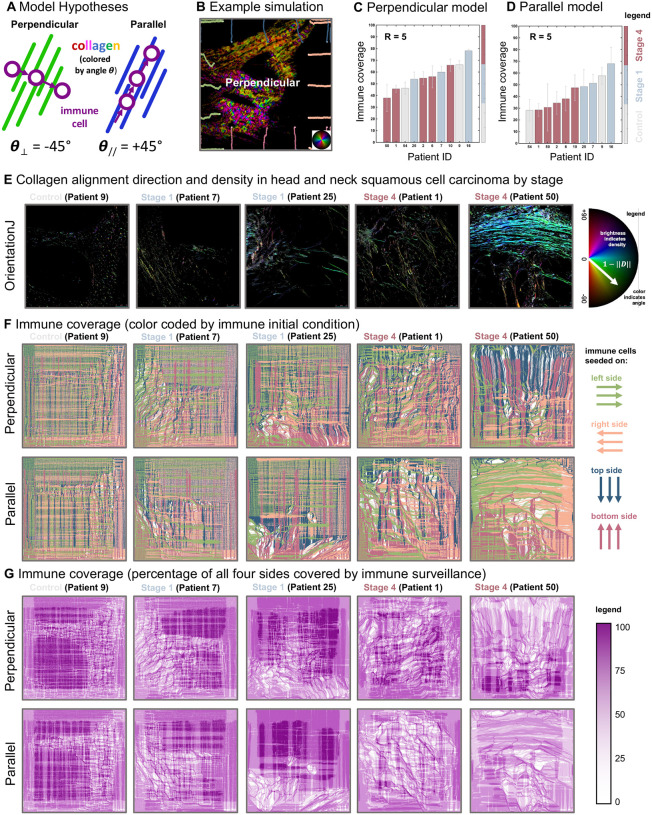
Lenia, a cellular automata framework used in artificial life, provides a natural setting to implement mathematical models of cancer incorporating features such as morphogenesis, homeostasis, motility, reproduction, growth, stimuli response, evolvability, and adaptation. Historically, agent-based models of cancer progression have been constructed with rules that govern birth, death and migration, with attempts to map local rules to emergent global growth dynamics. In contrast, Lenia provides a flexible framework for considering a spectrum of local (cell-scale) to global (tumor-scale) dynamics by defining an interaction kernel governing density-dependent growth dynamics. Lenia can recapitulate a range of cancer model classifications including local or global, deterministic or stochastic, non-spatial or spatial, single or multi-population, and off or on-lattice. Lenia is subsequently used to develop data-informed models of 1) single-population growth dynamics, 2) multi-population cell-cell competition models, and 3) cell migration or chemotaxis. Mathematical modeling provides important mechanistic insights. First, short-range interaction kernels provide a mechanism for tumor cell survival under conditions with strong Allee effects. Next, we find that asymmetric interaction tumor-immune kernels lead to poor immune response. Finally, modeling recapitulates immune-ECM interactions where patterns of collagen formation provide immune protection, indicated by an emergent inverse relationship between disease stage and immune coverage.


Figures

Figure 1.
Figure 1.. Lenia as a cancer model:
(A) Lenia artificial life virtual creatures, reproduced from ref. . (B) List of characteristics possible to produce in Lenia by varying the growth dynamics function (C) or the interaction kernel function (D). (E) An example snapshot of a simulation shows the density of cells at each lattice location where the interaction kernel (F) specifies the nature of interaction of cells depending on their distance from each other. (G) The density potential, interpreted as a weighted average of interactions at each lattice location, is calculated as the convolution of A(x) and K(x). (H) the growth field calculated by applying a growth map to the density potential. (I) adding a fraction of the growth field at each time step to the cell density, forms the Lenia update rule, as seen in eqn. 1.
Figure 2.
Figure 2.. Cancer growth dynamics in Lenia
(A) Average cell density over time for varying kernel sizes, for deterministic and stochastic Lenia. Averages over stochastic runs are shown in dotted lines and individual trajectories are shown in translucent lines. ODE solution (shown in blue) matches simulation with a well-mixed kernel. (B) State of field at half maximal capacity for different kernel sizes for Stochastic Lenia (SL) or Deterministic Lenia (DL). Density potential and Growth distribution shown in inset. (C) State of field at progressive time points for kernel size 4 for deterministic and stochastic Lenia. (D) Kernels used in models in figures (B).
Figure 3.
Figure 3.. Short-range interaction kernels are more robust to Allee effects
(A) Average cell density over time for varying kernel sizes, for deterministic and stochastic Lenia. Averages over stochastic runs are shown in dotted lines and individual trajectories are shown in translucent lines. ODE solution shown in blue. (B) Long-term tumor fate for deterministic Lenia where trajectories that eventually result in extinction are shown in red, or growth shown in blue (colorbar indicates change in tumor size at t*=3. (C, D) Spatial maps shown for deterministic Lenia (C) and stochastic Lenia (D) at time t*=3. See corresponding Supplementary Video S2.
Figure 4.
Figure 4.. Competition dynamics in Lenia
(A) Schematic representation of the tumor-immune predator-prey model, illustrating various kernel sizes for tumor growth K11, predation distance K12, immune recruitment K21, and density-dependent death distance in the immune system K22. (B, C) Impact of different predation distances K12 and immune recruitment K21 on the integration results of the tumor-immune predator-prey model, with other kernels held well-mixed. (D) Effect of varying predation and recruitment (K12 and K21) on the time to tumor regression (considered when there are 2% tumor cells in the area) and the peak value in the immune response. (E) Spatial outcomes of the tumor and immune response in the model, showcasing the influence of different kernel sizes. See corresponding Supplementary Video S3. Unless otherwise noted, parameters used are γ=5,b=12,g=1.5,d=1,L=0.08 (see eqns. 6–7).
Figure 5.
Figure 5.. Collagen alignment in HNSCC
(A) Pipeline of image analysis to computational model using second harmonic generation to determine collagen density and subsequently the alignment and microenvironmental gradient. (B) Alignment collagen fibers is determined using OrientationJ ImageJ plugin; alignment tends to increase by disease stage.
Figure 6.
Figure 6.. Immune cell trafficking model in Particle Lenia
(A) Hypothesized models of the influence of collagen fiber alignment on immune cell trafficking. See corresponding Supplementary Video S4. (B) example simulation showing immune cell infiltration (circles) with track indicating path taken. Cells seed on all four sides, color-coded by initial side (see panel F). (C, D) Simulated immune coverage for perpendicular (C) or parallel (D) immune trafficking model, colored by stage. (E) Representative sample ROI alignment and density of collagen fibers (using OrientationJ ImageJ plugin) ordered by disease stage. (F) Immune coverage, color coded by immune initial condition of which of the four sides: left, right, top, bottom (see legend). The color of each pixel is determined the most trafficked side. (G) Immune coverage as the percentage of all four sides covered by immune surveillance. For example, if no immune cells reached this pixel it is white, if all four sides reached this pixel, it is dark purple. See corresponding Supplementary Video S5.

References

    1. Chan B. W.-C. Lenia-biology of artificial life. arXiv preprint arXiv:1812.05433 (2018).
    1. Chan B. W.-C. Lenia and expanded universe. In Artificial Life Conference Proceedings 32, 221–229 (MIT Press One Rogers Street, Cambridge, MA 02142–1209, USA journals-info …, 2020).
    1. Jain S. & Shrestha A. Capturing emerging complexity in lenia. arXiv preprint arXiv:2305.09378 (2023).
    1. Gardner M. Mathematical games-the fantastic combinations of john conway’s new solitaire game, life, 1970. Scientific American, October 120–123.
    1. Davis Q. T. & Bongard J. Glaberish: generalizing the continuously-valued lenia framework to arbitrary life-like cellular automata. In Artificial Life Conference Proceedings 34, vol. 2022, 47 (MIT Press One Rogers Street, Cambridge, MA: 02142–1209, USA journals-info …, 2022).

Publication types

LinkOut - more resources