[Preprint]. 2024 Dec 13:2024.05.22.595209.
doi: 10.1101/2024.05.22.595209.

CRASH2p: Closed-loop Two Photon Imaging in a Freely Moving Animal

Affiliations

CRASH2p: Closed-loop Two Photon Imaging in a Freely Moving Animal

Paul McNulty et al. bioRxiv. .

Update in

Abstract

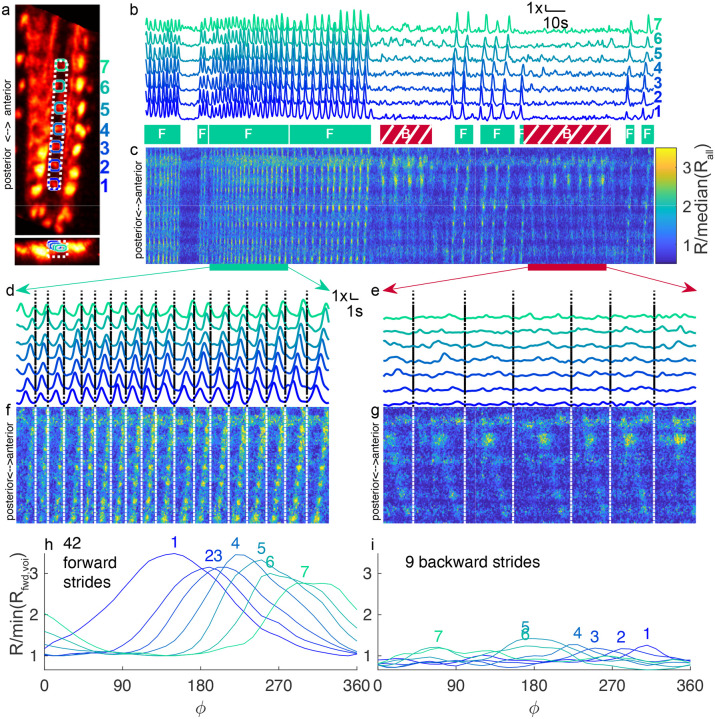
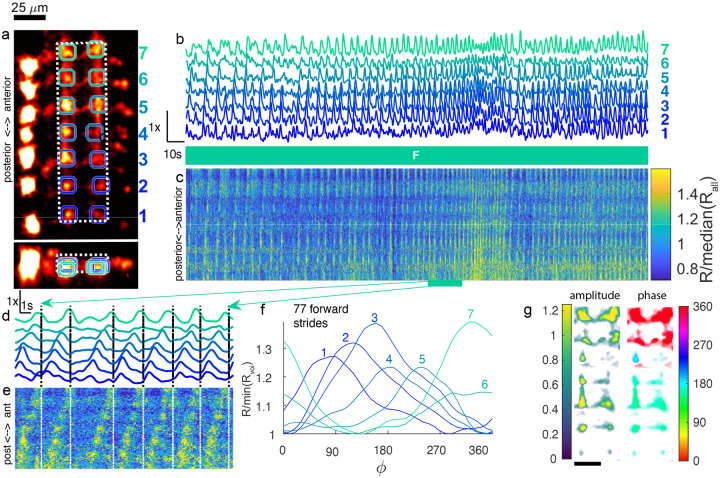
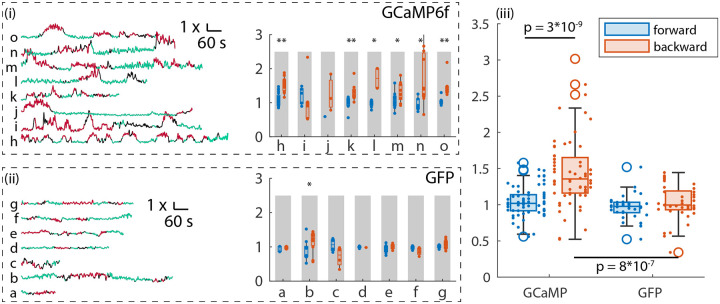
Direct measurement of neural activity in freely moving animals is essential for understanding how the brain controls and represents behaviors. Genetically encoded calcium indicators report neural activity as changes in fluorescence intensity, but brain motion confounds quantitative measurement of fluorescence. Translation, rotation, and deformation of the brain and the movements of intervening scattering or auto-fluorescent tissue all alter the amount of fluorescent light captured by a microscope. Compared to single-photon approaches, two photon microscopy is less sensitive to scattering and off-target fluorescence, but more sensitive to motion, and two photon imaging has always required anchoring the microscope to the brain. We developed a closed-loop resonant axial-scanning high-speed two photon (CRASH2p) microscope for real-time 3D motion correction in unrestrained animals, without implantation of reference markers. We complemented CRASH2p with a novel scanning strategy and a multi-stage registration pipeline. We performed volumetric ratiometrically corrected functional imaging in the CNS of freely moving Drosophila larvae and discovered previously unknown neural correlates of behavior.


Conflict of interest statement

Declaration of Interests The authors declare no competing interests.

Figures

Figure 1:
Figure 1:
CRASH2p Microscopy: Top (a): Principle of operation. Tracking path: a pulsed laser with a central wavelength of 1070 nm was directed through a resonant tag lens on to the galvanometers of one scan head. Imaging path: a pulsed laser with a central wavelength of 920 nm was combined with the 1070 nm laser beam using a dichroic beam splitter and directed through a separate tag lens on to the galvanometers of a second scan head. A delay line (Figure 6) was adjusted so that the 1070 nm pulses on the two paths were displaced by 1/2 cycle (7.1 ns). The two scan paths were recombined using a polarizing beam splitter and directed through a tube lens onto a 25x objective mounted on a piezo scanner. Fluorescently emitted red and green photons were collected by the objective and directed onto separate PMTs, operated in photon counting (binary) mode. The signal from the “red” PMT was temporally demultiplexed; all three (tracking red, imaging red, and imaging green) binarized PMT signals were sent to an FPGA card. Tracking was achieved by rastering the tracking beam in a cylinder about a target neuron; the position of the beam and the record of emitted photons were combined to form an estimate of the neuron’s position. Feedback: Each new tracker estimate was combined with previous estimates using a Kalman filter and fed back to direct the next cylindrical scan. The tracked neuron’s location was added to the imaging path target location, so the scan was always referenced to the tracked neuron. Intermediate speed feedback in z was achieved by adjusting the piezo positioner, and slower feedback on all 3 axes was provided by adjusting a motorized stage to bring the tracked neuron to the center of the field of view. Image reconstruction: During experiments, XY and XZ image projections were assembled on the FPGA for experimenter use. All photon detection times and beam positioning signals were also streamed to disk for later volumetric image assembly.Bottom: Red (b,d) and green (c,e) XY and XZ projections from a 200ms interval without (b,c) and with (d,e) tracker correction, during forward crawling. Note that although the tracker output was not used in the assembly of the left images (b, c), the tracker was still required for their acquisition; otherwise the labeled cells would have moved outside the imaged volume during scanning. In (b,c) the path of the tracked neuron is shown with circles indicating the starting (left) and ending (right) positions. In 200 ms, the neuron traveled 97 microns at a top speed of approximately 0.8 mm/s. Genotype: R36G02>mCherry,GCaMP6f
Figure 2:
Figure 2:. Calcium imaging of A27h central processes.
2nd instar larva expressed GCaMP6f and hexameric mCherry under R36G02 control. During the 253 second recording shown, the larva travelled 5.3 mm from its original position along a path length of 1 cm (a) X-Y and X-Z projection of template image created from mCherry channel of labeled VNC. Colored circles indicate VOIs analyzed in panels b,d,e,h,i. Vois progress numerically from posterior to anterior. White dashed line indicates volume projected in panels c,f,g (b) Ratiometric (GCaMP6f/mCherry) measurement of activity in VOIs over the time course of the experiment, normalized separately for each VOI. Periods of forward (teal box labeled with F) and backward (red hatched box labeled with B) crawling are indicated below. Unlabeled periods represent turns and pauses. (c) Time-space projection of ratiometric activity measure. The vertical (space) axis spans the range from the bottom of the white box to the top. The horizontal (time) axis matches panel (b). The color scale is normalized so that the median of the entire data set shown in the panel is 1. (d-g) Expanded views of voi ratio (d,e) and projected ratios (f,g) during forward (d,f) and backward (e,g) crawling. Panels c,f,g use the same color scale. (h,i) Cycle-average ratiometric activity measure in each VOI, for forward (h) and backward(i) crawling. Each VOI is normalized separately so that the minimum mean activity during forward crawling is 1.
Figure 3:
Figure 3:. Forward and backward activity waves with distinct anatomical footprints.
Same dataset as Figure 2. (a) Average green fluorescence vs. position and peristaltic phase for 42 forward strides (top row) and 9 backward strides (bottom row). Each panel represents 15 degrees of phase or 1/24 cycle. All panels in (a-c) are 80 microns wide, 222 microns tall, and project over the z- (axial) axis. The color scale is the same in all panels of (a,b). (b) Amplitude of projection (|z(x,y)|) onto first two principal components during forward and backward crawling. Fused image shows forward projection amplitude in green and backward in purple. (c) Phase of projection onto first two principal components (arg(z(x,y))) vs space. The projections were spatially low-passed prior to calculation of the angle so that regions with low projection amplitude adopt the phase of their neighbors. (d) First two principal components for forward (teal) and backward (red) crawling. Components were ordered so that the first component (solid) leads the second (dashed). (e,f) Normalized ratio (as in Figure 2 (b,d,e)) for two VOIs during the forward (e) and backward (f) crawling epochs highlighted in Figure 2; the top trace in cyan (same as VOI 4 in Figure 2) was selected from a region with high PCA amplitude during forward crawling and low during backward crawling; the bottom trace in orange was selected from a region with low PCA amplitude during forward crawling and high PCA amplitude during backward crawling (g) Fraction of total variance explained during forward crawling by traveling-wave PCA decomposition, for calcium sensitive and insensitive labeling. GCaMP6f: 10 animals; jGCaMP7f: 5 animals; GFP 5 animals
Figure 4:
Figure 4:. Forward propagating waves in EL central processes.
2nd instar larva expressed GCaMP8m and hexameric mCherry under EL control. During the 269 second recording shown, the larva travelled 11 mm from its original position along a path length of 13.4 mm (a) X-Y and X-Z projection of template image created from mCherry channel of labeled VNC. Colored circles indicate VOIs analyzed in panels b,d,f. Each VOI consisted of two spherical regions centered on the nodules on either side of the midline. White dashed line indicates volume projected in panels c,e (b) Ratiometric (GCaMP8m/mCherry) measurement of activity in VOIs over the time course of the experiment, normalized separately for each VOI. The larva crawled forward for the duration of the experiment, as indicated by the teal box labeled with F. (c) Time-space projection of ratiometric activity measure. The vertical (space) axis spans the range from the bottom of the white box to the top. The horizontal (time) axis matches panel (b). The color scale is normalized so that the median of the entire data set shown in the panel is 1. (d-e) Expanded views of voi ratio (d) and projected ratios (e) during highlighted epoch. panels (c,d) use the same color scale. (e) Cycle-average ratiometric activity measure in each VOI, for forward (h) and backward(i) crawling. Each VOI is normalized separately so that the minimum mean activity during forward crawling is 1. (f) Amplitude and phase of posterior-anterior wave in green fluorescence associated with each voxel in the central processes (white boxed region in (a)). The amplitude is normalized relative to the median green fluorescence of the region. 25 micron scale bar in (a,g)
Figure 5:
Figure 5:. Recording from Mooncrawler Descending Neuron during forward and backward crawling.
One MDN cell body was tracked to stabilize imaging of a larger (150×150×50 μm) volume. The tracked cell body location was extracted from this larger volume and used to quantify fluorescence ratios. (i) Left: Ratiometric activity measure (green fluorscence/red fluorescence) vs. time for 8 different larvae expressing mCherry and GCaMP6f in MDN. Behavioral state (green = forward, red = backward, and black = other) is indicated by color. Each trace is normalized so that the ratiometric measure averaged over all times the larva was crawling forward is 1. Right: Box and whisker plot for each experiment showing the activity measure for each behavioral bout (continuous period of forward or backward crawling) separated by forward and backward crawling. Each data point represents the average ratiometric measure over a single behavioral bout. * / ** rejects the null-hypothesis that the median of all forward crawling bouts is equal to or greater than the median of all backward crawling bouts (one-sided Wilcoxon rank-sum test) at p < 0.05 / 0.01 respectively. (ii) Same as (i), except MDN was labeled with mCherry and Calcium insensitive GFP. (iii) Box-and-whisker plot of the activity measure of each bout shown in panels (i,ii) separated by behavioral state and indicator. Each bout is shown as a small dot; bouts from the same experiment are aligned vertically. The hypothesis that the GCaMP forward median is greater than or equal to the GCaMP backward median is rejected at p = 3 * 10−9 by the one-sided Wilcoxon rank-sum test. The hypothesis that the GCaMP backward median is the same as the GFP backward median is rejected at p = 8 * 10−7 by the two-sided Wilcoxon rank-sum test.
Figure 6:
Figure 6:. Optical Layout of CRASH2p Microscope.
The dual beam hyperscope (shaded gray area in the figure) has two independent scan heads, combined internally with a polarizing beam splitter. One (“tracking”) carries a 1070 nm pulsed laser that excites mCherry but not GFP or GCaMP variants; the other (“imaging”) carries both 1070 nm and 920 nm pulsed lasers, combined with a dicrhoic beamsplitter. The 1070 nm laser is split between the two paths, with a delay arm on the tracking path to enable temporal demultiplexing of the photons excited by the independent scan heads. The power of each laser is modulated using a Pockels cell; the ratio of power in the 1070nm power delivered to the imaging and tracking paths is controlled using a 1/2 wave plate and polarizing beamsplitter. Following the pockels cell, the beams are expanded by a factor of 3x to fill the effective aperture of the TAG lenses when operating at 190 kHz. Each path contains a TAG lens in double pass configuration. A 1:1.5 demagnifying relay between each TAG lens and the hyperscope conjugates the TAG lens onto an initial blank mirror (place-holder for unused resonant galvo, not shown), the x-galvo, and the y-galvo, which are all placed in the same conjugate plane by means of internal 1:1 relays. The two scan paths are recombined internally by a polarizing beamsplitter and then expanded 6.85x to fill the back aperture of the 8mm focal length 0.95 NA objective lens. The objective was mounted on a piezo actuator attached to the Hyperscope MDU, which contained filters and optics to separate the IR excitation light from the visible fluorescence emission and direct the latter onto red-tuned and green-tuned PMTs. A 3-axis stage with piezo-electric immobilizer was attached to the table. The larva’s behavior was monitored using an IR camera mounted below.
Figure 7:
Figure 7:. Pong scan vs. raster scan
Scan patterns overlaying a rotating set of 3 neurons (a)Conventional raster scan - rotation can appear as lateral movement (dashed boxes show separate times when sample appears to be moving left or right) (b) Pong scan samples all 3 neurons in rapid succession, making rotation apparent.

Similar articles

References

    1. Grienberger C. & Konnerth A. Imaging Calcium in Neurons. en. Neuron 73, 862–885. ISSN: 08966273 (Mar. 2012). - PubMed
    1. Hamel E. O., Grewe B., Parker J. & Schnitzer M. Cellular Level Brain Imaging in Behaving Mammals: An Engineering Approach. Neuron 86, 140159. ISSN: 0896-6273 (Apr. 2015). - PMC - PubMed
    1. Lin M. Z. & Schnitzer M. J. Genetically encoded indicators of neuronal activity. en. Nature Neuroscience 19. Publisher: Nature Publishing Group, 1142–1153. ISSN: 1546–1726 (Sept. 2016). - PMC - PubMed
    1. Lecoq J., Orlova N. & Grewe B. F. Wide. Fast. Deep: Recent Advances in Multiphoton Microscopy of In Vivo Neuronal Activity. en. The Journal of Neuroscience 39, 9042–9052. ISSN: 0270-6474, 1529-2401 (Nov. 2019). - PMC - PubMed
    1. Adam Y. All-optical electrophysiology in behaving animals. Journal of Neuroscience Methods 353, 109101. ISSN: 0165-0270 (Apr. 2021). - PubMed

Publication types