

Sex differences of signal complexity at resting-state functional magnetic resonance imaging and their associations with the estrogen-signaling pathway in the brain
- PMID: 38826661
- PMCID: PMC11143120
- DOI: 10.1007/s11571-023-09954-y
Sex differences of signal complexity at resting-state functional magnetic resonance imaging and their associations with the estrogen-signaling pathway in the brain
Abstract
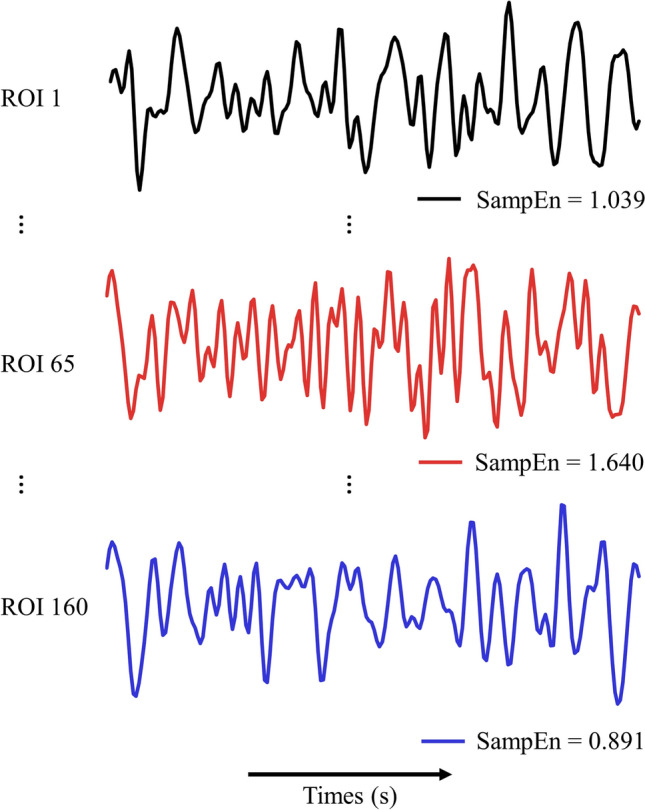
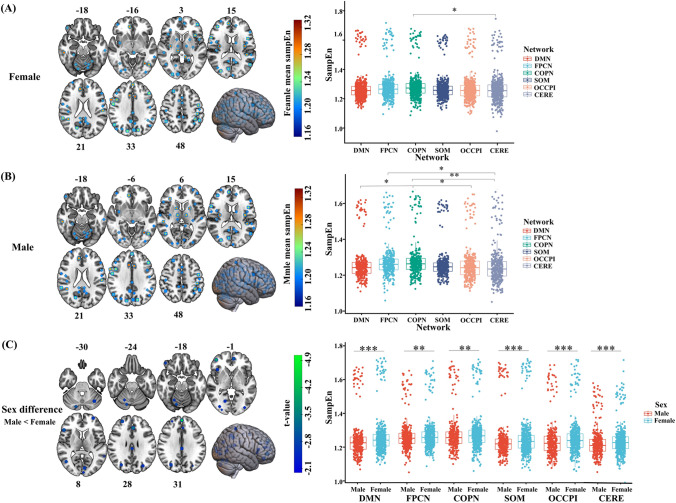
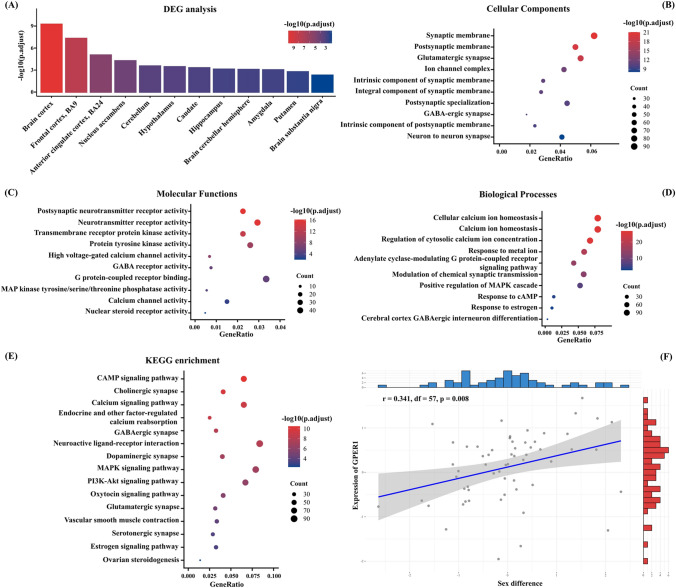
Sex differences in the brain have been widely reported and may hold the key to elucidating sex differences in many medical conditions and drug response. However, the molecular correlates of these sex differences in structural and functional brain measures in the human brain remain unclear. Herein, we used sample entropy (SampEn) to quantify the signal complexity of resting-state functional magnetic resonance imaging (rsfMRI) in a large neuroimaging cohort (N = 1,642). The frontoparietal control network and the cingulo-opercular network had high signal complexity while the cerebellar and sensory motor networks had low signal complexity in both men and women. Compared with those in male brains, we found greater signal complexity in all functional brain networks in female brains with the default mode network exhibiting the largest sex difference. Using the gene expression data in brain tissues, we identified genes that were significantly associated with sex differences in brain signal complexity. The significant genes were enriched in the gene sets that were differentially expressed between the brain cortex and other tissues, the estrogen-signaling pathway, and the biological function of neural plasticity. In particular, the G-protein-coupled estrogen receptor 1 gene in the estrogen-signaling pathway was expressed more in brain regions with greater sex differences in SampEn. In conclusion, greater complexity in female brains may reflect the interactions between sex hormone fluctuations and neuromodulation of estrogen in women.
Supplementary information: The online version contains supplementary material available at 10.1007/s11571-023-09954-y.
Keywords: Default mode network; Estrogen-signaling pathway; Resting-state functional magnetic resonance imaging; Sample entropy; Sex differences.
© The Author(s), under exclusive licence to Springer Nature B.V. 2023. Springer Nature or its licensor (e.g. a society or other partner) holds exclusive rights to this article under a publishing agreement with the author(s) or other rightsholder(s); author self-archiving of the accepted manuscript version of this article is solely governed by the terms of such publishing agreement and applicable law.
Conflict of interest statement
Conflicts of interestThere are no financial conflicts of interest to disclose.
Figures
Similar articles
-
Brain network entropy, depression, and quality of life in people with traumatic brain injury and seizure disorders.Epilepsia Open. 2024 Jun;9(3):969-980. doi: 10.1002/epi4.12926. Epub 2024 Mar 20. Epilepsia Open. 2024. PMID: 38507279 Free PMC article.
-
Temporal complexity of fMRI is reproducible and correlates with higher order cognition.Neuroimage. 2021 Apr 15;230:117760. doi: 10.1016/j.neuroimage.2021.117760. Epub 2021 Jan 22. Neuroimage. 2021. PMID: 33486124
-
Network complexity as a measure of information processing across resting-state networks: evidence from the Human Connectome Project.Front Hum Neurosci. 2014 Jun 10;8:409. doi: 10.3389/fnhum.2014.00409. eCollection 2014. Front Hum Neurosci. 2014. PMID: 24959130 Free PMC article.
-
Reconfiguration of Brain Network Architectures between Resting-State and Complexity-Dependent Cognitive Reasoning.J Neurosci. 2017 Aug 30;37(35):8399-8411. doi: 10.1523/JNEUROSCI.0485-17.2017. Epub 2017 Jul 31. J Neurosci. 2017. PMID: 28760864 Free PMC article.
-
Functional networks and network perturbations in rodents.Neuroimage. 2017 Dec;163:419-436. doi: 10.1016/j.neuroimage.2017.09.038. Epub 2017 Sep 21. Neuroimage. 2017. PMID: 28942060 Review.
References
-
- Alarcón G, Pfeifer JH, Fair DA, Nagel BJ. Adolescent gender differences in cognitive control performance and functional connectivity between default mode and fronto-parietal networks within a self-referential context. Front Behav Neurosci. 2018;12:73–73. doi: 10.3389/fnbeh.2018.00073. - DOI - PMC - PubMed
-
- Ashburner M, Ball CA, Blake JA, Botstein D, Butler H, Cherry JM, Davis AP, Dolinski K, Dwight SS, Eppig JT, Harris MA, Hill DP, Issel-Tarver L, Kasarskis A, Lewis S, Matese JC, Richardson JE, Ringwald M, Rubin GM, Sherlock G. Gene ontology: tool for the unification of biology. Nat Genet. 2000;25(1):25–29. doi: 10.1038/75556. - DOI - PMC - PubMed
LinkOut - more resources
Full Text Sources
