. 2024 May 23;32(6):1063-1078.
doi: 10.32604/or.2024.047078. eCollection 2024.

PHLDA2 reshapes the immune microenvironment and induces drug resistance in hepatocellular carcinoma

Affiliations

PHLDA2 reshapes the immune microenvironment and induces drug resistance in hepatocellular carcinoma

Kun Feng et al. Oncol Res. .

Abstract

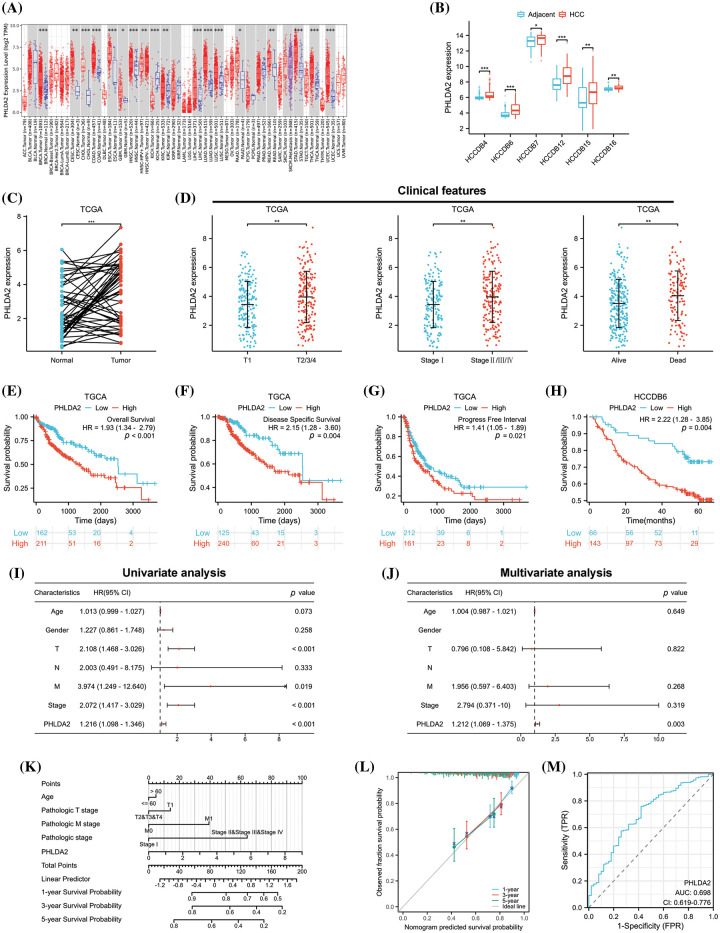
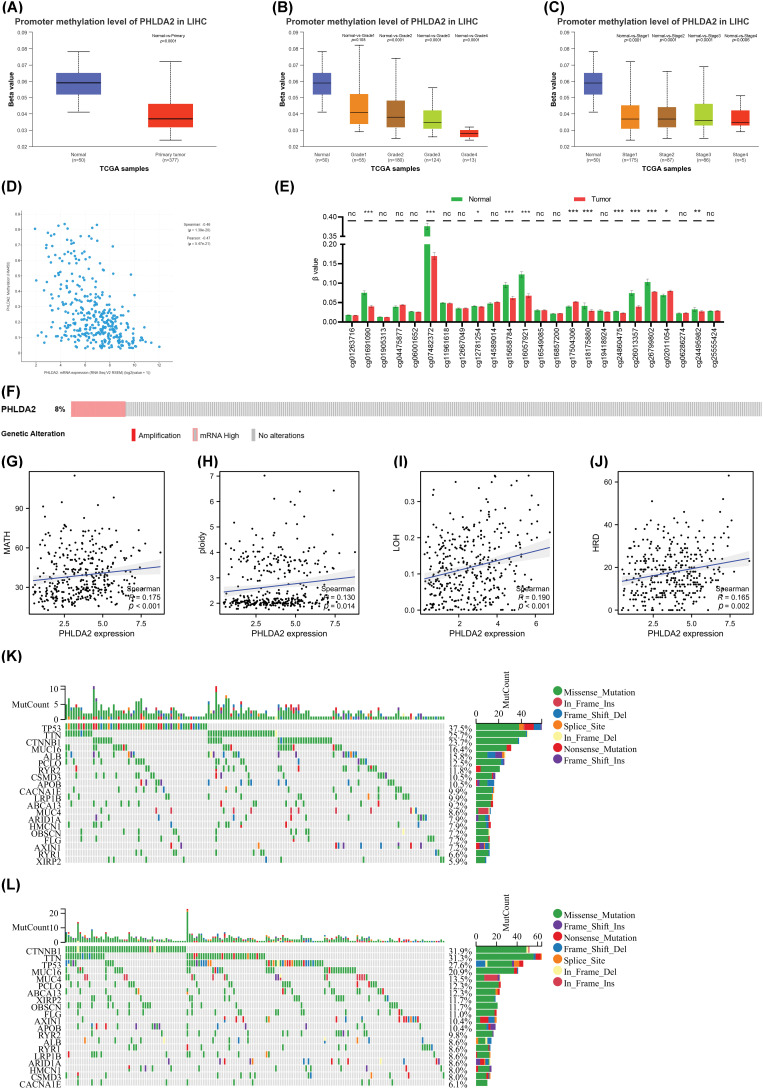
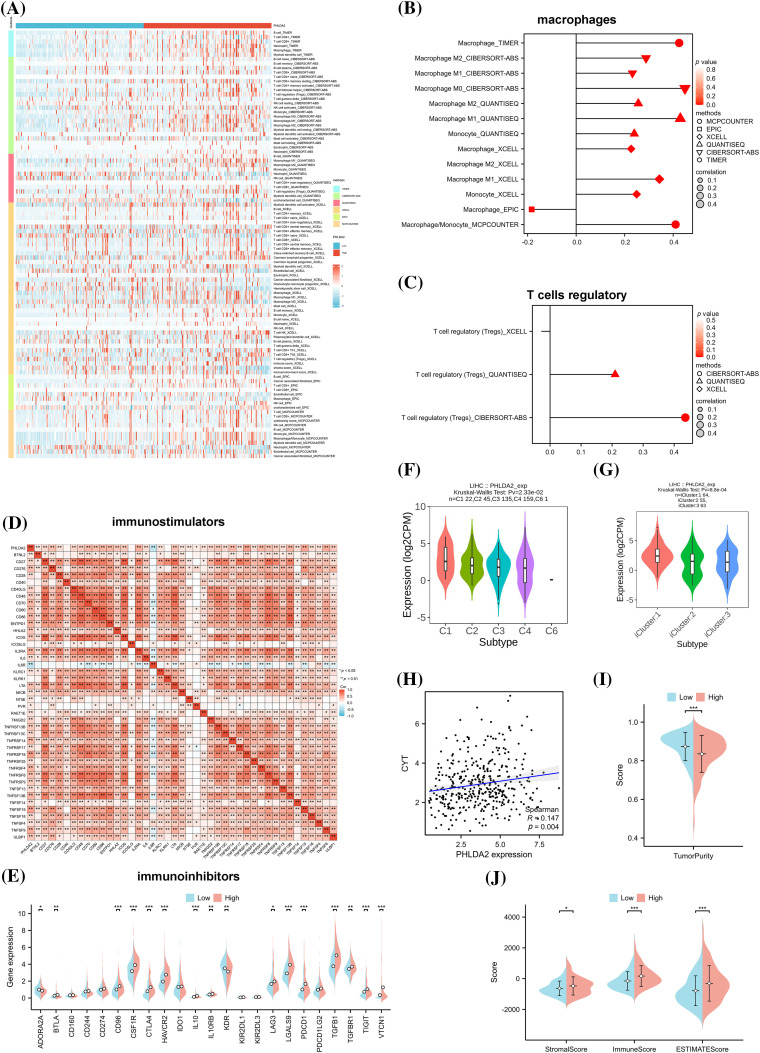
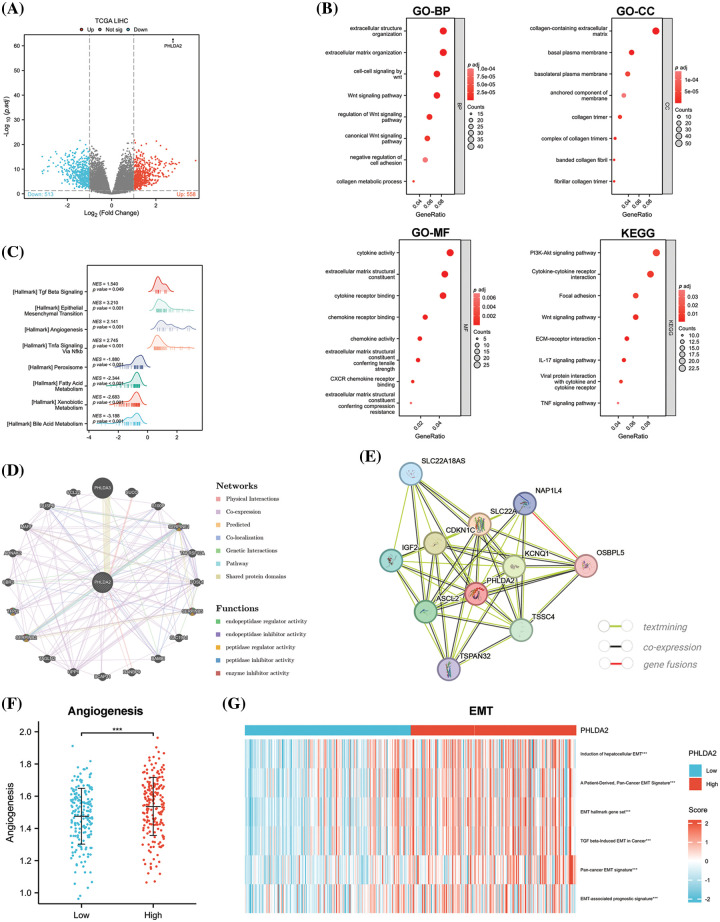
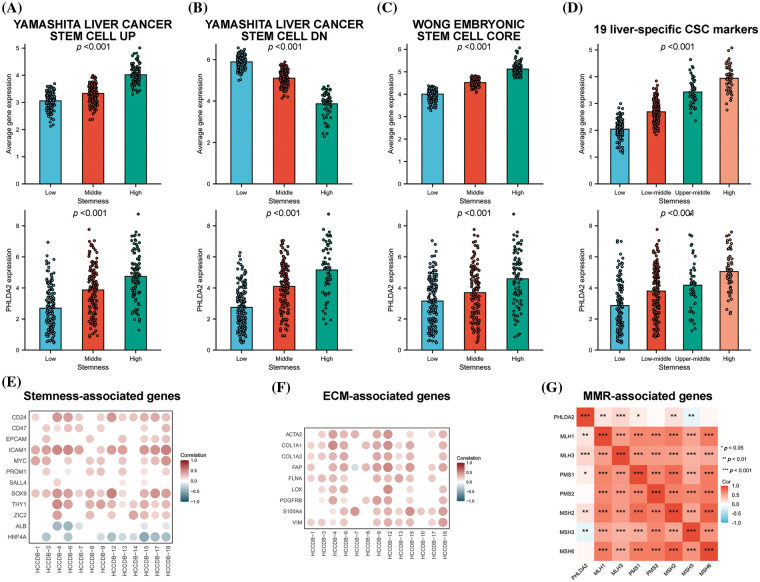
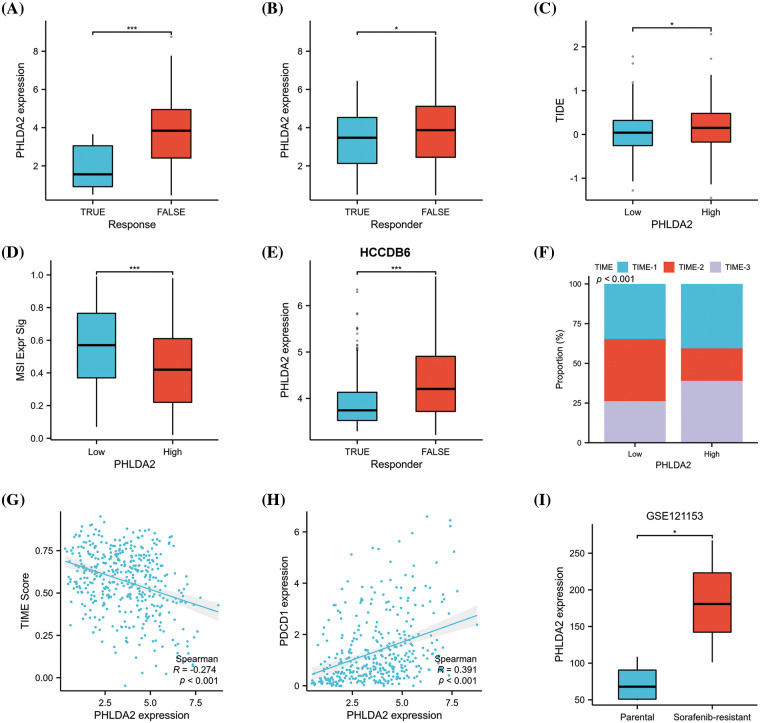
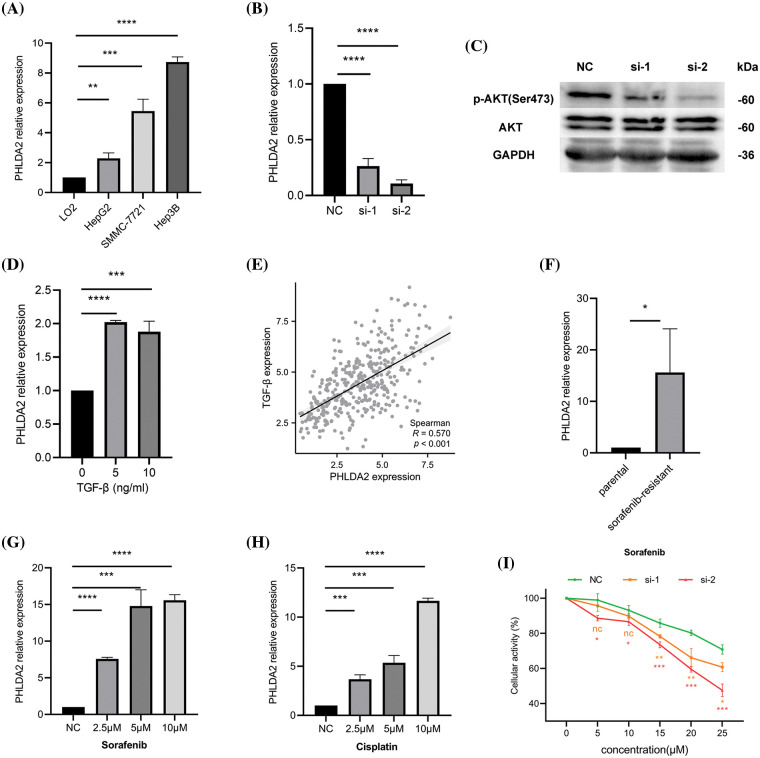
Hepatocellular carcinoma (HCC) is a malignancy known for its unfavorable prognosis. The dysregulation of the tumor microenvironment (TME) can affect the sensitivity to immunotherapy or chemotherapy, leading to treatment failure. The elucidation of PHLDA2's involvement in HCC is imperative, and the clinical value of PHLDA2 is also underestimated. Here, bioinformatics analysis was performed in multiple cohorts to explore the phenotype and mechanism through which PHLDA2 may affect the progression of HCC. Then, the expression and function of PHLDA2 were examined via the qRT-PCR, Western Blot, and MTT assays. Our findings indicate a substantial upregulation of PHLDA2 in HCC, correlated with a poorer prognosis. The methylation levels of PHLDA2 were found to be lower in HCC tissues compared to normal liver tissues. Besides, noteworthy associations were observed between PHLDA2 expression and immune infiltration in HCC. In addition, PHLDA2 upregulation is closely associated with stemness features and immunotherapy or chemotherapy resistance in HCC. In vitro experiments showed that sorafenib or cisplatin significantly up-regulated PHLDA2 mRNA levels, and PHLDA2 knockdown markedly decreased the sensitivity of HCC cells to chemotherapy drugs. Meanwhile, we found that TGF-β induced the expression of PHLDA2 in vitro. The GSEA and in vitro experiment indicated that PHLDA2 may promote the HCC progression via activating the AKT signaling pathway. Our study revealed the novel role of PHLDA2 as an independent prognostic factor, which plays an essential role in TME remodeling and treatment resistance in HCC.

Keywords: Drug resistance; HCC; Immune infiltration; PHLDA2; TME.


Conflict of interest statement

The authors declare that they have no conflicts of interest to report regarding the present study.

Figures

Figure 1
Figure 1. The expression and prognostic value of PHLDA2 in HCC. (A) The expression of PHLDA2 in various malignant tumors and normal tissues in the TIMER2.0. (B) The expression of PHLDA2 in HCC and liver tissues from the HCCDB. (C) PHLDA2 expression in HCC compared to adjacent liver tissues in the TCGA. (D) The relationships between PHLDA2 and clinical characteristics in HCC, including T stage, stage, and status. (E–H) Kaplan–Meier analysis for PHLDA2 in the TCGA and HCCDB-6 cohorts. (I, J) The forest plot for univariate and multivariate analysis of PHLDA2 and clinical features for OS from the TCGA. (K) The nomogram plot based on PHLDA2 and clinicopathological factors for OS. (L) The calibration plot for nomogram validation. (M) The diagnostic ROC curve for PHLDA2. *p < 0.05; **p < 0.01; ***p < 0.001.
Figure 2
Figure 2. Analysis of methylation and genetic heterogenicity in HCC. (A) The promoter methylation level of PHLDA2 in HCC from the UALCAN. (B, C) The promoter methylation of PHLDA2 in HCC of various tumor stages and tumor grade by the UALCAN. (D) The relationship between the PHLDA2 and methylation in the cBioPortal. (E) The methylation of CpG islands in the PHLDA2 promoter region from the TCGA. (F) The genomic alterations of PHLDA2 in TCGA-LIHC from the cBioPortal. (G–J) The correlations between the PHLDA2 and MATH, ploidy, LOH, and HRD. (K, L) The somatic landscape of HCC in PHLDA2-low and PHLDA2-high subgroups. *p < 0.05; **p < 0.01; ***p < 0.001.
Figure 3
Figure 3. Correlation of PHLDA2 with immune infiltration in HCC. (A) The heat map of immune cell infiltration in PHLDA2-low and PHLDA2-high subgroups by the TIMER. (B, C) The lollipop graph showed the correlation between the PHLDA2, macrophages, and Tregs. (D) The Spearman correlation among PHLDA2 and several immunostimulators. (E) The expression of immunoinhibitors between PHLDA2-low and PHLDA2-high subgroup. (F, G) PHLDA2 expression in different immune subtypes and molecular subtypes from the TISIDB. (H) The correlation between CYT and the PHLDA2. (I) The violin plot showed the Tumor Purity in the PHLDA2-low and PHLDA2-high subgroups. (J) The StromalScore, ImmuneScore, and EstimateScore in PHLDA2-low and PHLDA2-high subgroup by ESTIMATE. *p < 0.05; **p < 0.01; ***p < 0.001.
Figure 4
Figure 4. PHLDA2-related genes and functional enrichment analysis. (A) The enhanced volcano plot of differential genes between PHLDA2-high and PHLDA2-low subgroups. (B) Functional enrichment analysis by GO and KEGG. BP, Biological Process; CC, Cellular Component; MF, Molecular Function. (C) GSEA analysis of Hallmark gene set. (D, E) The protein-protein interaction networks of PHLDA2 from the Gene MANIA and STRING database. (F) Angiogenesis score between PHLDA2-high and PHLDA2-low subgroup. (G) The heat map of the EMT signature is in the PHLDA2-high and PHLDA2-low subgroups. ***p < 0.001.
Figure 5
Figure 5. PHLDA2 is related to stemness characteristics. (A–D) The average expression level of the gene set and PHLDA2 in subgroups identified by the YAMASHITA UP gene set (A), the YAMASHITA DN gene set (B), the WONG CORE gene set (C), and 19 liver CSC markers (D). (E, F) The correlations between the PHLDA2 expression and stem-related genes (E) and ECM-relative genes (F) expression in the HCCDB database. (G) The correlation heat map of PHLDA2 and MMR-related gene expression. *p < 0.05; **p < 0.01; ***p < 0.001.
Figure 6
Figure 6. PHLDA2 could predict the clinical benefits of immunotherapy and chemotherapy. (A, B) PHLDA2 expression between responder or non-responder patients according to the ImmuCellAI (A) or TIDE (B) algorithm in the TCGA cohort. (C) The TIDE score is between the PHLDA2-low and PHLDA2-high subgroups. (D) The MSI signature score between the PHLDA2-low and PHLDA2-high subgroup. (E) PHLDA2 expression between responder or non-responder patients according to the TIDE algorithm in the HCCDB6 cohort. (F) The distribution of TIME subtypes in the PHLDA2-low and PHLDA2-high subgroups. (G) The scatter plot showed the correlation between the TIME score and the PHLDA2 expression. (H) The correlations between the PHLDA2 and PDCD1. (I) The PHLDA2 expression between parental and sorafenib-resistant group from the GSE121153. *p < 0.05; ***p < 0.001.
Figure 7
Figure 7. Relevant experimental verification. (A) The expression of PHLDA2 in different cell lines, including LO2, HepG2, SMMC-7721, and Hep3B. (B) qRT-PCR results showed that PHLDA2 had knockdown efficiency after transfection of Hep3B cells with two different siRNAs. (C) WB results revealed p-AKT, AKT, and GAPDH protein expression levels in the NC, si-1, and si-2 groups. (D) The expression of PHLDA2 in Hep3B cells treated with different concentrations of TGF-β. (E) The scatter plot showed the correlation between PHLDA2 and TGF-β in the TCGA database. (F) The expression of PHLDA2 in sorafenib-resistant and parental groups. (G, H) The expression of PHLDA2 in Hep3B cells treated with different sorafenib (G) and cisplatin (H) concentrations. (I) The MTT assay showed the viability of the Hep3B cells after 48 h in gradient doses of sorafenib. *p < 0.05; **p < 0.01; ***p < 0.001; ****p < 0.0001.

Similar articles

References

    1. Holczbauer, A., Wangensteen, K. J., Shin, S. (2022). Cellular origins of regenerating liver and hepatocellular carcinoma. JHEP Reports , 4(4), 100416. 10.1016/j.jhepr.2021.100416; - DOI - PMC - PubMed
    1. Hua, Y., Dong, J., Hong, J., Wang, B., Yan, Y.et al. (2022). Clinical applications of circulating tumor cells in hepatocellular carcinoma. Frontiers in Oncology , 12, 968591. 10.3389/fonc.2022.968591; - DOI - PMC - PubMed
    1. Bray, F., Ferlay, J., Soerjomataram, I., Siegel, R. L., Torre, L. A.et al. (2018). Global cancer statistics 2018: GLOBOCAN estimates of incidence and mortality worldwide for 36 cancers in 185 countries. CA: A Cancer Journal for Clinicians , 68(6), 394–424; - PubMed
    1. Kim, H. I., An, J., Kim, J. Y., Shin, H. P., Park, S. Y.et al. (2022). Postresection period-specific hazard of recurrence as a framework for surveillance strategy in patients with hepatocellular carcinoma: A multicenter outcome study. Liver Cancer , 11(2), 141–151. 10.1159/000518837; - DOI - PMC - PubMed
    1. Reig, M., Forner, A., Rimola, J., Ferrer-Fabrega, J., Burrel, M.et al. (2022). BCLC strategy for prognosis prediction and treatment recommendation: The 2022 update. Journal of Hepatology , 76(3), 681–693. 10.1016/j.jhep.2021.11.018; - DOI - PMC - PubMed

MeSH terms