

Structural Elucidation and Relative Quantification of Fatty Acid Double Bond Positional Isomers in Biological Tissues Enabled by Gas-Phase Charge Inversion Ion/Ion Reactions
- PMID: 38827423
- PMCID: PMC11139046
- DOI: 10.1002/anse.202300063
Structural Elucidation and Relative Quantification of Fatty Acid Double Bond Positional Isomers in Biological Tissues Enabled by Gas-Phase Charge Inversion Ion/Ion Reactions
Abstract
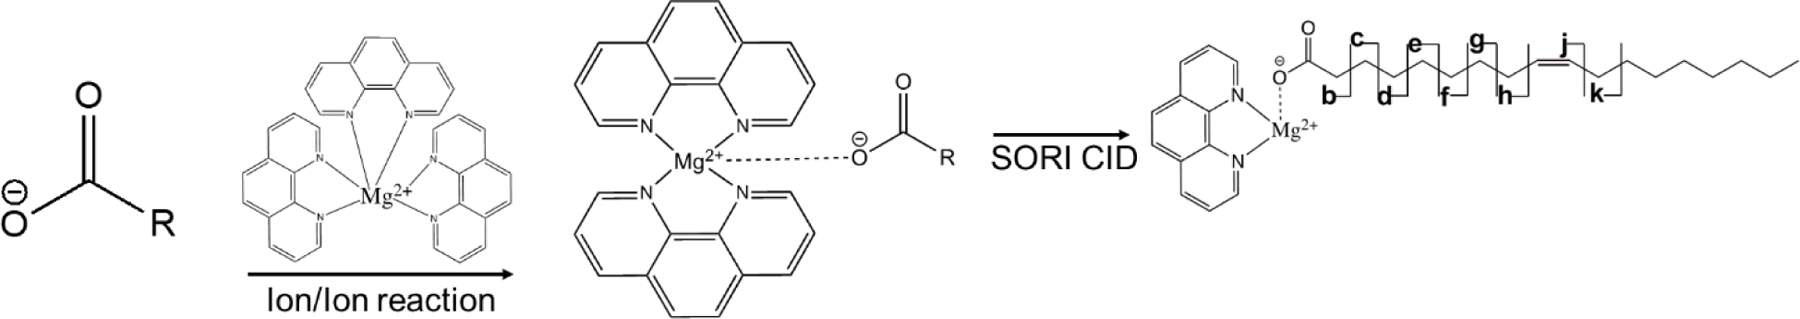
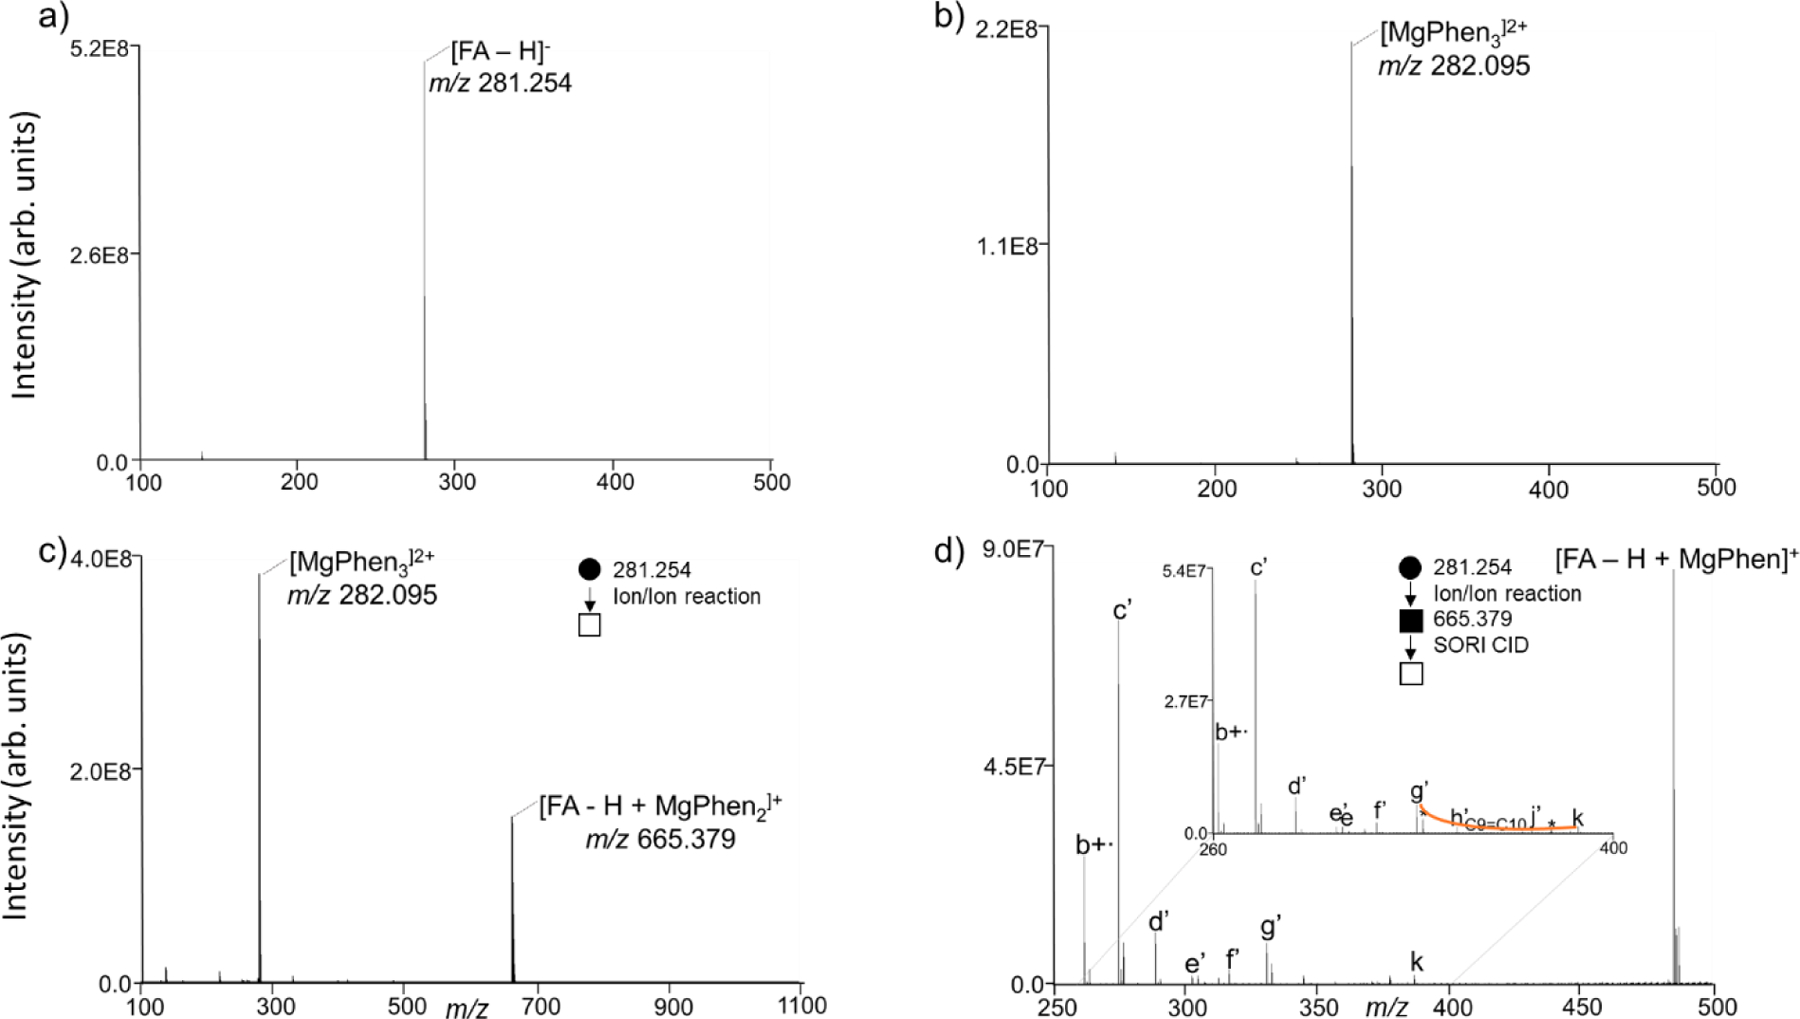
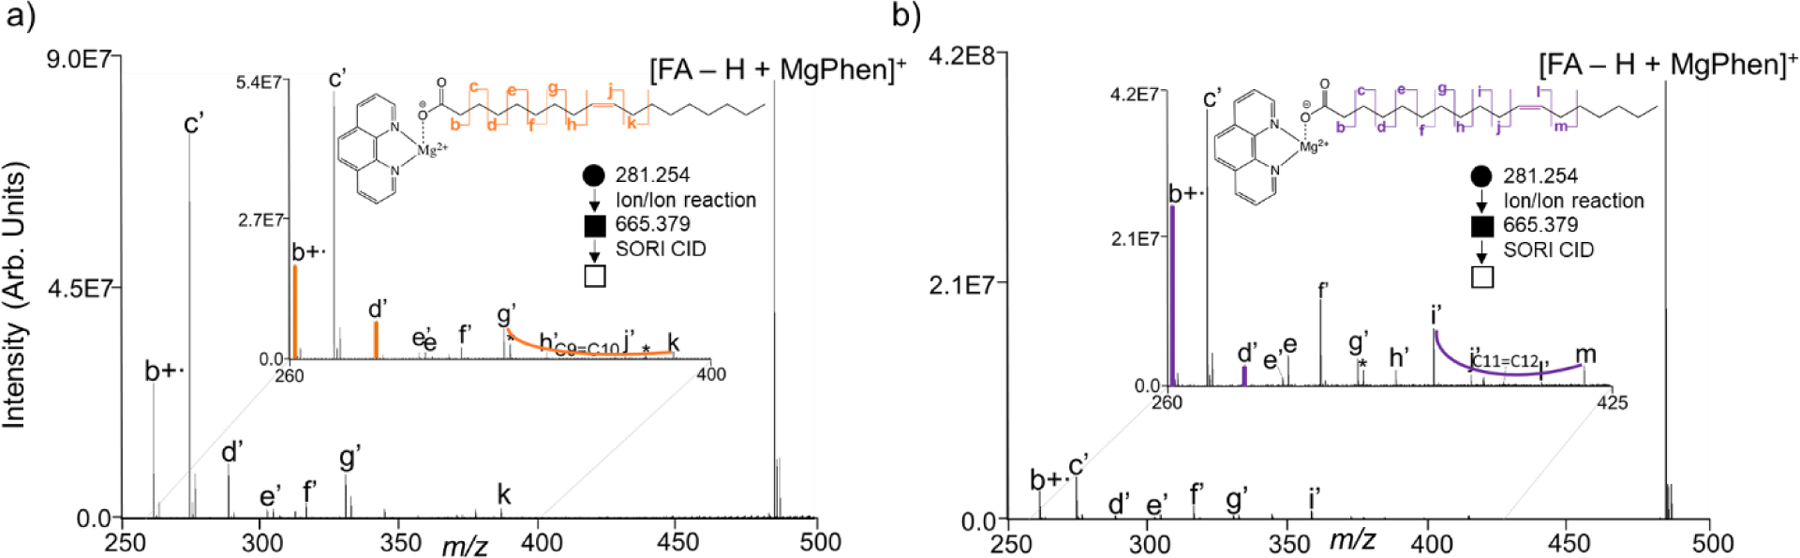
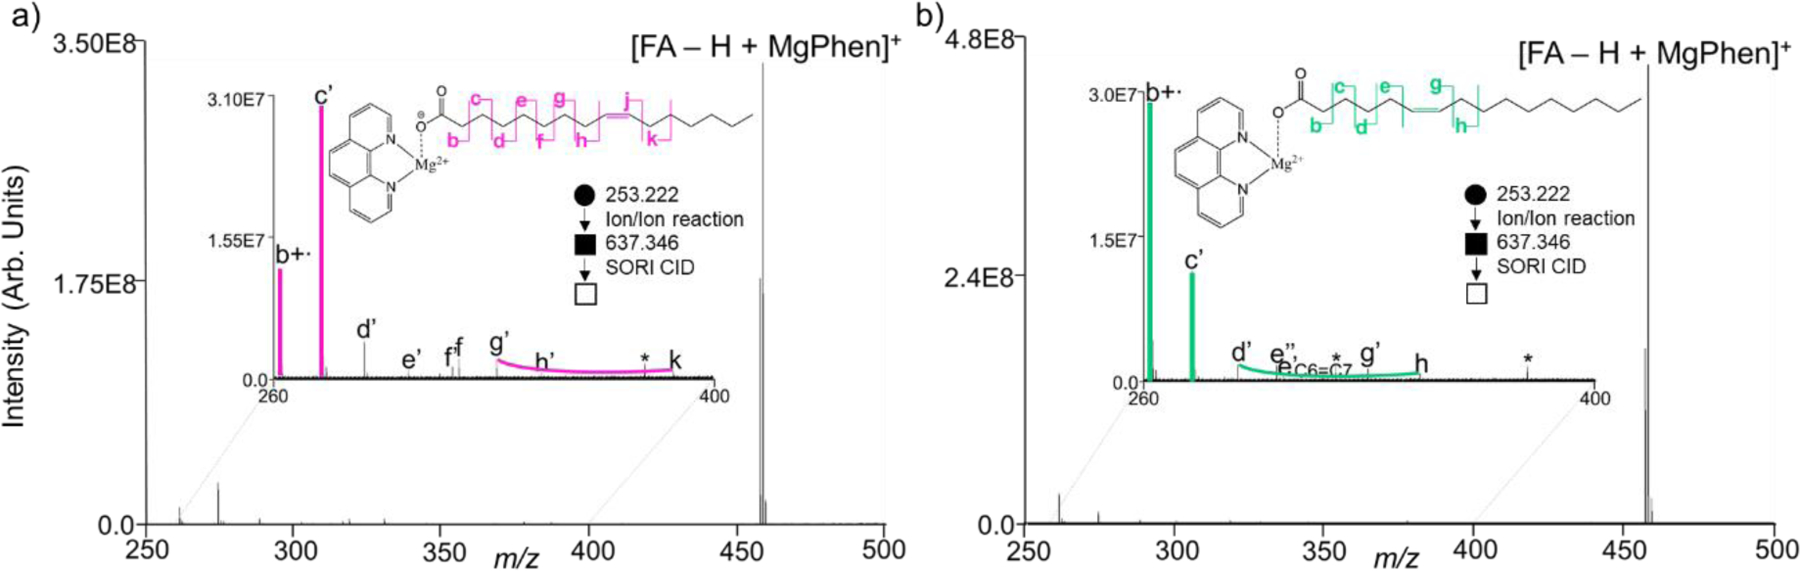
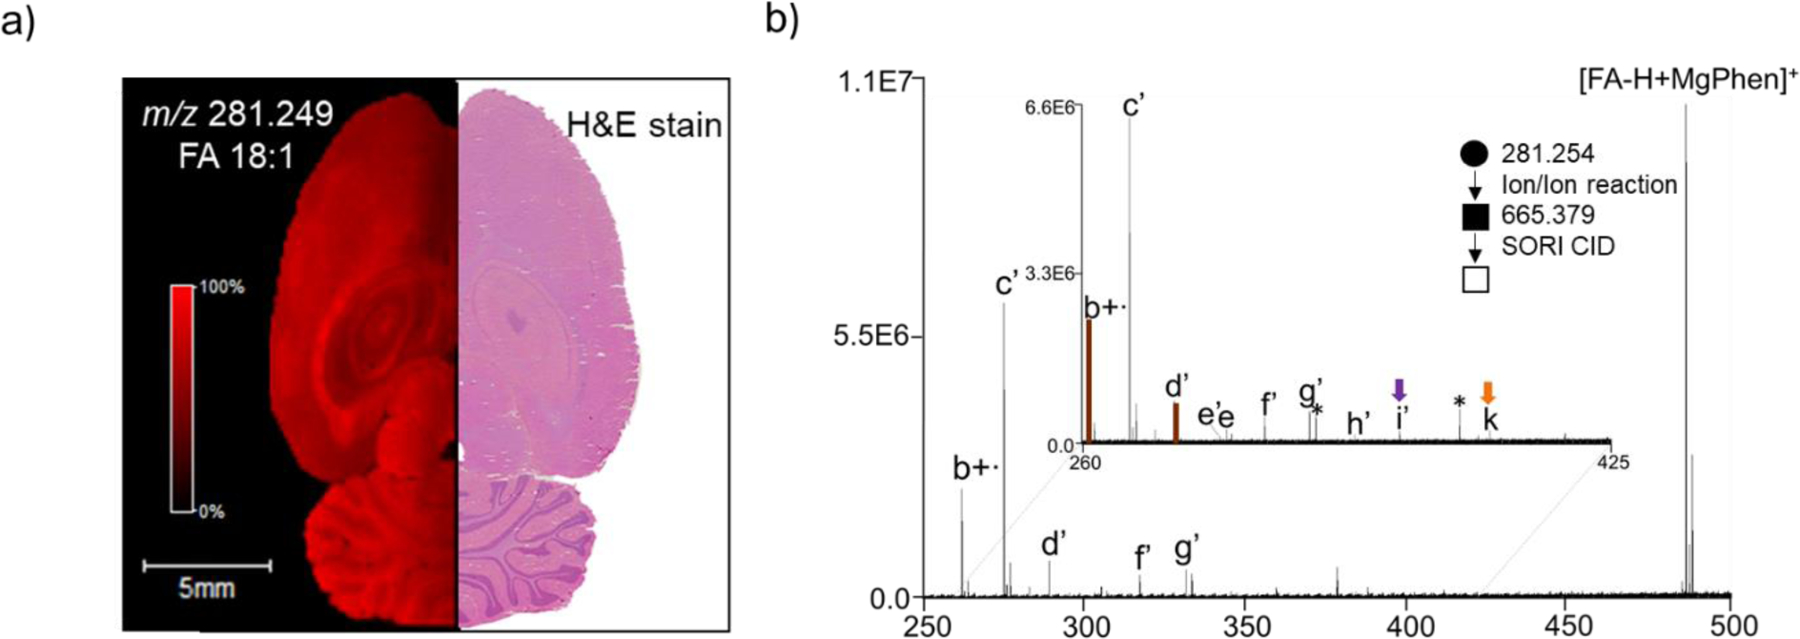
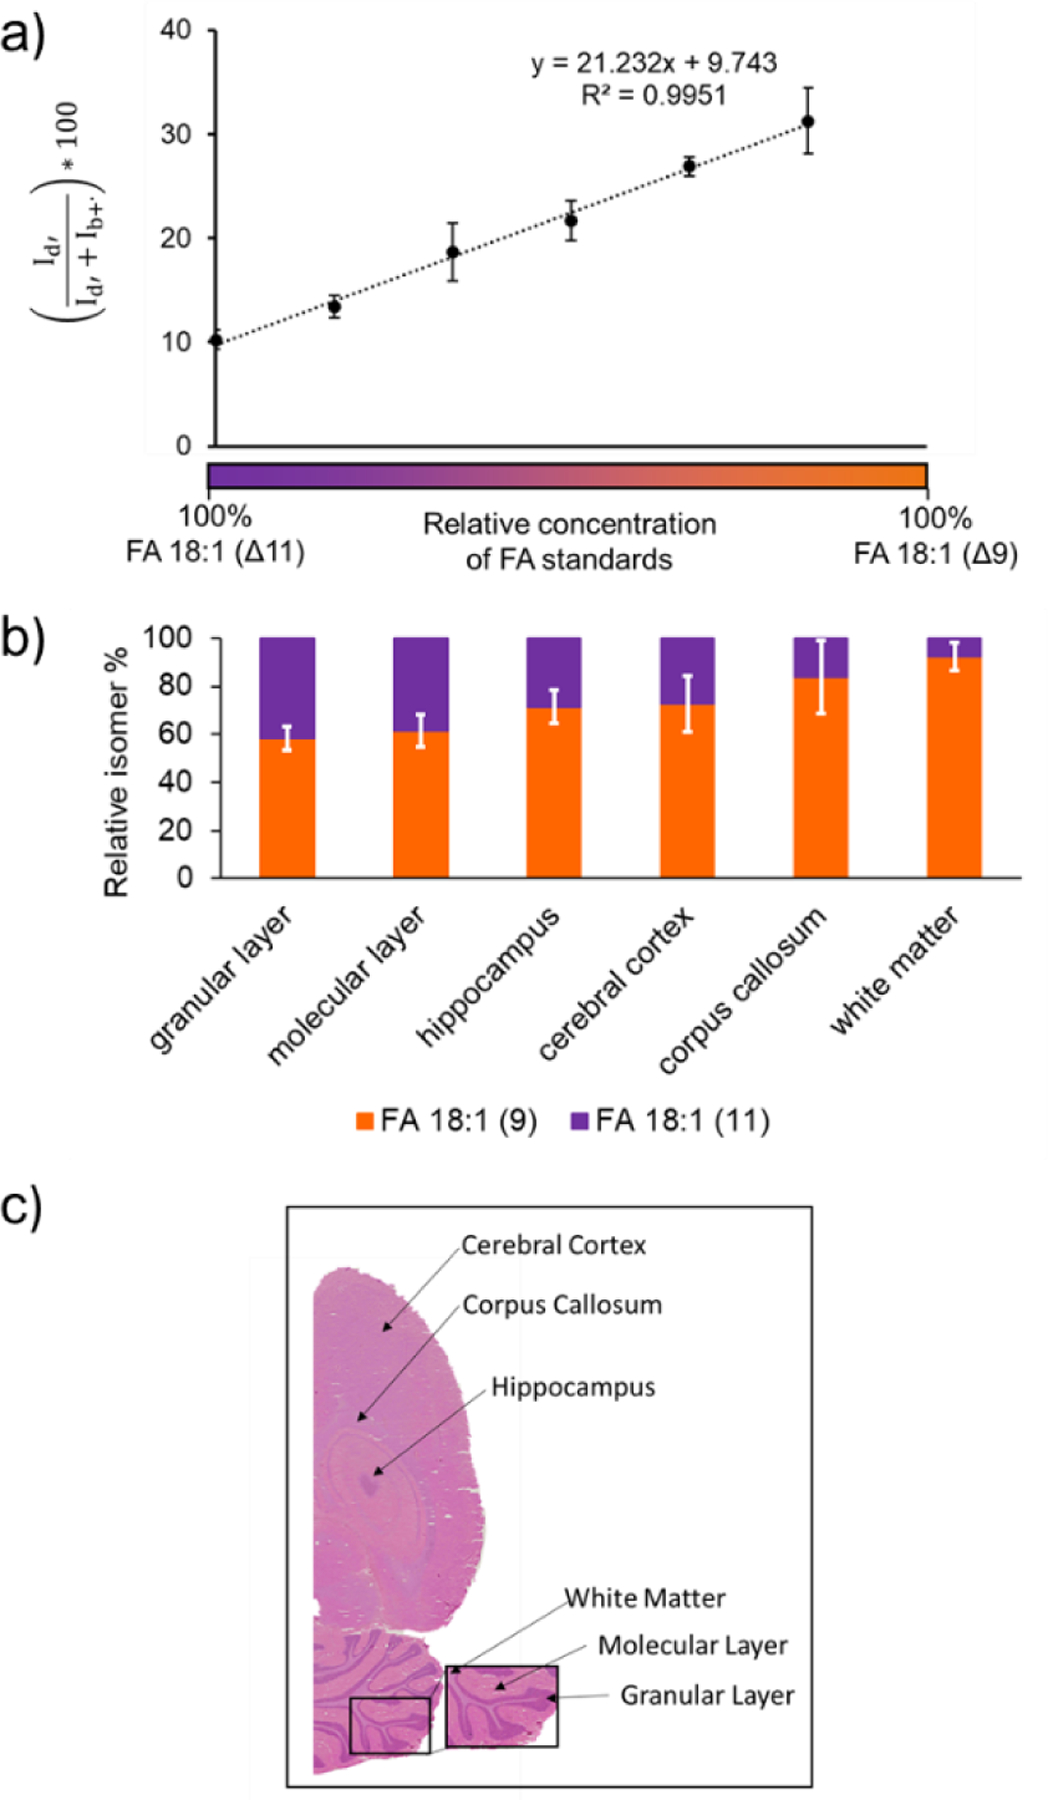
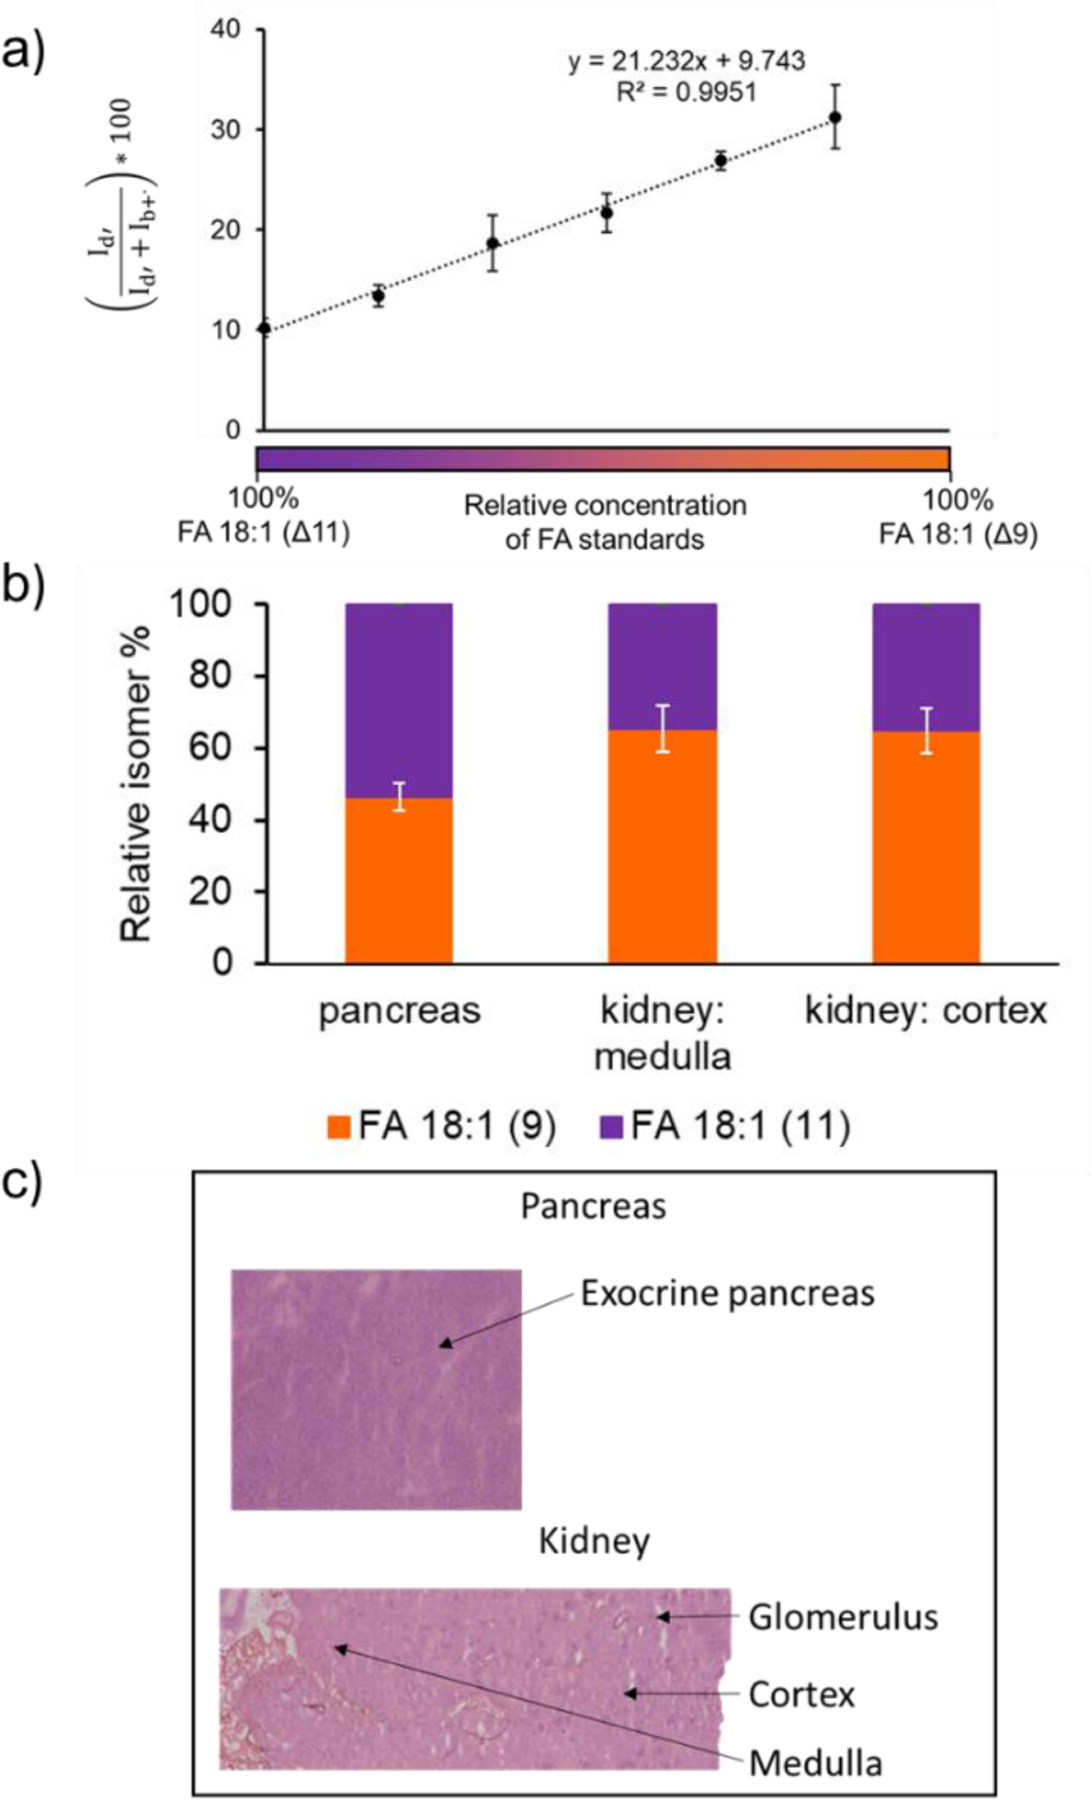
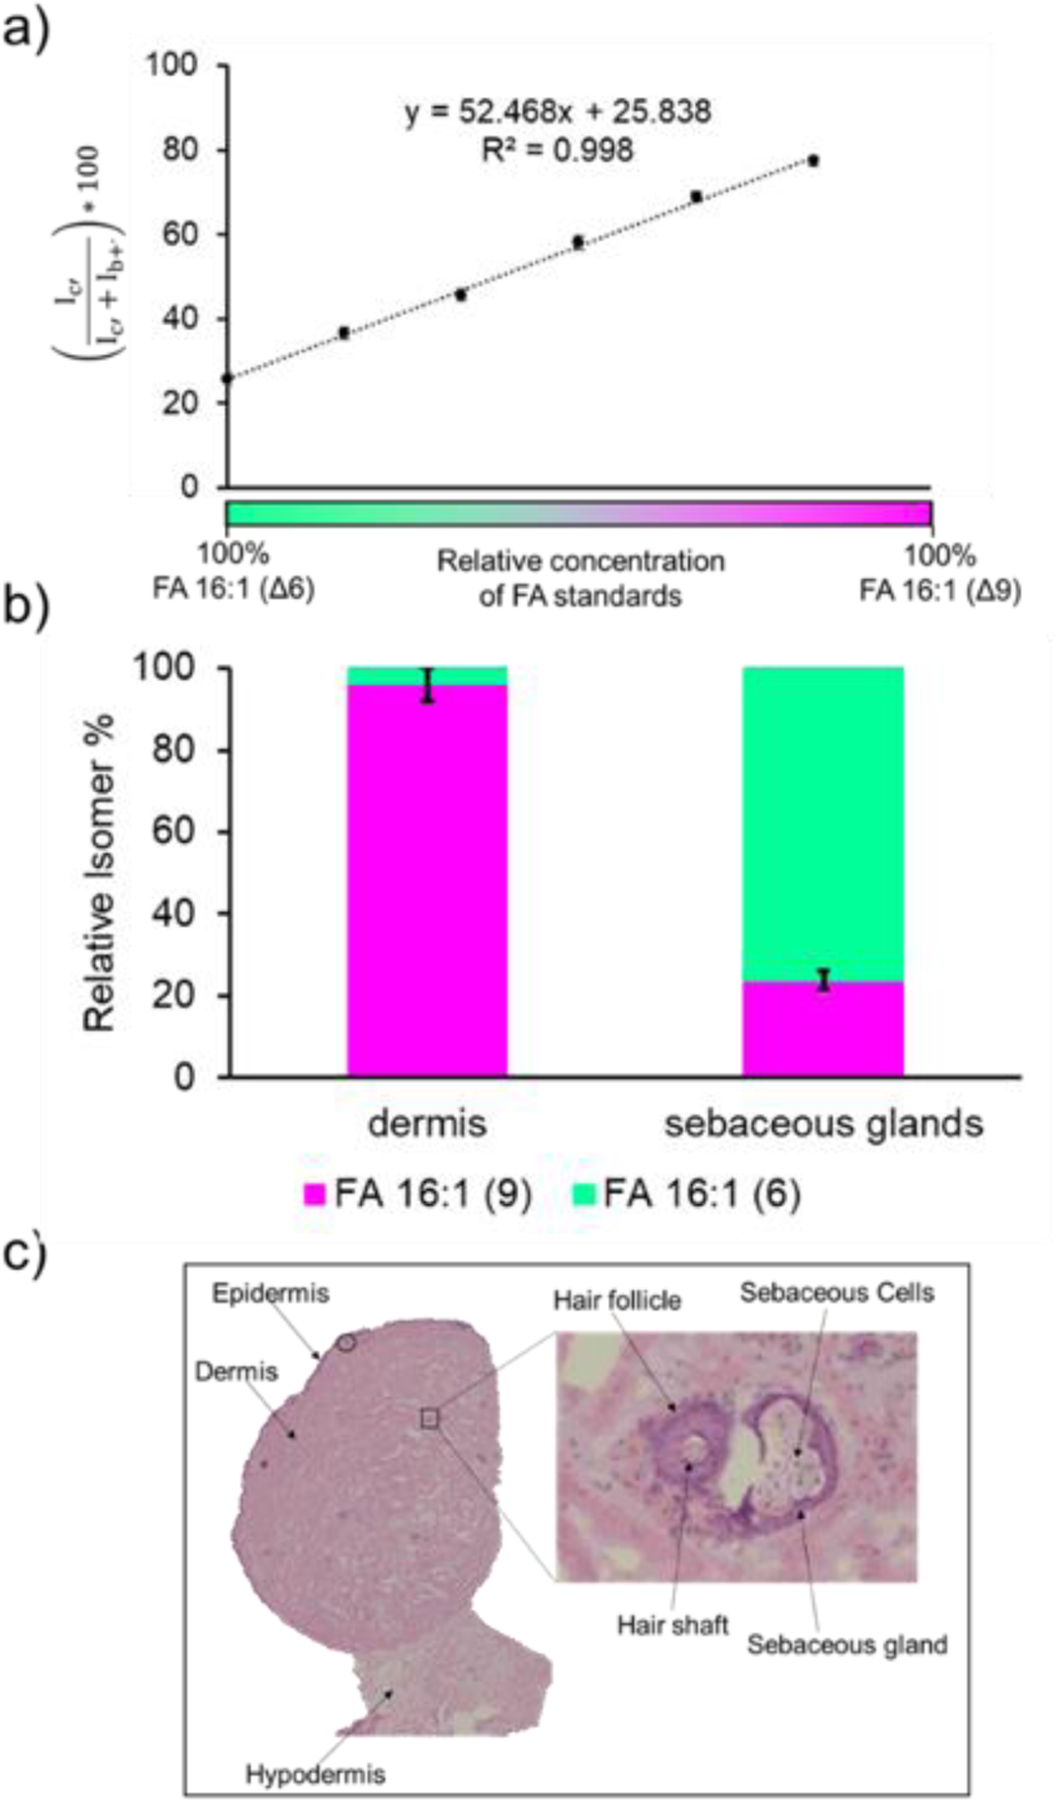
Fatty acids (FAs) contain a vast amount of structural diversity, and differences in fatty acid structure have been associated with various disease states. Accurate identification and characterization of fatty acids is critical to fully understand the biochemical roles these compounds play in disease progression. Conventional tandem mass spectrometry (MS/MS) workflows do not provide sufficient structural information, necessitating alternative dissociation methods. Gas-phase charge inversion ion/ion reactions can be used to alter the ion type subjected to activation to provide improved or complementary structural information. Herein, we have used an ion/ion reaction between fatty acid (FA) anions and magnesium tris-phenanthroline [Mg(Phen)3] dications to promote charge remote fragmentation of carbon-carbon bonds along the fatty acid chain, allowing for localization of carbon-carbon double bond (C=C) positions to successfully differentiate monounsaturated fatty acid isomers. Relative quantification was also performed to obtain the relative abundance of fatty acid isomers in different biological tissues. For example, the relative abundance of FA 18:1 (9) was determined to vary across regions of rat brain, rat kidney, and mouse pancreas, and FA 16:1 (9) was found to have a higher relative abundance in the dermis layer compared to the sebaceous glands in human skin tissue.
Keywords: double bond; fatty acids; imaging mass spectrometry; ion/ion reactions; positional isomers.
Figures
Similar articles
-
Gas-Phase Ion/Ion Reactions Involving Tris-Phenanthroline Alkaline Earth Metal Complexes as Charge Inversion Reagents for the Identification of Fatty Acids.Anal Chem. 2018 Nov 6;90(21):12861-12869. doi: 10.1021/acs.analchem.8b03441. Epub 2018 Oct 11. Anal Chem. 2018. PMID: 30260210 Free PMC article.
-
Generating Fatty Acid Profiles in the Gas Phase: Fatty Acid Identification and Relative Quantitation Using Ion/Ion Charge Inversion Chemistry.Anal Chem. 2019 Jul 16;91(14):9032-9040. doi: 10.1021/acs.analchem.9b01333. Epub 2019 Jun 26. Anal Chem. 2019. PMID: 31199126 Free PMC article.
-
Localization of Carbon-Carbon Double Bond and Cyclopropane Sites in Cardiolipins via Gas-Phase Charge Inversion Reactions.J Am Soc Mass Spectrom. 2021 Feb 3;32(2):455-464. doi: 10.1021/jasms.0c00348. Epub 2020 Dec 28. J Am Soc Mass Spectrom. 2021. PMID: 33370110 Free PMC article.
-
Fatty acid isomerism: analysis and selected biological functions.Food Funct. 2024 Feb 5;15(3):1071-1088. doi: 10.1039/d3fo03716a. Food Funct. 2024. PMID: 38197562 Review.
-
Integrating the potential of ion mobility spectrometry-mass spectrometry in the separation and structural characterisation of lipid isomers.Front Mol Biosci. 2023 Mar 16;10:1112521. doi: 10.3389/fmolb.2023.1112521. eCollection 2023. Front Mol Biosci. 2023. PMID: 37006618 Free PMC article. Review.
Cited by
-
Imaging Mass Spectrometry of Sulfatide Isomers from Rat Brain Tissue Using Gas-Phase Charge Inversion Ion/Ion Reactions.J Am Soc Mass Spectrom. 2025 Jan 1;36(1):119-126. doi: 10.1021/jasms.4c00368. Epub 2024 Nov 25. J Am Soc Mass Spectrom. 2025. PMID: 39587395
-
Dual fragmentation via collision-induced and oxygen attachment dissociations using water and its radicals for C=C position-resolved lipidomics.Commun Chem. 2025 May 13;8(1):148. doi: 10.1038/s42004-025-01525-y. Commun Chem. 2025. PMID: 40360765 Free PMC article.
-
OzMALDI: A Gas-Phase, In-Source Ozonolysis Reaction for Efficient Double-Bond Assignment in Mass Spectrometry Imaging with Matrix-Assisted Laser Desorption/Ionization.Anal Chem. 2025 Apr 8;97(13):7447-7455. doi: 10.1021/acs.analchem.5c00284. Epub 2025 Mar 31. Anal Chem. 2025. PMID: 40162600 Free PMC article.
-
An Analytical Evaluation of Tools for Lipid Isomer Differentiation in Imaging Mass Spectrometry.Int J Mass Spectrom. 2024 Aug;502:117268. doi: 10.1016/j.ijms.2024.117268. Epub 2024 May 26. Int J Mass Spectrom. 2024. PMID: 40766833 Free PMC article.
-
Spatial mapping of phosphatidylcholine sn-positional isomers using CID of divalent metal complexes in imaging mass spectrometry.Int J Mass Spectrom. 2025 Feb;508:117370. doi: 10.1016/j.ijms.2024.117370. Epub 2024 Nov 22. Int J Mass Spectrom. 2025. PMID: 40778296
Grants and funding
LinkOut - more resources
Full Text Sources
Research Materials
Miscellaneous