. 2024 May 22;28(1):292.
doi: 10.3892/etm.2024.12581. eCollection 2024 Jul.

Analysis of gene expression in microglial apoptotic cell clearance following spinal cord injury based on machine learning algorithms

Affiliations

Analysis of gene expression in microglial apoptotic cell clearance following spinal cord injury based on machine learning algorithms

Lei Yan et al. Exp Ther Med. .

Abstract

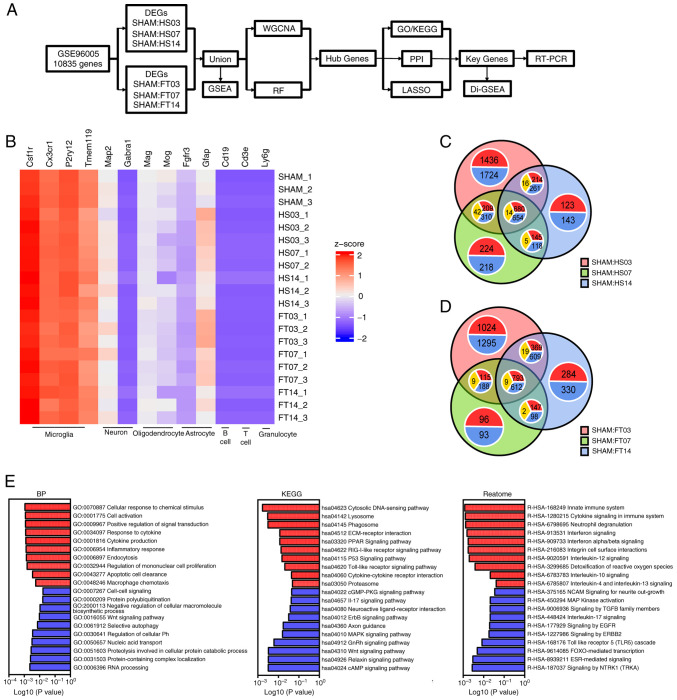
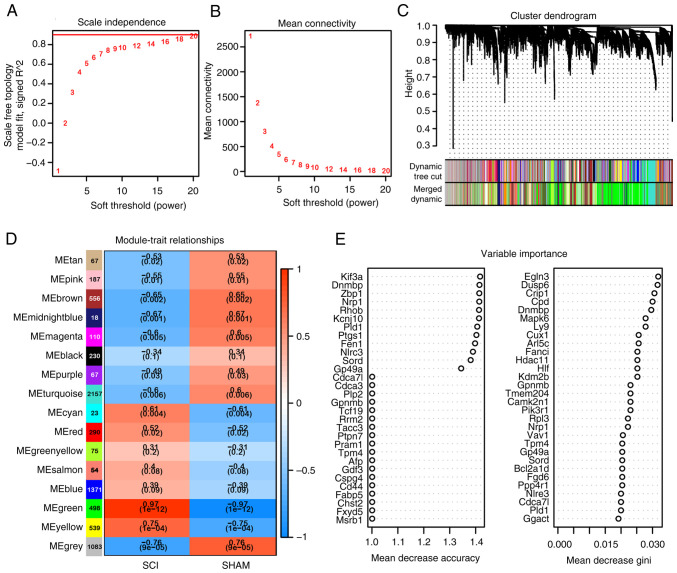
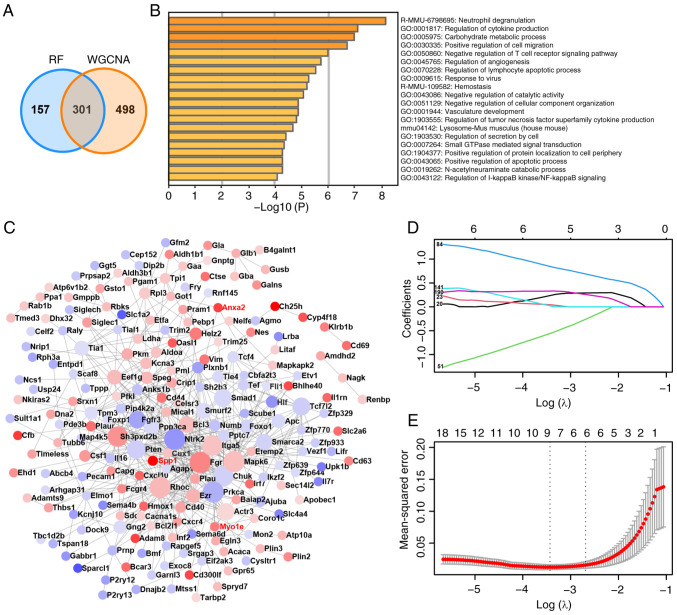
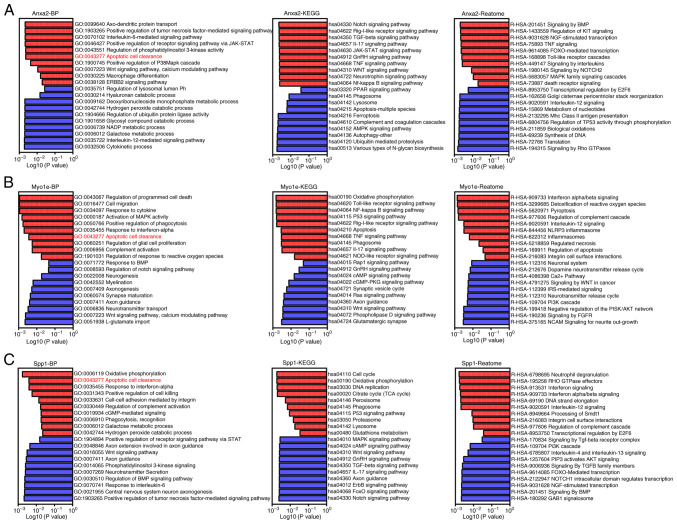
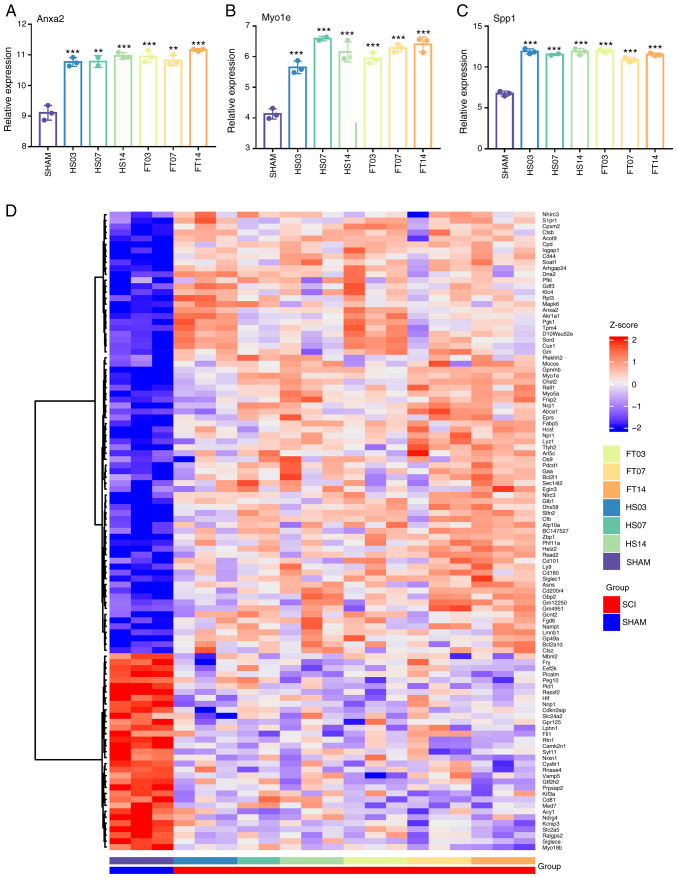
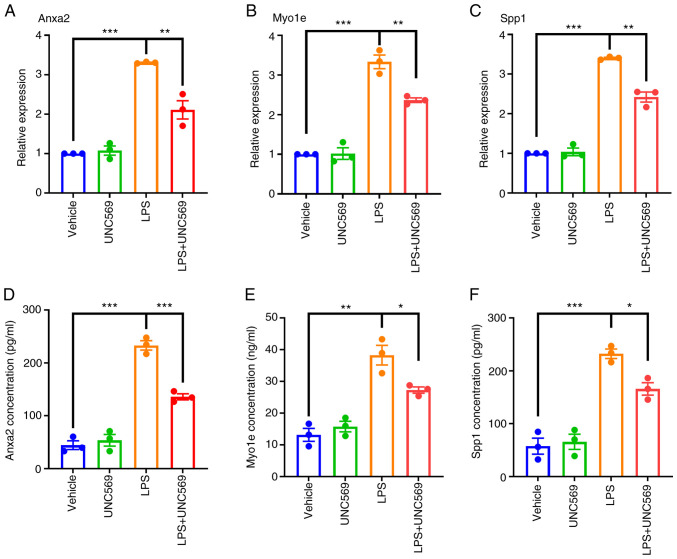
Spinal cord injury (SCI) is a severe neurological complication following spinal fracture, which has long posed a challenge for clinicians. Microglia play a dual role in the pathophysiological process after SCI, both beneficial and detrimental. The underlying mechanisms of microglial actions following SCI require further exploration. The present study combined three different machine learning algorithms, namely weighted gene co-expression network analysis, random forest analysis and least absolute shrinkage and selection operator analysis, to screen for differentially expressed genes in the GSE96055 microglia dataset after SCI. It then used protein-protein interaction networks and gene set enrichment analysis with single genes to investigate the key genes and signaling pathways involved in microglial function following SCI. The results indicated that microglia not only participate in neuroinflammation but also serve a significant role in the clearance mechanism of apoptotic cells following SCI. Notably, bioinformatics analysis and lipopolysaccharide + UNC569 (a MerTK-specific inhibitor) stimulation of BV2 cell experiments showed that the expression levels of Anxa2, Myo1e and Spp1 in microglia were significantly upregulated following SCI, thus potentially involved in regulating the clearance mechanism of apoptotic cells. The present study suggested that Anxa2, Myo1e and Spp1 may serve as potential targets for the future treatment of SCI and provided a theoretical basis for the development of new methods and drugs for treating SCI.

Keywords: apoptotic cells; bioinformatics; least absolute shrinkage and selection operator analysis; machine learning; microglia; protein-protein interaction; random forest analysis; spinal cord injury; weighted gene co-expression network analysis.


Conflict of interest statement

The authors declare that they have no competing interests.

Figures

Figure 1
Figure 1
Identification of DEGs. (A) Research roadmap. (B) Heat map of relative expression levels of various cellular markers for 20 samples in the data set, with the deepest blue representing 0. Venn diagram of DEGs between the SHAM operation group and at 3, 7 and 14 days after SCI of the (C) HS and the (D) FT, respectively. In each annotation circle, red represented the number of upregulated genes, blue represented the number of downregulated genes and yellow represented the number of genes with the opposite trend in the intersection set. (E) BP, KEGG and Reactome analysis in GSEA between the SHAM and the SCI group. DEGs, differentially expressed genes; SCI, spinal cord injury; HS, hemiparaplegia injury group; FT, complete paraplegia injury group; BP, biological process; KEGG, Kyoto Encyclopedia of Genes and Genomes; GSEA, Gene Set Enrichment Analysis; WGCNA, weighted correlation network analysis; RF, random forest; PPI, protein-protein interaction network; RT-PCR, reverse transcription-quantitative PCR.
Figure 2
Figure 2
WGCNA and RF of DEGs. (A) Scale independence. (B) Mean connectivity. The network topology analysis for adjacency matrix with different soft threshold power. Red numbers in the boxes indicate the soft thresholding power corresponding to the correlation coefficient square value (y-axis). (C) Consensus module dendrogram was produced by 7,340 DEGs with a variation coefficient of expression >0.1, based on the criteria of correlation coefficient square of eigengenes above 0.90, soft threshold power of 18, the number of genes >10 and cut height=0.90. (D) Module-trait associations. Each row corresponds to a module trait gene and each column corresponds to a trait. Red indicated a positive correlation between modular trait genes and traits and blue indicated a negative correlation. Each cell contains correlation coefficient ρ and the P-value in parentheses. (E) Two calculation methods of DEGs related to SCI for random forest screening. Mean decrease accuracy: The reducing degree of the accuracy of the random forest prediction by changing the value of a variable into a random number. A larger value indicates that the variable is more significant. Mean decrease gini: The effect of each variable on that heterogeneity of the observation at each node of the classification tree is calculated to compare the importance of the variable. A larger value indicates that the variable is more significant. WGCNA, weighted correlation network analysis; RF, random forest; DEGs, differentially expressed genes; SCI, spinal cord injury.
Figure 3
Figure 3
Functional enrichment, PPI and LASSO analysis of hub genes. (A) Venn diagram of intersection genes between WGCNA and RF. (B) Functional enrichment analysis for 301 hub genes. (C) PPI analysis of hub genes. Red indicates that the gene expression level is upregulated after SCI and blue indicates that the gene expression level is downregulated. The darker the color, the greater the difference in expression level. (D) The locus of change of independent variable coefficient of LASSO analysis. Each curve in the figure represents the change trace of coefficient of each independent variable. The ordinate is the value of the coefficient, the lower abscissa is log(λ) and the upper abscissa is the number of non-zero coefficients in the model at this time. The later the coefficient is compressed to 0, the more important the variable is as the value of λ changes. (E) Model error diagram of LASSO analysis. On the ordinate is Mean-Squared Error. Cross Validation of LASSO analysis allows that for each λ value, around the mean of the target parameter shown by the red dot, one can obtain the confidence interval of the target parameter. There are two numerical dashed lines, the line with the lowest error on the left (λmin) and the line with the least feature on the right (λ1se), which are 0.03236614 and 0.0763 respectively. λmin is the average of the minimum objective parameters that give all λ values. The value of λ1se is a model with good performance but the least parameters. When λ1se was chosen, the performance of the model is the best. PPI, protein-protein interaction; LASSO, least absolute shrinkage and selection operator; WGCNA, weighted correlation network analysis; RF, random forest; SCI, spinal cord injury; PPI, protein-protein interaction network; GO, Gene Ontology.
Figure 4
Figure 4
Single-gene GSEA analysis of key genes. BP, KEGG and Reactome analysis in GSEA analysis between the high-expression and low-expression group of (A) Anxa2. (B) Myo1e. (C) Spp1. BP, biological process; KEGG, Kyoto Encyclopedia of Genes and Genomes; GSEA, Gene Set Enrichment Analysis.
Figure 5
Figure 5
Comparison of hub genes expression levels. Histogram of relative expression levels of (A) Anxa2, (B) Myo1e and (C) Spp1 in GSE96055 expression matrix. (D) Heat map of 203 hub nodes in PPI. PPI, protein-protein interaction. **P<0.01, ***P<0.001 vs. sham.
Figure 6
Figure 6
RT-qPCR and ELISA validation. The mRNA expression levels of (A) Anxa2, (B) Myo1e and (C) Spp1. (The protein expression levels of three key genes, (D) Anxa2, (E) Myo1e and (F) Spp1. A total of three samples per group in duplicate were summarized as the mean ± SEM with P<0.05. BV2 microglia were stimulated with 100 ng/ml LPS for 6, 12 and 24 h, compared with the unstimulated group, respectively. One-way ANOVA was performed. *P<0.05, **P<0.01, ***P<0.001. RT-qPCR, reverse transcription-quantitative PCR; SCI, spinal cord injury; SE, standard error; LPS, lipopolysaccharide.

Similar articles

Cited by

References

    1. Anjum A, Yazid MD, Daud MF, Idris J, Ng AMH, Naicker AS, Ismail OHR, Kumar RK, Lokanathan Y. Spinal cord injury: Pathophysiology, multimolecular interactions, and underlying recovery mechanisms. Int J Mol Sci. 2020;21(7533) doi: 10.3390/ijms21207533. - DOI - PMC - PubMed
    1. Hu X, Xu W, Ren Y, Wang Z, He X, Huang R, Ma B, Zhao J, Zhu R, Cheng L. Spinal cord injury: Molecular mechanisms and therapeutic interventions. Signal Transduct Target Ther. 2023;8(245) doi: 10.1038/s41392-023-01477-6. - DOI - PMC - PubMed
    1. Calvert JS, Grahn PJ, Zhao KD, Lee KH. Emergence of epidural electrical stimulation to facilitate sensorimotor network functionality after spinal cord injury. Neuromodulation. 2019;22:244–252. doi: 10.1111/ner.12938. - DOI - PubMed
    1. Thomaz SR, Cipriano G Jr, Formiga MF, Fachin-Martins E, Cipriano GFB, Martins WR, Cahalin LP. Effect of electrical stimulation on muscle atrophy and spasticity in patients with spinal cord injury-a systematic review with meta-analysis. Spinal Cord. 2019;57:258–266. doi: 10.1038/s41393-019-0250-z. - DOI - PubMed
    1. Brockie S, Hong J, Fehlings MG. The role of microglia in modulating neuroinflammation after spinal cord injury. Int J Mol Sci. 2021;22(9706) doi: 10.3390/ijms22189706. - DOI - PMC - PubMed