

The Influence of Skin Parameters and Body Composition on the Tolerance of Pain Stimulus Generated During Electrical Muscle Stimulation (EMS) in Women - Pilot Study
- PMID: 38827630
- PMCID: PMC11143995
- DOI: 10.2147/CCID.S463676
The Influence of Skin Parameters and Body Composition on the Tolerance of Pain Stimulus Generated During Electrical Muscle Stimulation (EMS) in Women - Pilot Study
Abstract
Purpose: This pilot study aims to explore how skin parameters and body composition impact the tolerance to EMS (Electrical Muscle Stimulation) stimuli in women, particularly focusing on pain tolerance in response to varying intensities of EMS. This research seeks to understand what is essential for optimizing EMS applications.
Patients and methods: The study involved 16 females (age 35.9 ± 12.3). Body composition and anthropometric measurements were taken, including BMI (Body Mass Index), weight percentage, WHtR (Waist to Height Ratio), WHR (Waist-Hip Ratio), and Bioelectrical Impedance Analysis. High-frequency ultrasound scans were conducted to assess skin parameters. The EMS stimulation was performed using an Evolvex (InMode, Israel), with applicators placed around the abdomen and intensity adjusted according to patient tolerance, recorded at the pain threshold.
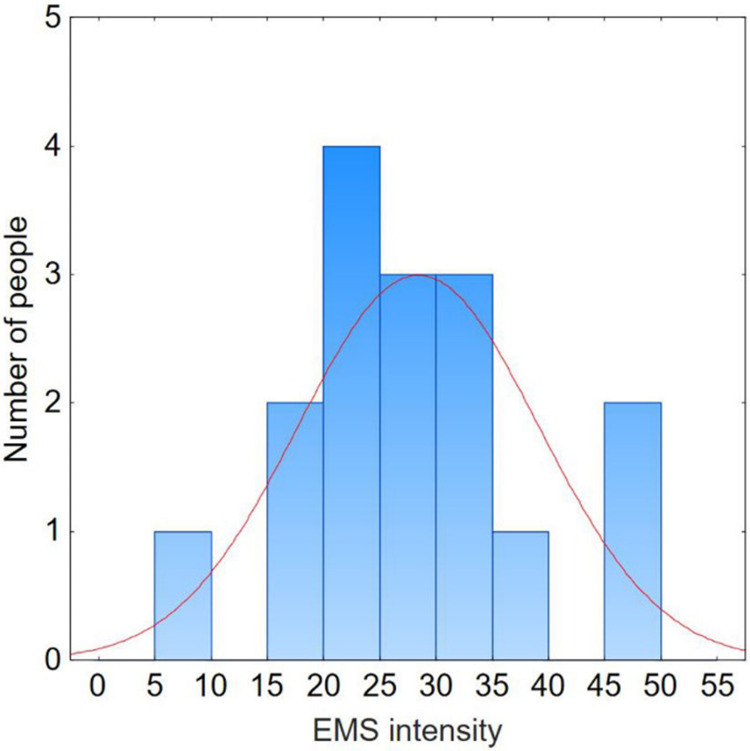
Results: The maximum tolerated EMS stimulus varied from 12V to 55V, with a median of 33V. Body weight showed a strong positive correlation (R=0.76, p<0.001) and hip circumference (R=0.66, p<0.001) with EMS intensity. Body fat mass (R=0.61, p=0.012) and visceral fat area (R=0.55, p=0.029) were positively correlated with EMS intensity. However, no significant correlations were observed between EMS tolerance and muscle tissue parameters or total body water content. The study also found that skin structure parameters showed no significant impact on EMS tolerance.
Conclusion: The study reveals that women's tolerance to EMS stimuli is influenced by various factors. Anthropometric parameters like hip circumference, body weight, skinfold, and BMI are strongly correlated with EMS tolerance. Body composition factors, particularly adipose tissue characteristics such as body fat mass and percentage, also significantly impact EMS intensity requirements, with no notable correlation to muscle tissue or water content. However, variations in skin structure, including thickness and density, do not significantly affect EMS tolerance. These insights are crucial for tailoring personalized EMS therapy to enhance effectiveness and comfort in both aesthetic and rehabilitative applications.
Keywords: BIA; EMS; body composition; high-frequency ultrasound.
© 2024 Lebiedowska et al.
Conflict of interest statement
The authors report no conflicts of interest in this work.
Figures


Similar articles
-
Whole-body electromyostimulation in physical therapy: do gender, skinfold thickness or body composition influence maximum intensity tolerance?J Phys Ther Sci. 2020 Jun;32(6):395-400. doi: 10.1589/jpts.32.395. Epub 2020 Jun 2. J Phys Ther Sci. 2020. PMID: 32581432 Free PMC article.
-
Determining the best method for evaluating obesity and the risk for non-communicable diseases in women of childbearing age by measuring the body mass index, waist circumference, waist-to-hip ratio, waist-to-height ratio, A Body Shape Index, and hip index.Nutrition. 2023 Oct;114:112135. doi: 10.1016/j.nut.2023.112135. Epub 2023 Jun 16. Nutrition. 2023. PMID: 37453224
-
Correlation of body composition in early pregnancy on gestational diabetes mellitus under different body weights before pregnancy.Front Endocrinol (Lausanne). 2022 Oct 28;13:916883. doi: 10.3389/fendo.2022.916883. eCollection 2022. Front Endocrinol (Lausanne). 2022. PMID: 36387861 Free PMC article.
-
Degree of association between the body mass index (BMI), waist-hip ratio (WHR), waist-height ratio (WHtR), body adiposity index (BAI) and conicity index (CI) in physically active older adults.Clin Nutr ESPEN. 2023 Dec;58:335-341. doi: 10.1016/j.clnesp.2023.10.007. Epub 2023 Oct 14. Clin Nutr ESPEN. 2023. PMID: 38057024
-
[Simple obesity in children. A study on the role of nutritional factors].Med Wieku Rozwoj. 2006 Jan-Mar;10(1):3-191. Med Wieku Rozwoj. 2006. PMID: 16733288 Review. Polish.
Cited by
-
Hydration Strategies and Body Composition Differences in Male and Female Elite Bodybuilders During Competition.Nutrients. 2025 Apr 30;17(9):1554. doi: 10.3390/nu17091554. Nutrients. 2025. PMID: 40362858 Free PMC article.
References
-
- Ahmad MF, Hasbullah AH. The effects of electrical muscle stimulation (EMS) towards male skeletal muscle mass. Int J Sport Health Sci. 2015;9(12):864–873.
-
- Knibbe J, Alsmith A, Hornbæk K. Experiencing electrical muscle stimulation. Proc ACM Intera We Ubi Tech. 2018;2(3):1–14. doi:10.1145/3264928 - DOI
LinkOut - more resources
Full Text Sources
