. 2024 May 16:15:1376456.
doi: 10.3389/fimmu.2024.1376456. eCollection 2024.

HLA dependency and possible clinical relevance of intrathecally synthesized anti-IgLON5 IgG4 in anti-IgLON5 disease

Affiliations

HLA dependency and possible clinical relevance of intrathecally synthesized anti-IgLON5 IgG4 in anti-IgLON5 disease

Inga Koneczny et al. Front Immunol. .

Abstract

Background: Anti-IgLON5 disease is a rare chronic autoimmune disorder characterized by IgLON5 autoantibodies predominantly of the IgG4 subclass. Distinct pathogenic effects were described for anti-IgLON5 IgG1 and IgG4, however, with uncertain clinical relevance.

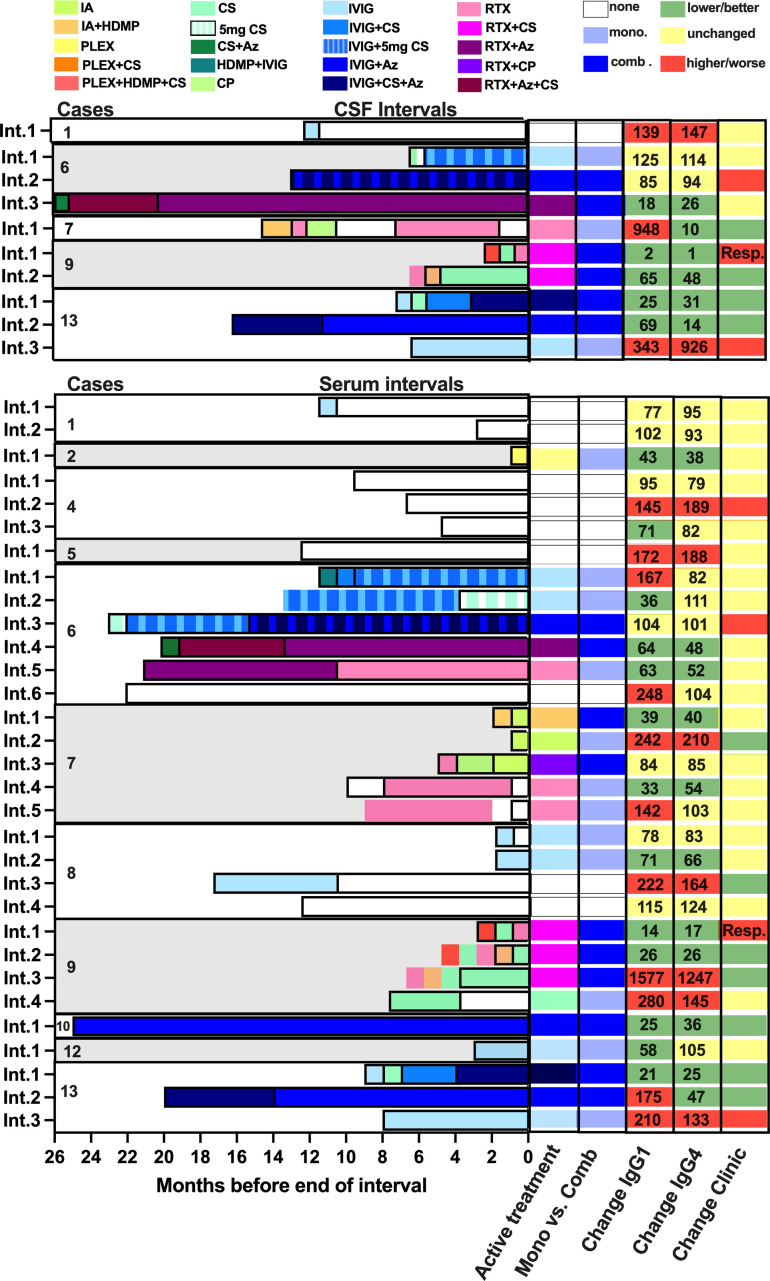
Methods: IgLON5-specific IgG1-4 levels were measured in 46 sera and 20 cerebrospinal fluid (CSF) samples from 13 HLA-subtyped anti-IgLON5 disease patients (six females, seven males) using flow cytometry. Intervals between two consecutive serum or CSF samplings (31 and 10 intervals, respectively) were categorized with regard to the immunomodulatory treatment active at the end of the interval, changes of anti-IgLON5 IgG1 and IgG4 levels, and disease severity. Intrathecal anti-IgLON5 IgG4 synthesis (IS) was assessed using a quantitative method.

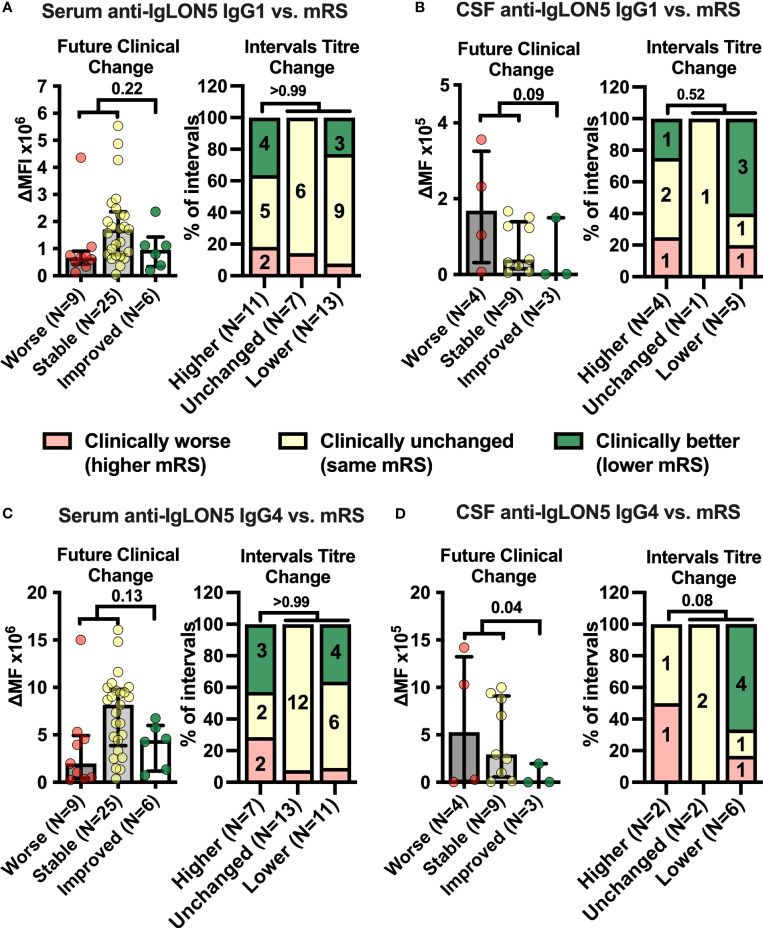
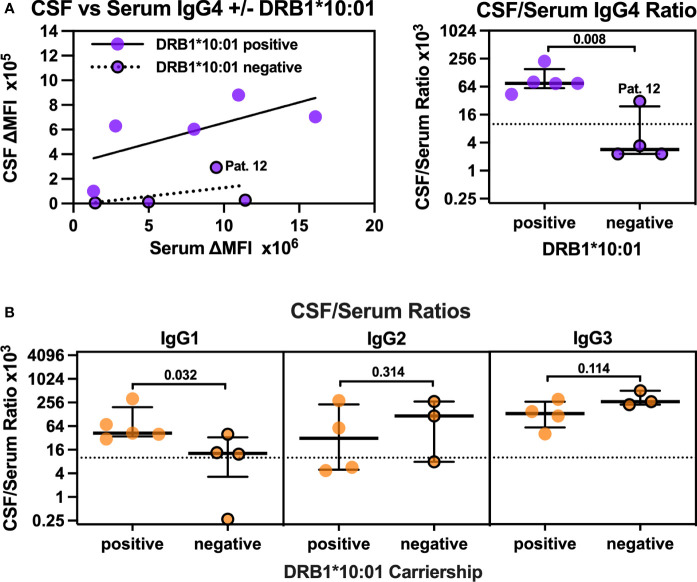
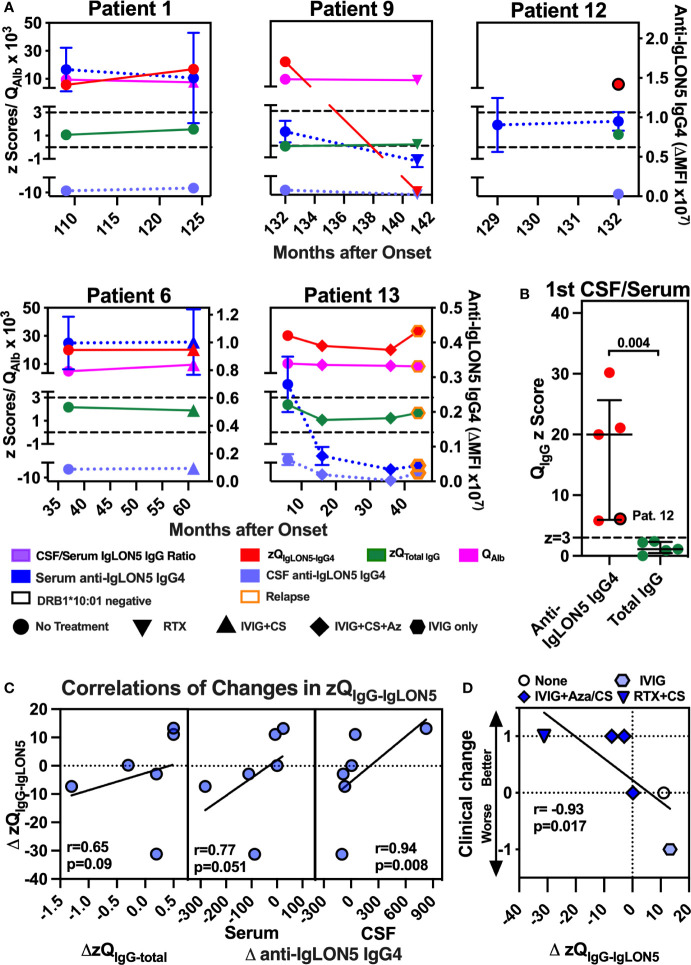
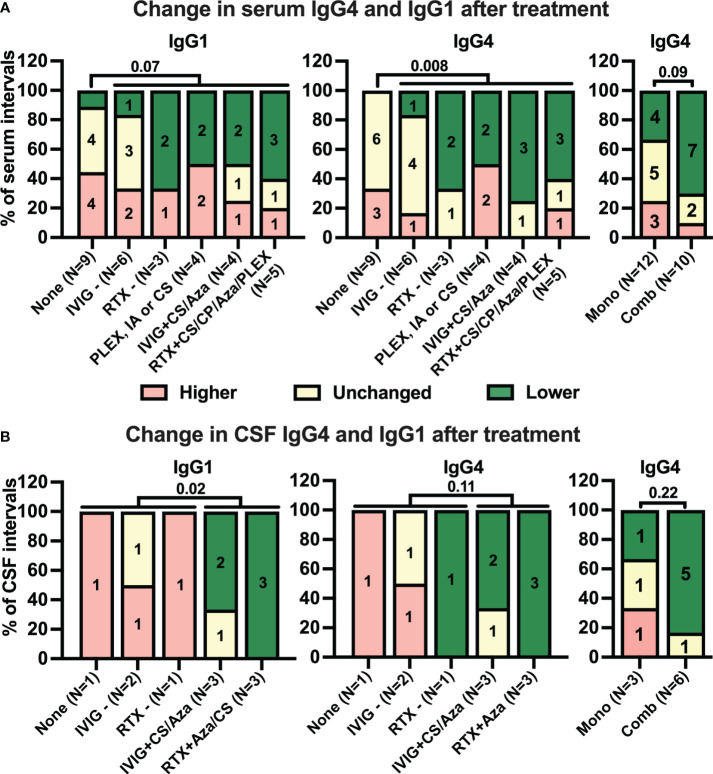
Results: The median age at onset was 66 years (range: 54-75), disease duration 10 years (range: 15-156 months), and follow-up 25 months (range: 0-83). IgLON5-specific IgG4 predominance was observed in 38 of 46 (83%) serum and 11 of 20 (55%) CSF samples. Anti-IgLON5 IgG4 levels prior clinical improvement in CSF but not serum were significantly lower than in those prior stable/progressive disease. Compared to IgLON5 IgG4 levels in serum, CSF levels in HLA-DRB1*10:01 carriers were significantly higher than in non-carriers. Indeed, IgLON5-specific IgG4 IS was demonstrated not only in four of five HLA-DRB1*10:01 carriers but also in one non-carrier. Immunotherapy was associated with decreased anti-IgGLON5 IgG serum levels. In CSF, lower anti-IgLON5 IgG was associated with immunosuppressive treatments used in combination, that is, corticosteroids and/or azathioprine plus intravenous immunoglobulins or rituximab.

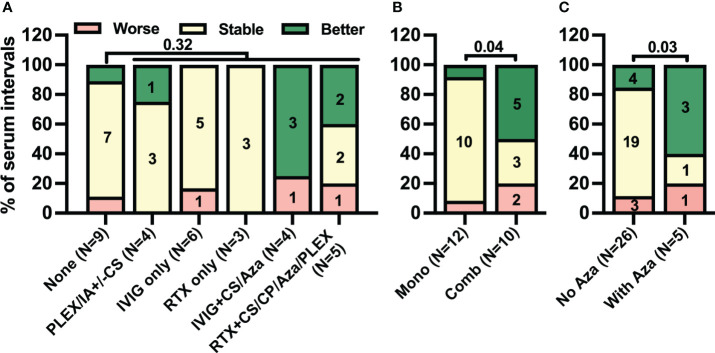
Conclusion: Our findings might indicate that CSF IgLON5-specific IgG4 is frequently produced intrathecally, especially in HLA-DRB1*10:01 carriers. Intrathecally produced IgG4 may be clinically relevant. While many immunotherapies reduce serum IgLON5 IgG levels, more intense immunotherapies induce clinical improvement and may be able to target intrathecally produced anti-IgLON5 IgG. Further studies need to confirm whether anti-IgLON5 IgG4 IS is a suitable prognostic and predictive biomarker in anti-IgLON5 disease.

Keywords: HLA; IgG4; IgLON5; cerebrospinal fluid; intrathecal synthesis; therapy.


Conflict of interest statement

TS-H reports travel grants and speaker honoraria from Roche. MBr has received honoraria for speaking from Sanofi. No conflict of interest with respect to the present study. AH reports speaker honoraria for UCB, Bioprojet, Servier, Medice, Jazz Pharmaceuticals BH reports speaker honoraria Jazz and Abbvie and advisor feed from Lundbeck. MS reports personal fees and grants from Merck Healthcare Deutschland and Bayer Vital GmbH and grant support from the University of Greifswald Gerhard-Domagk fellowship. HT reports speaker honoraria from Jansen, UCB and Zambon. TB has participated in meetings sponsored by and received honoraria lectures, advisory boards, consultations from pharmaceutical companies marketing treatments for MS: Allergan, Biogen, Biologix, Bionorica, BMS/Celgene, Eisei, Janssen-Cilag, MedDay, Merck, Novartis, Roche, Sandoz, Sanofi-Genzyme, Teva, UCB. His institution has received financial support in the past 12 months by unrestricted research grants Bayer, Biogen, BMS/Celgene, Merck, Novartis, Roche, Sanofi-Genzyme, Teva and for participation in clinical trials in multiple sclerosis sponsored by Alexion, Bayer, Biogen, BMS/Celgene, Merck, Novartis, Roche, Sanofi-Aventis, Teva. JL reports travel honoraria and speakers fees from the Cure Huntington’s Disease Initiative CHDI, the Movement Disorders Society as the German Society for Cerebrospinal Fluid Diagnostic and Clinical Neurochemistry DGLN. His institution received financial compensation for clinical trials with JL as principal investigator from CHDI. He is member of the executive board of the DGLN. He received research funding from the German Federal Ministry of Education and Research BMBF. RH reports speaker honoraria from UCB and Biogen. The Medical University of Vienna Austria; employer of RH receives payment for antibody assays and for antibody validation experiments organized by Euroimmun Lübeck, Germany. The remaining authors declare that the research was conducted in the absence of any commercial or financial relationships that could be construed as a potential conflict of interest. The author(s) declared that they were an editorial board member of Frontiers, at the time of submission. This had no impact on the peer review process and the final decision.

Figures

Figure 1
Figure 1
Graphical summary of serum and cerebral spinal fluid intervals including immunomodulatory treatments, changes in anti-IgLON5 IgG1 and IgG4 levels, as well as clinical changes. Treatments were color-coded as indicated. The last active treatment was assessed as described in the Methods sections. Two long-active treatment in parallel (with corticosteroids >5 mg/day) were categorized as combination treatment. The numbers in the columns for changes in IgG1 and IgG4 indicate the percentage change at the end of each interval compared to the start. Resp = patient responded well to rituximab 1 month after first treatment, but the interval terminated 1 week before manifestation of clinical improvement.
Figure 2
Figure 2
Cerebrospinal fluid anti-IgLON5 IgG1 and IgG4 levels and their changes over time correspond better with disease severity than serum levels. (A–D) Left graphs: IgLON5 IgG1 (A, B left) or IgG4 (C, D left) levels (bars + error bars = mean ± SEM) in serum (A, C left) and cerebrospinal fluid (CSF, B, D left) measured by flow cytometry and expressed as mean fluorescence intensity above background (ΔMFI) as in Figure 1 were grouped according to future clinical change at the next follow-up visit categorized as clinically worsened (≥ +1 mRS point, red), unchanged (mRS unchanged, yellow) or improved (≤ −1 mRS point, green). If the mRS was 1 (no functional impairment), changes of reported symptoms were used to categorize intervals. (A–D) Right graphs: The clinical change between two consecutive serum (A, C, right) or CSF (B, D, right) sampling intervals was categorized as clinically worse (≥ +1 mRS point, or worsening of symptoms if mRS = 1, red), unchanged (mRS unchanged, or unchanged symptoms if mRS =1, yellow) or improved (≤ −1 mRS point, or improvement of symptoms if mRS =1, green) and changes of anti-IgLON5 IgG1 (A, B right) or IgG4 (C, D right) levels during these intervals were categorized as higher (+ ≥ 20%), unchanged (± 20%), or lower (−≥ 20%). Bars show the percentage of intervals with one of the three clinical change categories when grouped according to the antibody change category. Numbers in stacked bar graphs indicate the number of intervals. Numbers in column titles indicate the numbers of measurements (left graphs) or intervals (right graphs). For statistical analysis, data were dichotomized into clinically worse/stable versus improved (left graphs) or higher levels versus unchanged or lower levels (right graphs) before testing using one-tailed Mann–Whitney U (left graphs) or Fisher’s exact tests (right graphs). The p-values are indicated.
Figure 3
Figure 3
CSF/Serum ratios for anti-IgLON5 IgG4 but also IgG1 are higher in DRB1*10:01 carriers compared to non-carriers. (A, left panel) The mean fluorescence intensity above background (ΔMFI) for anti-IgLON5 IgG4 in CSF was plotted against serum anti-IgLON5 IgG4 ΔMFI separatedly for DRB1*10:01 carriers (circles without borders) and non-carriers (circles with black borders). The results of linear regression (carriers: R2 = 0.47, p = 0.1984, non-carriers R2 0.21, p = 0.5466) and the non-carrier with the higher CSF/serum ratio (patient 12) are indicated. (A, right panel, B): CSF/serum ratios for anti-IgLON4 IgG4 (A, right panel), IgG1–3 (B) of DRB1*10:01 carriers compared to non-carriers. Statistical analysis in the right panel of (A, B) was performed using one-sided Mann–Whitney U tests. The p-values are indicated. A comparison of anti-IgLON5 IgG4 CSF/serum ratios in association with of DRB1*10:01 and DQB1*05:01 carriership can be found in Supplementary Figure S13.
Figure 4
Figure 4
Robust intrathecal synthesis of anti-IgLON5 IgG4 was observed in five of five patients, and change in clinical severity and CSF IgLON5 IgG4 correlate with changes in the IgLON5-IgG4–specific IS (zQIgG-IgLON5). (A, left panel) The mean fluorescence intensity above background (ΔMFI) for anti-IgLON5 IgG4 in CSF of each first CSF/serum pair available was plotted against the anti-IgLON5 IgG4 ΔMFI in serum for five DRB1*10:01 carriers (no border) and four non-carriers (black border). Patient 12 is indicated. The lines represent simple linear regression. (A, right panel) CSF/serum ratios of DRB1*10:01 carriers compared to non-carriers. (B) Precise quantification of intrathecal anti-IgLON5 IgG4 synthesis using CSF/serum pairs with corresponding data for CSF/serum IgG (QIgG) and albumin ratio (QAlb) from patients 1, 6, 9, 12, and 13 still available following the initial measurements. Results from repeat flow cytometry performed after dilution to equal concentrations of total IgG in CSF and serum were converted to z-scores for anti-IgLON5 IgG4 (zQIgLON5-IgG4) IgG4 and total IgG (zQTotal IgG) as described in the methods and Supplementary Methods. Results for zQIgLON5-IgG4 (red) and zQTotal IgG (green) were plotted against the disease duration using the left y-axis. The corresponding QAlb (pink, left y-axis) and serum and CSF anti-IgLON5 IgG4 mean ± SEM levels dark blue and light blue, respectively, right y-axis) are shown for comparison. The cutoff above which definite intrathecal synthesis (z = 3) can be assumed and z-score without intrathecal synthesis (z = 0) are indicated as black dashed lines. A black border indicates DRB*10:01 non-carriers, orange border clinical relapse. Circle: no treatment in the preceeding interval, upright triangle: Rituximab (RTX), hexagon: IVIG only, inverse triangle: IVIG + corticosteroids (CS), diamond: IVIG + CS + azathioprine (Az) (B) zQIgLON5-IgG4s of the first CSF/serum pair of all five patients compared to the respective z zQTotal IgGs. Again, patient 12 is marked by a black border. Statistical comparisons were performed using two-tailed Mann–Whitney U test. (C, D) The change of the z score for the CSF/serum IgG4 ratio (ΔzQIgG4-IgLON5) in all six intervals with zQIgG4-IgLON5 available at both start and end was plotted against the changes in total IgG IS (zQIgG-total, C, left panel), change in serum IgG4 (C, middle panel), CSF IgG4 (C, right panel), and clinical change (D). Clinical change was defined as −1 = worse (indicated by clinical deterioration and/or increase in mRS), 0 = stable (clinically stable, no change in mRS), 1 = better (clinical improvement and/or reduction of mRS). The results of simple linear regression are depicted. The correlation coefficients obtained by with Pearson correlation and their p-values are indicated.
Figure 5
Figure 5
While many treatments tend to reduce serum anti-IgLON5 levels, only combination immunotherapy coincides with reduction of anti-IgLON5 levels in cerebrospinal fluid. Intervals between two consecutive serum (A) and cerebrospinal fluid (CSF, B) samplings were categorized according to the immunotherapy administrated during the interval as described in the methods sections (None = no treatment, IVIG− = intravenous immunoglobulins only, RTX− = rituximab only, PLEX or CS = plasma exchange or corticosteroids, IVIG +CS/Aza = IVIG + corticosteroids or azathioprine, RTX + CS/CP/Aza/PLEX= rituximab in combination with corticosteroids, cyclophosphamide, azathioprine, or plasmapheresis). The number of intervals is indicated below the bars. Antibody level changes during these intervals were categorized as higher (+> 20%, red), unchanged (± 20%, yellow), or lower (−> 20%, green). Bars show the percentage of intervals assigned to the three antibody levels change categories for anti-IgLON5 IgG1 (left graphs) and IgG4 (middle and right graphs) when grouped according to the treatment regimen. For the right graphs, treatments were dichotomized as monotherapy (Mono) or combination therapy (Comb). In addition, for statistical analysis treatments during the intervals were dichotomized into absence of treatment versus any treatment for serum (A, left and middle graph) or no or monotherapy versus combination therapy for CSF (B, left and middle graphs). A statistical comparison was performed by one-sided Fisher’s exact test. The p-values are indicated above the graphs.
Figure 6
Figure 6
Combination treatment rather than only immunomodulatory treatment is associated with clinical improvement. Intervals between two consecutive serum samplings were categorized according to the immunotherapy administrated during the interval as described in the methods sections (A: None = no treatment, IVIG ± CS/Aza = intravenous immunoglobulins with or without corticosteroids or azathioprine, RTX ± CS/Aza/CP/Plex = rituximab with or without CS, Aza, cyclophosphamide or plasma exchange, PLEX or CS = plasma exchange or corticosteroids, B: No/Mono = no treatment or monotherapy; C: No Aza = without azathioprine, With Aza = with azathioprine). The number of intervals is indicated below the bars. Changes in clinical severity during these intervals were categorized as worse (red), stable (yellow), or better (green) as described in the Materials & Methods section. A statistical comparison was performed by one-sided Fisher’s exact test. The p-values are indicated above the graphs.

References

    1. Gaig C, Graus F, Compta Y, Hogl B, Bataller L, Bruggemann N, et al. . Clinical manifestations of the anti-IgLON5 disease. Neurology. (2017) 88:1736–43. doi: 10.1212/WNL.0000000000003887 - DOI - PMC - PubMed
    1. Werner J, Jelcic I, Schwarz EI, Probst-Muller E, Nilsson J, Schwizer B, et al. . Anti-igLON5 disease: A new bulbar-onset motor neuron mimic syndrome. Neurology(R) Neuroimmunol Neuroinflamm. (2021) 8. doi: 10.1212/NXI.0000000000000962 - DOI - PMC - PubMed
    1. Montagna M, Amir R, De Volder I, Lammens M, Huyskens J, Willekens B. IgLON5-associated encephalitis with atypical brain magnetic resonance imaging and cerebrospinal fluid changes. Front Neurol. (2018) 9:329. doi: 10.3389/fneur.2018.00329 - DOI - PMC - PubMed
    1. Sabater L, Gaig C, Gelpi E, Bataller L, Lewerenz J, Torres-Vega E, et al. . A novel non-rapid-eye movement and rapid-eye-movement parasomnia with sleep breathing disorder associated with antibodies to IgLON5: a case series, characterisation of the antigen, and post-mortem study. Lancet Neurol. (2014) 13:575–86. doi: 10.1016/S1474-4422(14)70051-1 - DOI - PMC - PubMed
    1. Erro ME, Sabater L, Martinez L, Herrera M, Ostolaza A, Garcia de Gurtubay I, et al. . Anti-IGLON5 disease: A new case without neuropathologic evidence of brainstem tauopathy. Neurology(R) Neuroimmunol Neuroinflamm. (2020) 7. doi: 10.1212/NXI.0000000000000651 - DOI - PMC - PubMed