

Phenotypic changes of γδ T cells in Plasmodium falciparum placental malaria and pregnancy outcomes in women at delivery in Cameroon
- PMID: 38827744
- PMCID: PMC11140112
- DOI: 10.3389/fimmu.2024.1385380
Phenotypic changes of γδ T cells in Plasmodium falciparum placental malaria and pregnancy outcomes in women at delivery in Cameroon
Abstract
Introduction: Depending on the microenvironment, γδ T cells may assume characteristics similar to those of Th1, Th2, Th17, regulatory T cells or antigen presenting cells. Despite the wide documentation of the effect of Th1/Th2 balance on pregnancy associated malaria and outcomes, there are no reports on the relationship between γδ T cell phenotype change and Placental Malaria (PM) with pregnancy outcomes. This study sought to investigate the involvement of γδ T cells and its subsets in placental Plasmodium falciparum malaria.
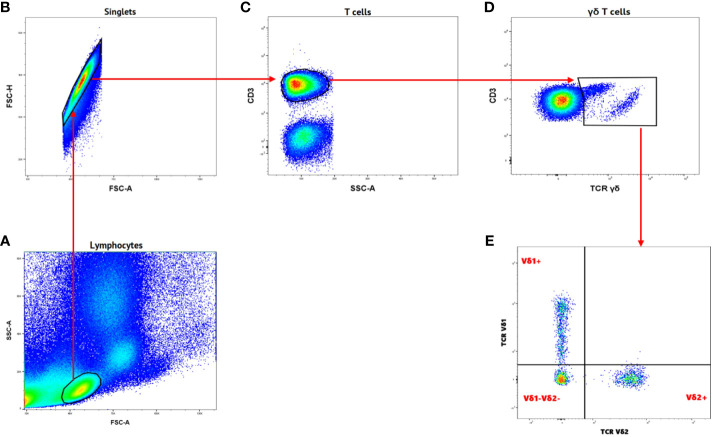
Methods: In a case-control study conducted in Yaoundé, Cameroon from March 2022 to May 2023, peripheral, placental and cord blood samples were collected from 50 women at delivery (29 PM negative: PM- and 21 PM positive: PM+; as diagnosed by light microscopy). Hemoglobin levels were measured using hemoglobinometer. PBMCs, IVBMCs and CBMCs were isolated using histopaque-1077 and used to characterize total γδ T cell populations and subsets (Vδ1+, Vδ2+, Vδ1-Vδ2-) by flow cytometry.
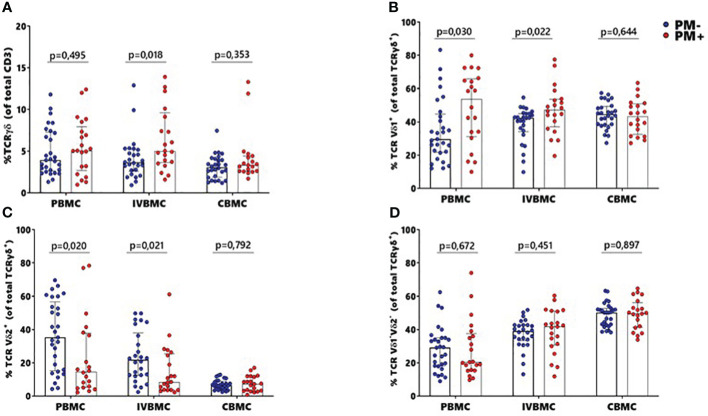
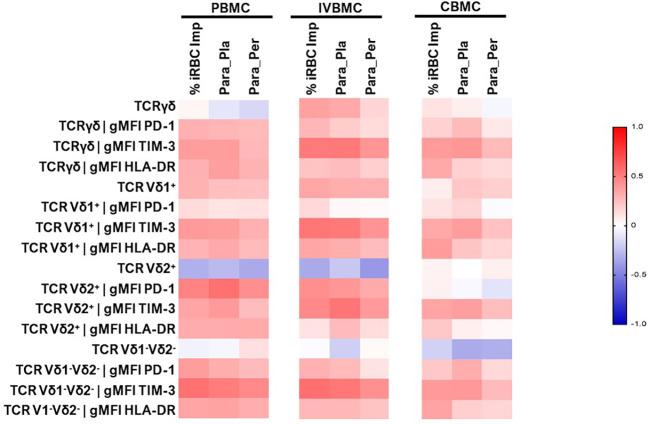
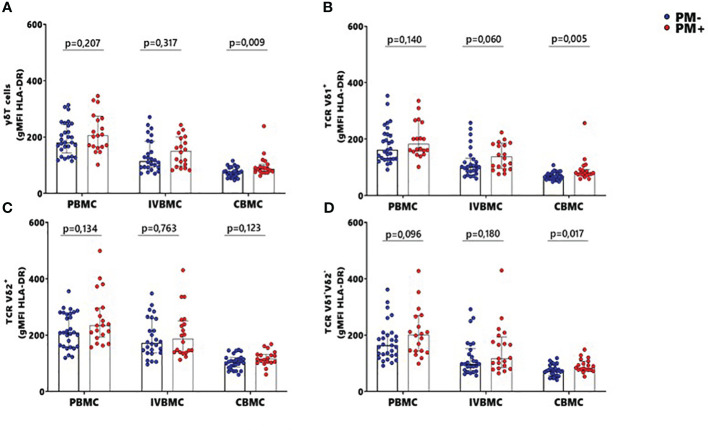
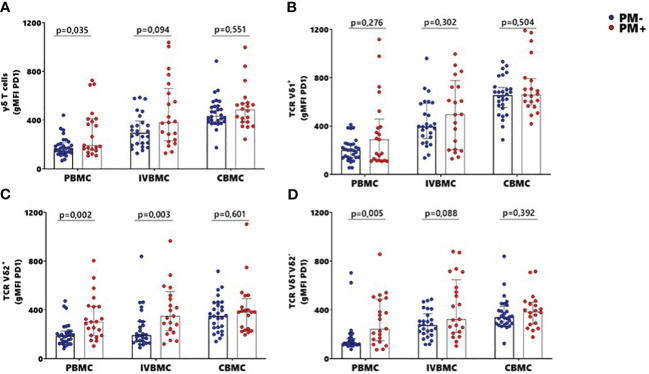
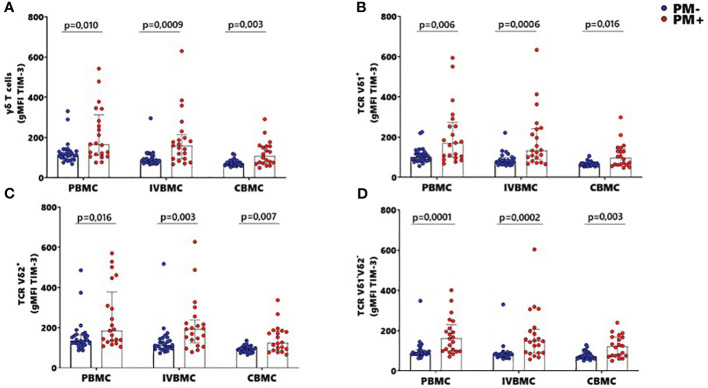
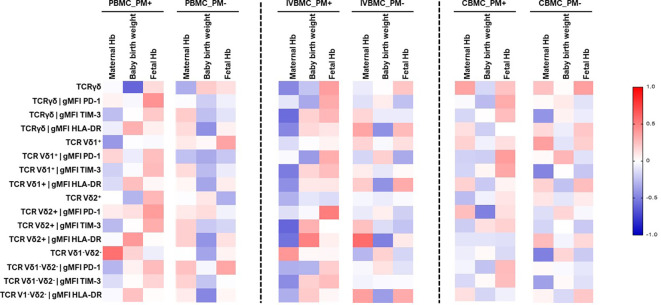
Results: Placental Plasmodium falciparum infection was associated with significant increase in the frequency of total γδ T cells in IVBMC and of the Vδ1+ subset in PBMC and IVBMC, but decreased frequency of the Vδ2+ subset in PBMC and IVBMC. The expression of the activation marker: HLA-DR, and the exhaustion markers (PD1 and TIM3) within total γδ T cells and subsets were significantly up-regulated in PM+ compared to PM- group. The frequency of total γδ T cells in IVBMC, TIM-3 expression within total γδ T cells and subsets in IVBMC, as well as HLA-DR expression within total γδ T cells and Vδ2+ subset in IVBMC were negatively associated with maternal hemoglobin levels. Furthermore, the frequency of total γδ T cells in PBMC and PD1 expression within the Vδ2+ subset in CBMC were negatively associated with birth weight contrary to the frequency of Vδ1-Vδ2- subset in PBMC and HLA-DR expression within the Vδ2+ subset in IVBMC which positively associated with maternal hemoglobin level and birth weight, respectively.
Conclusion: The data indicate up-regulation of activated and exhausted γδ T cells in Plasmodium falciparum placental malaria, with effects on pregnancy outcomes including maternal hemoglobin level and birth weight.
Keywords: HLA-DR; PD1; Plasmodium falciparum; TIM-3; placental malaria; pregnancy outcomes; women; γδ T cells.
Copyright © 2024 Nana, Tchakounté, Bitye, Fogang, Zangue, Seumko’o, Nana, Leke, Djontu, Argüello, Ayong and Megnekou.
Conflict of interest statement
The authors declare that the research was conducted in the absence of any commercial or financial relationships that could be construed as a potential conflict of interest.
Figures
Similar articles
-
Activation of TCR Vδ1+ and Vδ1-Vδ2- γδ T Cells upon Controlled Infection with Plasmodium falciparum in Tanzanian Volunteers.J Immunol. 2020 Jan 1;204(1):180-191. doi: 10.4049/jimmunol.1900669. Epub 2019 Dec 4. J Immunol. 2020. PMID: 31801816
-
Longitudinal analysis of gamma delta T cell subsets during malaria infections in Malian adults.Malar J. 2019 Mar 12;18(1):69. doi: 10.1186/s12936-019-2702-5. Malar J. 2019. PMID: 30866943 Free PMC article. Clinical Trial.
-
Lymphocyte activation and subset redistribution in the peripheral blood in acute malaria illness: distinct gammadelta+ T cell patterns in Plasmodium falciparum and P. vivax infections.Clin Exp Immunol. 1997 Apr;108(1):34-41. doi: 10.1046/j.1365-2249.1997.d01-981.x. Clin Exp Immunol. 1997. PMID: 9097908 Free PMC article.
-
Human Vδ1+ T Cells in the Immune Response to Plasmodium falciparum Infection.Front Immunol. 2019 Feb 14;10:259. doi: 10.3389/fimmu.2019.00259. eCollection 2019. Front Immunol. 2019. PMID: 30837999 Free PMC article. Review.
-
Biology of gammadelta T cells in tuberculosis and malaria.Curr Mol Med. 2001 Sep;1(4):437-46. doi: 10.2174/1566524013363627. Curr Mol Med. 2001. PMID: 11899088 Review.
Cited by
-
Malaria: past, present, and future.Signal Transduct Target Ther. 2025 Jun 17;10(1):188. doi: 10.1038/s41392-025-02246-3. Signal Transduct Target Ther. 2025. PMID: 40523953 Free PMC article. Review.
-
Research progress on V delta 1+ T cells and their effect on pathogen infection.PeerJ. 2024 Oct 30;12:e18313. doi: 10.7717/peerj.18313. eCollection 2024. PeerJ. 2024. PMID: 39494290 Free PMC article. Review.
References
-
- World Health Organization . World malaria report 2023. Geneva: World Health Organization; (2023). Available at: https://www.who.int/publications-detail-redirect/9789240086173.
-
- World Health Organization . World malaria report 2020: 20 years of global progress and challenges. Geneva: World Health Organization; (2020). Available at: https://apps.who.int/iris/handle/10665/337660.
MeSH terms
Substances
LinkOut - more resources
Full Text Sources
Research Materials