. 2024 Jun;14(6):2613-2630.
doi: 10.1016/j.apsb.2024.03.011. Epub 2024 Mar 10.

Glucagon-like peptide-1 receptor agonists rescued diabetic vascular endothelial damage through suppression of aberrant STING signaling

Affiliations

Glucagon-like peptide-1 receptor agonists rescued diabetic vascular endothelial damage through suppression of aberrant STING signaling

Xuemin He et al. Acta Pharm Sin B. 2024 Jun.

Abstract

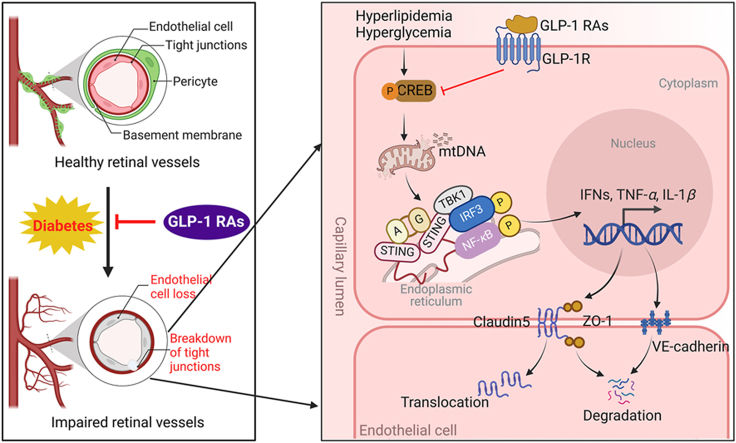
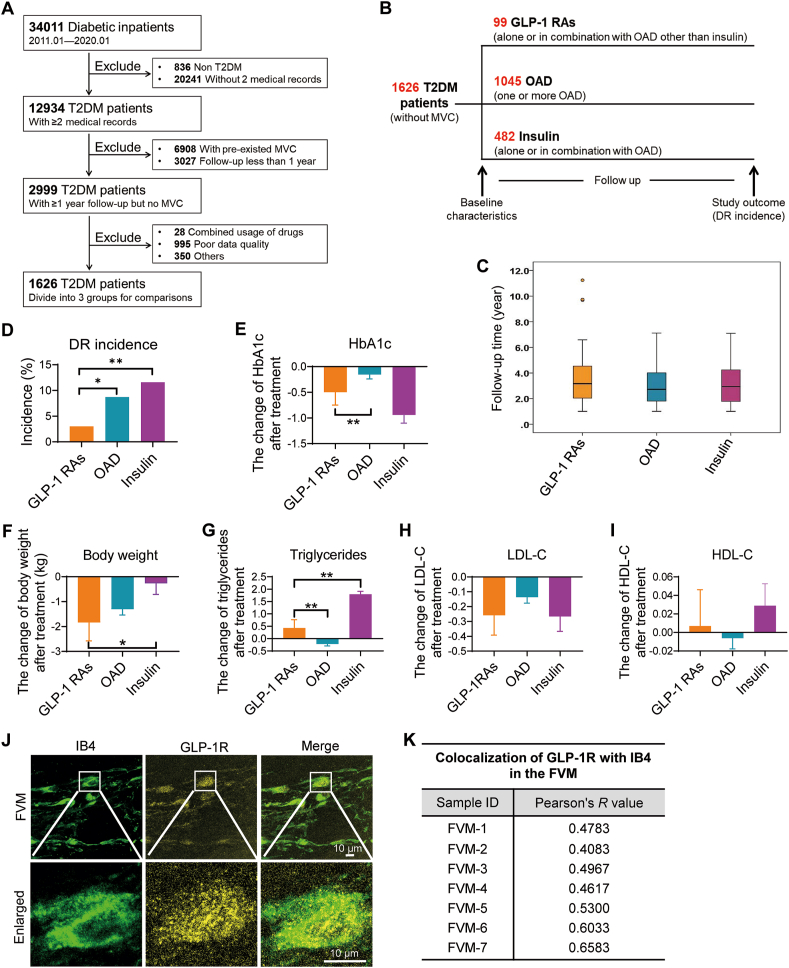
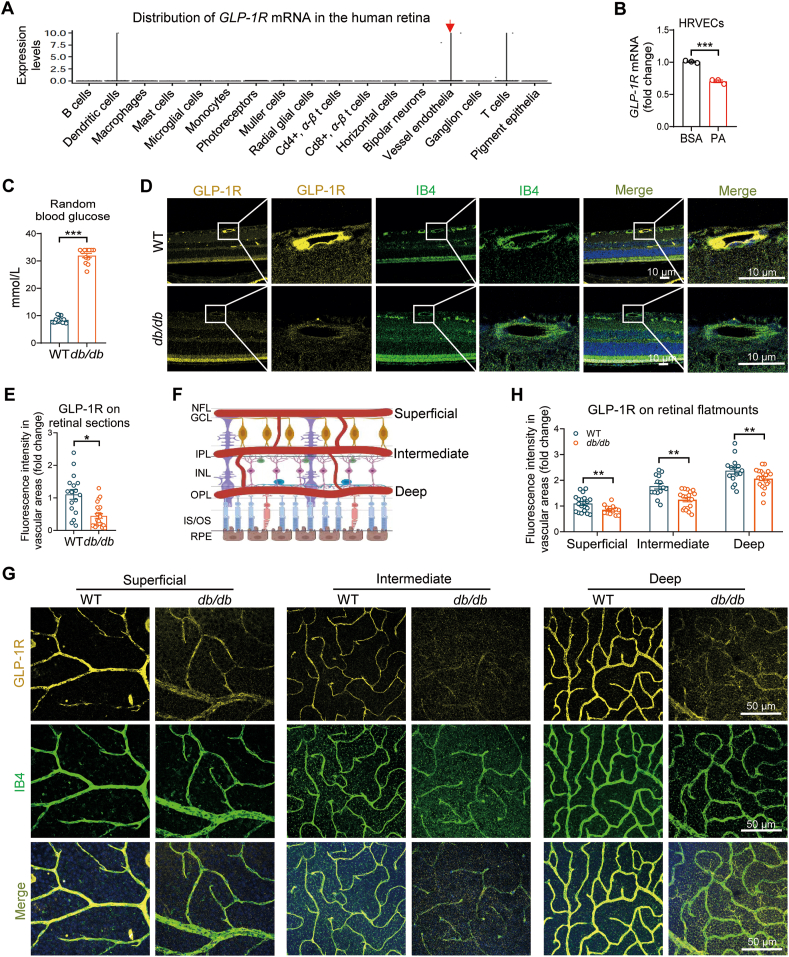
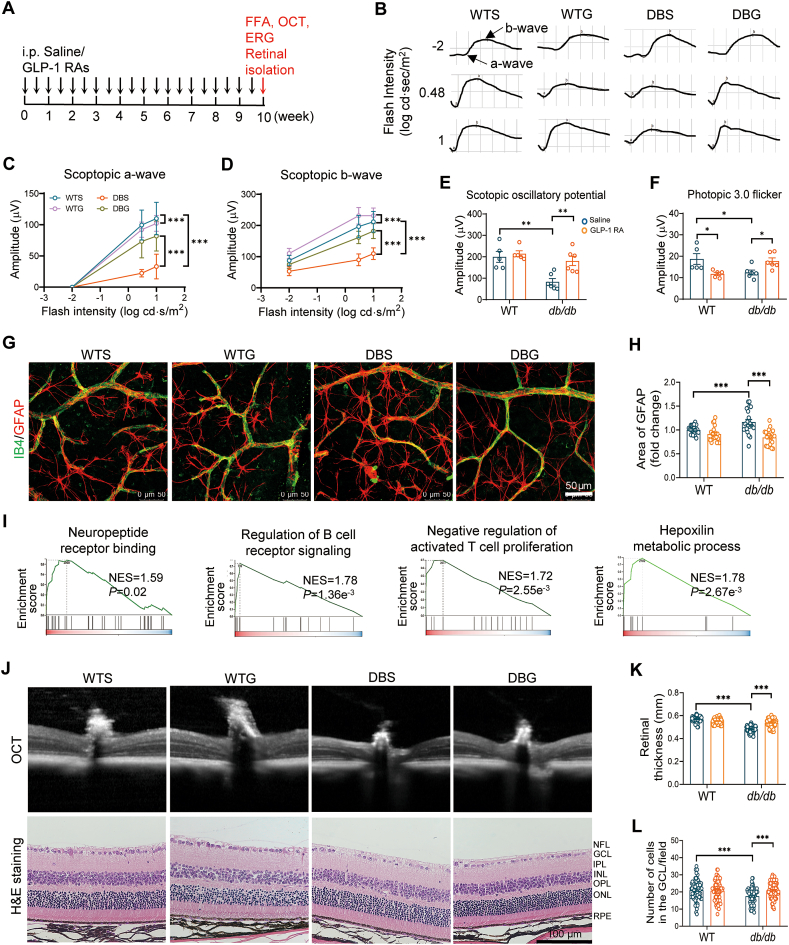
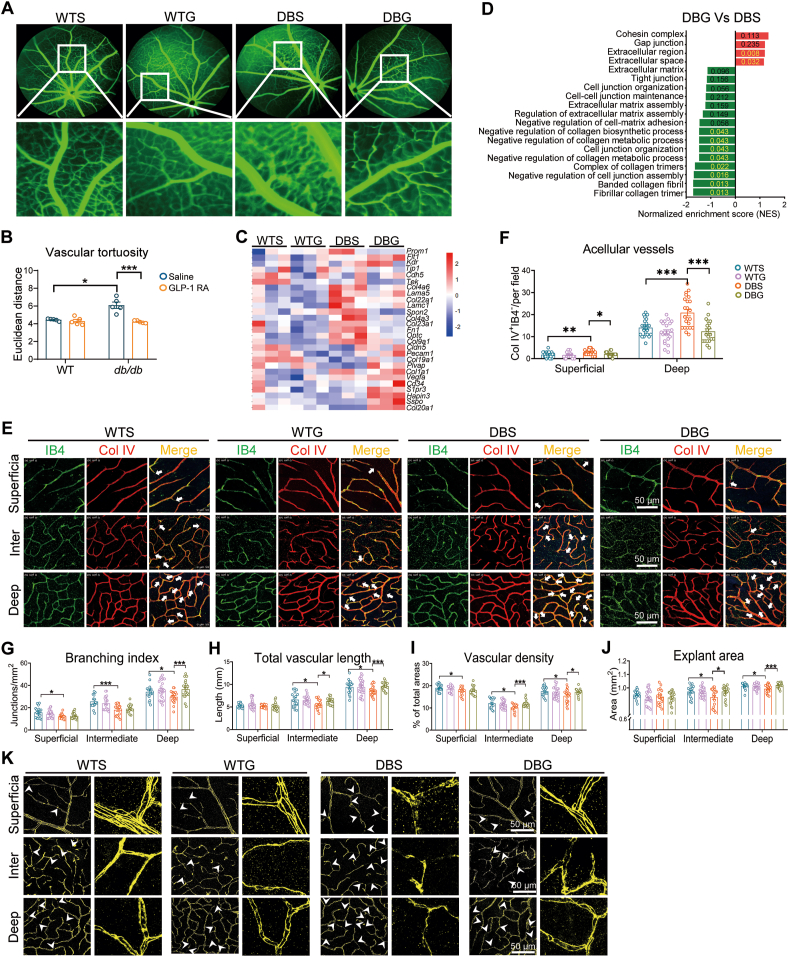
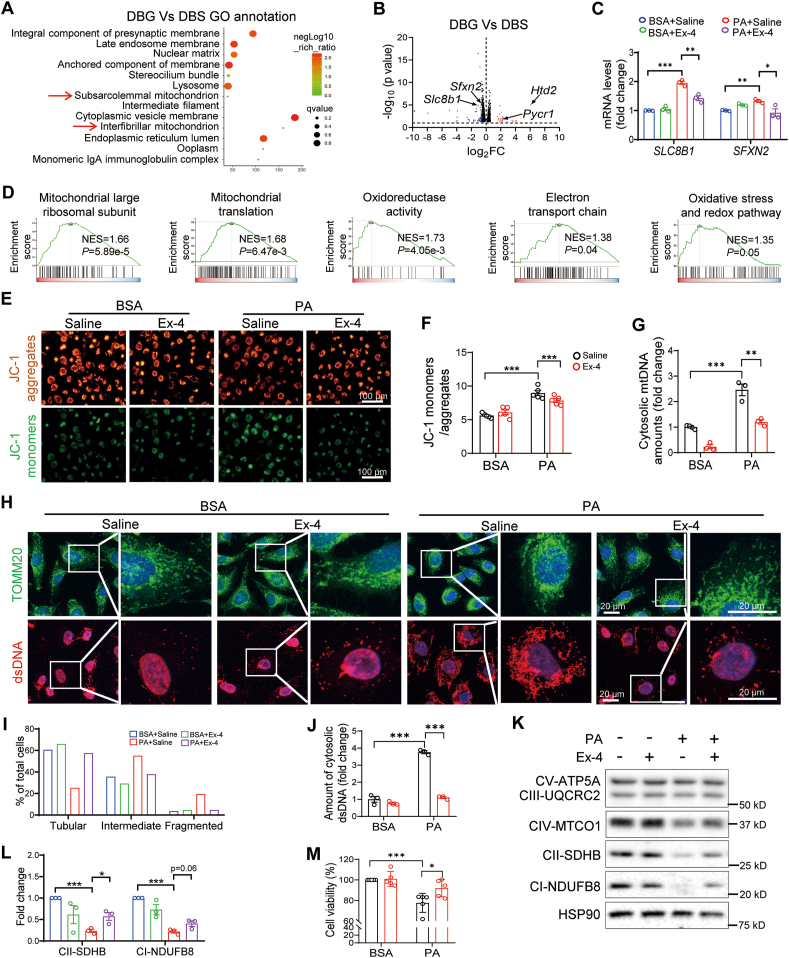
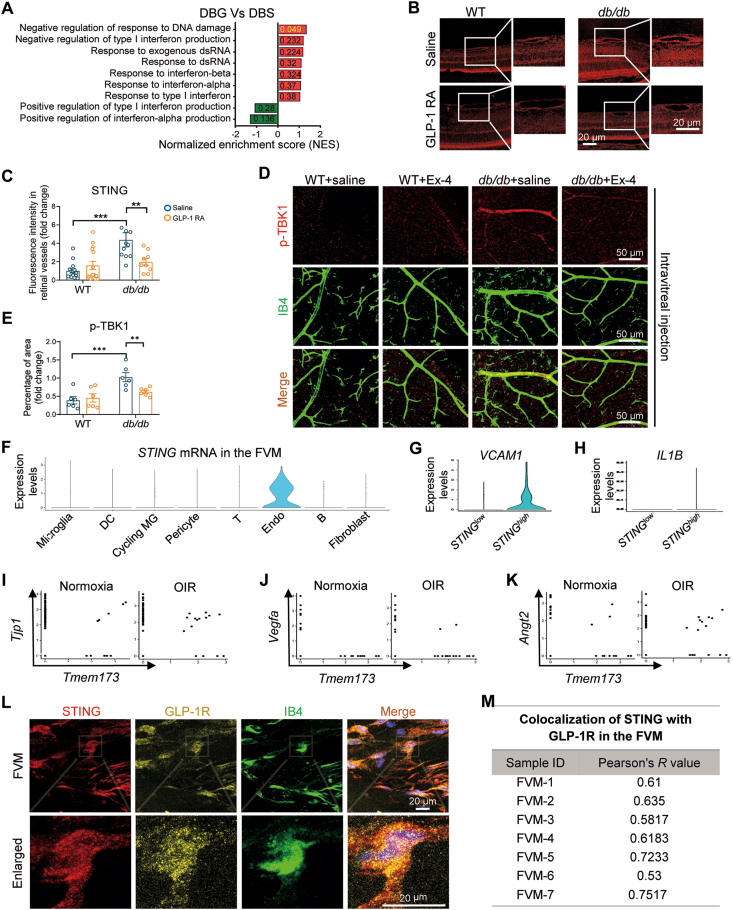
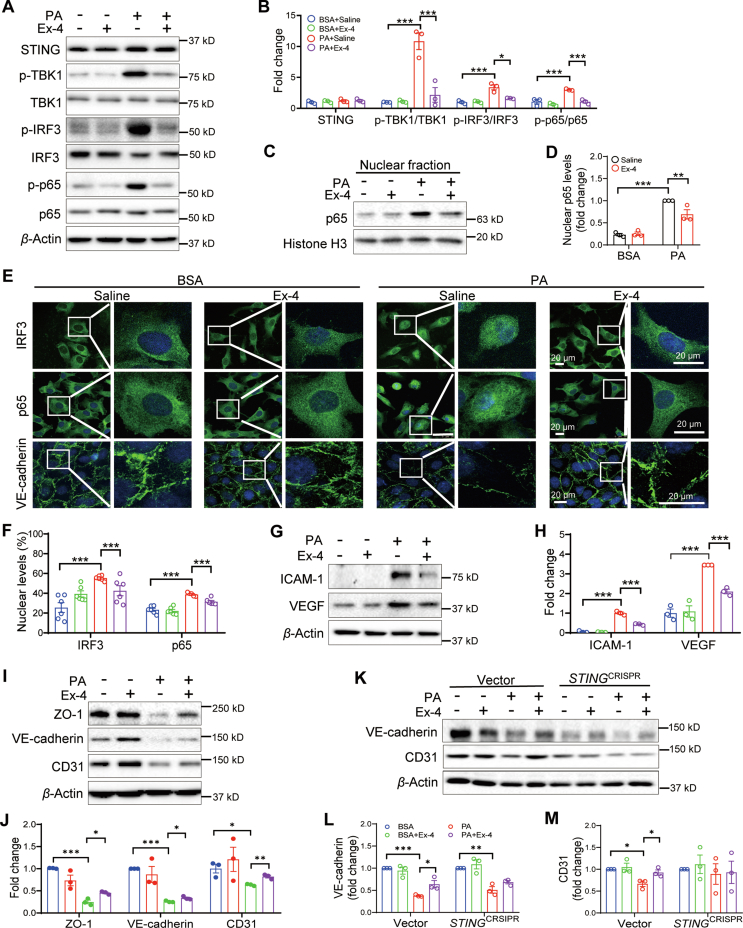
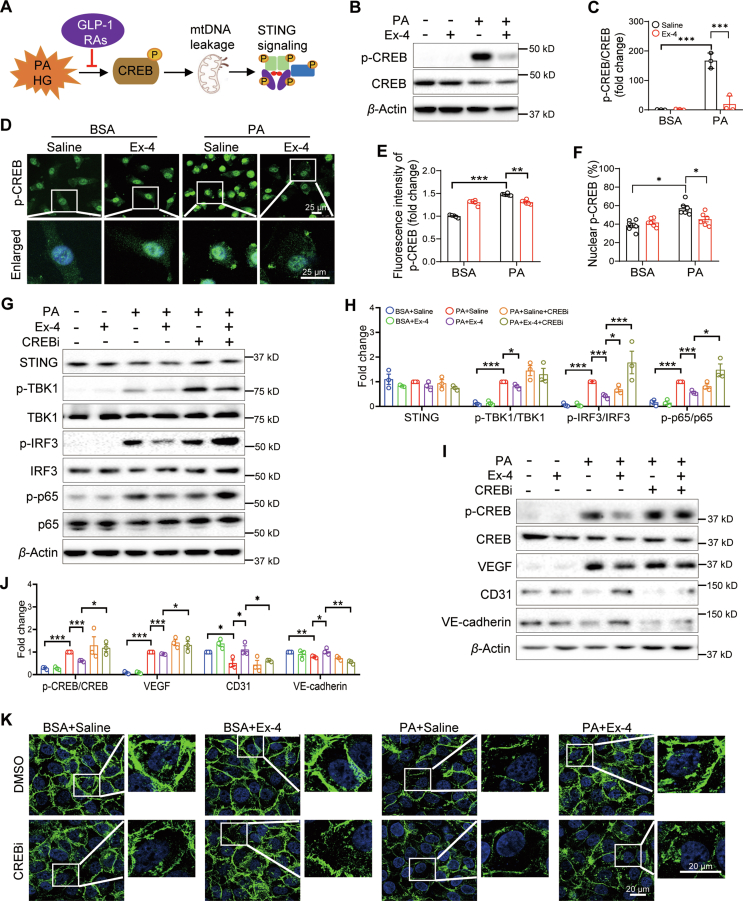
Glucagon-like peptide-1 receptor agonists (GLP-1 RAs) protect against diabetic cardiovascular diseases and nephropathy. However, their activity in diabetic retinopathy (DR) remains unclear. Our retrospective cohort study involving 1626 T2DM patients revealed superior efficacy of GLP-1 RAs in controlling DR compared to other glucose-lowering medications, suggesting their advantage in DR treatment. By single-cell RNA-sequencing analysis and immunostaining, we observed a high expression of GLP-1R in retinal endothelial cells, which was down-regulated under diabetic conditions. Treatment of GLP-1 RAs significantly restored the receptor expression, resulting in an improvement in retinal degeneration, vascular tortuosity, avascular vessels, and vascular integrity in diabetic mice. GO and GSEA analyses further implicated enhanced mitochondrial gene translation and mitochondrial functions by GLP-1 RAs. Additionally, the treatment attenuated STING signaling activation in retinal endothelial cells, which is typically activated by leaked mitochondrial DNA. Expression of STING mRNA was positively correlated to the levels of angiogenic and inflammatory factors in the endothelial cells of human fibrovascular membranes. Further investigation revealed that the cAMP-responsive element binding protein played a role in the GLP-1R signaling pathway on suppression of STING signaling. This study demonstrates a novel role of GLP-1 RAs in the protection of diabetic retinal vasculature by inhibiting STING-elicited inflammatory signals.

Keywords: CREB; Diabetic retinopathy; GLP-1 RAs; Inflammation; Mitochondrial leakage; Retinal endothelial cells; Retinal vascular dysfunction; STING signaling.


Conflict of interest statement

The authors declare no conflicts of interest.

Figures

Image 1
Graphical abstract
Figure 1
Figure 1
Decreased DR incidence in type 2 diabetic patients with GLP-1 RAs utilization and measurement of GLP-1R in the FVM. (A) Flow chart of the exclusion steps in the retrospective cohort study. (B) Illustration of the grouping strategy based on the medication history. (C) Follow-up time, (D) DR incidence, and levels of HbA1c (E), body weight (F), triglycerides (G), LDL-C (H), and HDL-C (I) in these three groups. (J, K) Immunostaining of GLP-1R (yellow) together with IB4 (green), and percentage of IB4+GLP-1R+ cells in the FVM from type 2 diabetic patients with proliferative DR (n = 7, scale bar = 10 μm). Data are expressed as mean ± SEM; ∗P < 0.05, ∗∗P < 0.01.
Figure 2
Figure 2
The levels of GLP-1R were decreased in the mouse retinal vessels with DR. (A) Distribution of GLP-1R mRNA in the human retina revealed by scRNA-seq analysis. (B) Real-time PCR measurement of GLP-1R mRNA levels in HRVECs after treatment of PA (200 μmol/L) or the same volume of BSA for 24 h (n = 3). (C) Random blood glucose levels of 18-week-old db/db mice and WT mice (n = 9–13). (D, E, G, H) Immunostaining of GLP-1R (yellow) together with IB4 (green), and quantification of fluorescence intensity in retinal paraffin sections (n = 5, scale bar = 10 μm) and retinal flatmounts (n = 5, scale bar = 50 μm) from 18-week-old db/db mice and WT mice. (F) Illustration of the three vascular plexuses in the retina. Data are expressed as mean ± SEM; ∗P < 0.05, ∗∗P < 0.01, ∗∗∗P < 0.001.
Figure 3
Figure 3
GLP-1 RAs improved retinal neuronal activities and suppressed inflammation in db/db mice. (A) Timeline of GLP-1 RAs treatments and measurements in the mice. (B) Illustration of the ERG curves of a-wave and b-wave. (C–F) Quantification of (C) scotopic a-wave, (D) scotopic b-wave, (E) scotopic oscillatory potentials, and (F) photopic 3.0 flicker in the retinas of 18-week-old db/db mice and WT mice (n = 9–13). (G, H) Immunostaining and quantification of GFAP (astrocyte marker, red) and IB4 (green) in the superficial layer of retinal flatmounts (n = 3, scale bar = 50 μm). (I) GSEA analysis of neuronal activity and inflammatory pathways in the DBG retinas compared to the DBS controls. (J–L) OCT and quantification of central retinal thickness (n = 5), as well as H&E staining, and quantification of cell numbers in the ganglion cell layer of db/db mice and WT mice (n = 5–6, scale bar = 100 μm). ERG, OCT, and staining of GFAP were performed on the mice using Semaglutide; RNA-seq analyses and H&E staining were performed on the mice using Loxenatide. Data are expressed as mean ± SEM; ∗P < 0.05, ∗∗P < 0.01, ∗∗∗P < 0.001.
Figure 4
Figure 4
GLP-1 RAs preserved the integrity and functions of the retinal vessels of db/db mice. (A, B) FFA and quantification of retinal vascular tortuosity in 18-week-old db/db mice and WT mice (n = 5). (C) Heat map of ECM components, junctional proteins, endothelial markers, and angiogenic factors, and (D) GSEA analysis of junctional and ECM signaling pathways in the retinas (n = 3). (E–J) Co-staining of IB4 (green) and collagen IV (red), and quantification of acellular vessels, branching index, total vascular length, vascular density, and explant area in the superficial, intermediate, and deep layer of the retinal vasculature (n = 3–5, scale bar = 50 μm). (K) Staining of claudin-5 in retinal samples. White arrows indicated broken lines of claudin-5 at the junctional site of the vasculature (n = 3, scale bar = 50 μm). FFA and staining of collagen IV were performed on the mice using semaglutide; RNA-seq analyses and staining of claudin-5 were performed on the mice using loxenatide. Data are expressed as mean ± SEM; ∗P < 0.05, ∗∗P < 0.01, ∗∗∗P < 0.001.
Figure 5
Figure 5
GLP-1 RAs preserved the mitochondrial integrity and maintained the redox balance in retinal ECs. (A) GO analysis of the topmost changed cellular components, (B) volcano plot of 18,439 genes, and (D) GSEA of mitochondria-related pathways in the DBG retinas relative to DBS controls. Genes with fold change <0.66 or ≥1.5, and P < 0.05 were considered significantly changed. Down-regulated genes were represented by blue dots and up-regulated genes by red dots. Arrows indicated significantly changed mitochondria-related molecules (n = 3). (C) Real-time PCR measurement of SLC8B1 and SFXN2 (n = 3), (E, F) Immunostaining and quantification of JC-1 monomers and aggregates (n = 6, scale bar = 100 μm), (G) real-time PCR measurement of mtDNA amounts (n = 3), (H) immunostaining of TOMM20 (green, scale bar = 20 μm) and dsDNA (red, scale bar = 20 μm), (I) quantification of the percentage of tubular, intermediate and fragmented mitochondria, (J) quantification of cytosolic dsDNA amounts (n = 6), (K) Western blot analysis of five OXPHOS proteins including CV-ATP5A, CIII-UQCRC2, CIV-MTCO1, CII-SDHB, and CI-NDUFB8, (L) densitometry quantification of CII-SDHB and CI-NDUFB8, and (M) cell viability measured by the CCK-8 kit in HRVECs pre-treated by Ex-4 (200 nmol/L) for 24 h, followed by treatment of PA (200 μmol/L) or BSA for 24 h (n = 3). RNA-seq analyses were performed on the mice using loxenatide. Data are expressed as mean ± SEM; ∗P < 0.05, ∗∗P < 0.01, ∗∗∗P < 0.001.
Figure 6
Figure 6
GLP-1 RAs suppressed the activation of STING signaling in the retinal vessels of DR. (A) GSEA of the STING-related pathways in the DBG retinas compared to the DBS controls. (B) Immunostaining and (C) quantification of STING (red) in the retinal sections of 18-week-old mice (n = 5, scale bar = 20 μm). (D) Immunostaining of p-TBK1 (red) and IB4 (green), and (E) quantification of p-TBK1 in the retinal flatmounts from mice receiving intravitreal injection of either saline or Ex-4 twice (n = 3 eyes, scale bar = 50 μm). (F) UMAP plot of cellular STING mRNA levels in the FVM from type 2 diabetic patients with proliferative DR. (G, H) Expression levels of VCAM-1 and IL-1B mRNAs in the STINGhigh and STINGlow ECs of the FVM from type 2 diabetic patients with proliferative DR. (I–K) Correlation of Sting mRNA expression with the levels of Tjp1, Vegfa, Angt2, and Dpp4 in the ECs from the retinas of mice with/without OIR. (L) Immunostaining of STING (red), GLP-1R (yellow), IB4 (green), and (M) quantification of the colocalization percentage of GLP-1R with STING in the FVM from type 2 diabetic patients with proliferative DR (n = 7, scale bar = 20 μm). RNA-seq analyses and staining of STING together with GLP-1R were performed on the mice using loxenatide. Data are expressed as mean ± SEM; ∗P < 0.05, ∗∗P < 0.01, ∗∗∗P < 0.001.
Figure 7
Figure 7
GLP-1 RA attenuated the activation of STING signaling to protect endothelial junction in HRVECs. (A–D, G–J) Western blot analysis and densitometry quantification of STING, p-TBK1, TBK1, p-p65, p65, p-IRF3, IRF3, ICAM-1, VEGF, ZO-1, VE-cadherin and CD31 in whole cell lysates, as well as p65 in the nuclear fractions in HRVECs pre-treated by Ex-4 (200 nmol/L) for 24 h, followed by treatment of PA (200 μmol/L) or BSA for 24 h (n = 3). (E, F) Immunostaining and quantification of p65, IRF3, and VE-cadherin in HRVECs pre-treated by Ex-4 (200 nmol/L) for 24 h, followed by treatment of PA (200 μmol/L) or BSA for 24 h (n = 6, scale bar = 20 μm). (K–M) Western blot analysis and densitometry quantification of VE-cadherin, CD31, and STING in the Vector and STINGCRISPR HRVECs pre-treated by Ex-4 (200 nmol/L) for 24 h, followed by treatment of PA (200 μmol/L) or BSA for 24 h (n = 3). Data are expressed as mean ± SEM; ∗P < 0.05, ∗∗P < 0.01, ∗∗∗P < 0.001.
Figure 8
Figure 8
CREB was the downstream effector of GLP-1 RA in the regulation of STING signaling in retinal ECs. (A) Cartoon illustration of CREB as the downstream effector of GLP-1 RAs to inhibit mtDNA leakage into the cytosol in retinal vascular ECs. (B, C) Western blot analysis and densitometry quantification of p-CREB and CREB in HRVECs pre-treated by Ex-4 (200 nmol/L) for 24 h, followed by treatment of PA (200 μmol/L) or BSA for 24 h (n = 3). (D–F) Immunostaining of p-CREB and quantification of total p-CREB as well as nuclear p-CREB in HRVECs pre-treated by Ex-4 (200 nmol/L) for 24 h, followed by treatment of PA (200 μmol/L) or BSA for 24 h (n = 6, scale bar = 25 μm). (G–J) Western blot analysis and densitometry quantification of STING, p-TBK1, TBK1, p-p65, p65, p-IRF3, IRF3, p-CREB, CREB, VEGF, CD31, and VE-cadherin, and (K) staining of VE-cadherin in HRVECs pre-treated by Ex-4 (200 nmol/L) for 24 h and CREBi (100 nmol/L) for 2 h, followed by treatment of PA (200 μmol/L) or BSA for 24 h (n = 3, scale bar = 20 μm). Data are expressed as mean ± SEM; ∗P < 0.05, ∗∗P < 0.01, ∗∗∗P < 0.001.

Similar articles

Cited by

References

    1. Teo Z.L., Tham Y.C., Yu M., Chee M.L., Rim T.H., Cheung N., et al. Global prevalence of diabetic retinopathy and projection of burden through 2045: systematic review and meta-analysis. Ophthalmology. 2021;128:1580–1591. - PubMed
    1. Wang L., Gao P., Zhang M., Huang Z., Zhang D., Deng Q., et al. Prevalence and ethnic pattern of diabetes and prediabetes in China in 2013. JAMA. 2017;317:2515–2523. - PMC - PubMed
    1. Kazemian P., Shebl F.M., McCann N., Walensky R.P., Wexler D.J. Evaluation of the cascade of diabetes care in the United States, 2005–2016. JAMA Intern Med. 2019;179:1376–1385. - PMC - PubMed
    1. Campbell J.P., Zhang M., Hwang T.S., Bailey S.T., Wilson D.J., Jia Y., et al. Detailed vascular anatomy of the human retina by projection-resolved optical coherence tomography angiography. Sci Rep. 2017;7 - PMC - PubMed
    1. Schmidt M., Giessl A., Laufs T., Hankeln T., Wolfrum U., Burmester T. How does the eye breathe? Evidence for neuroglobin-mediated oxygen supply in the mammalian retina. J Biol Chem. 2003;278:1932–1935. - PubMed