

Enhanced optical imaging and fluorescent labeling for visualizing drug molecules within living organisms
- PMID: 38828150
- PMCID: PMC11143489
- DOI: 10.1016/j.apsb.2024.01.018
Enhanced optical imaging and fluorescent labeling for visualizing drug molecules within living organisms
Abstract
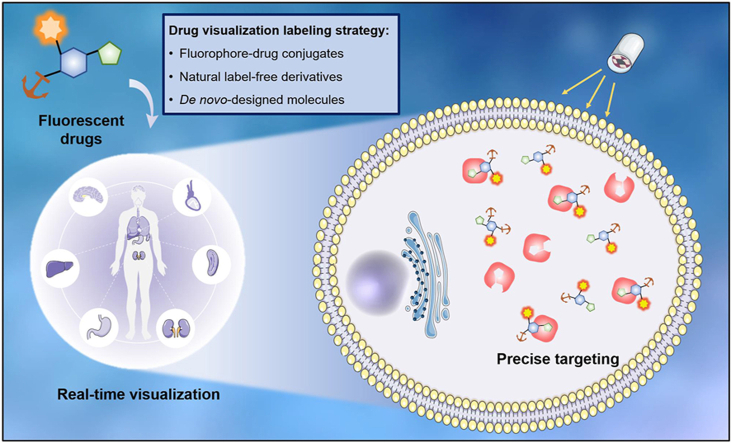
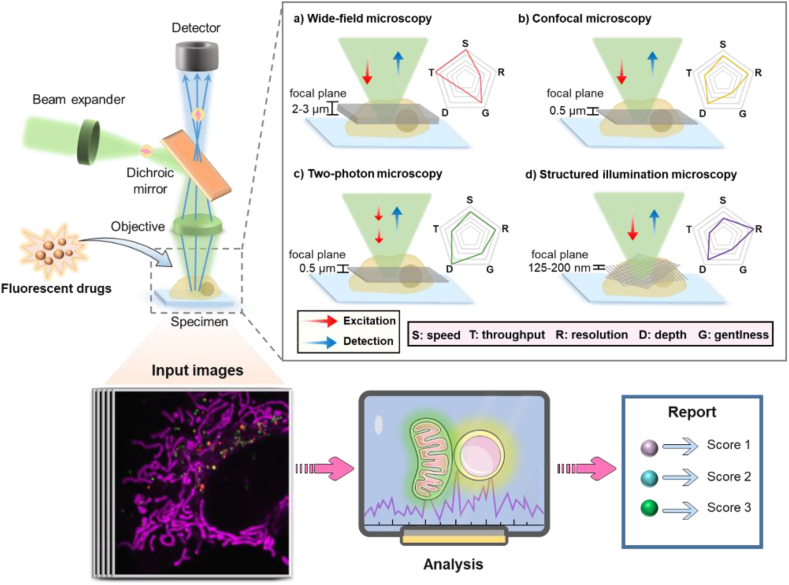
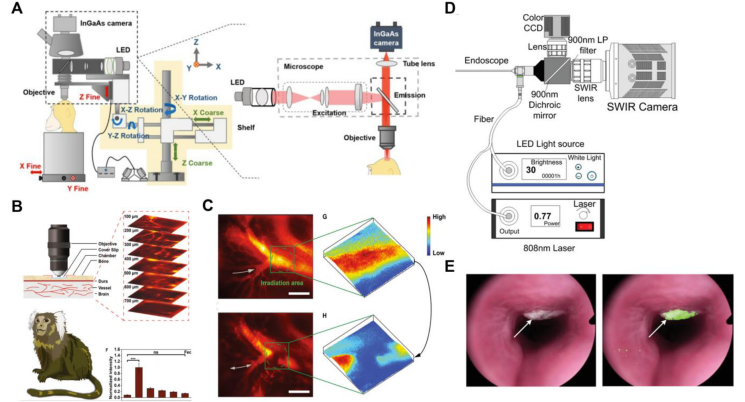
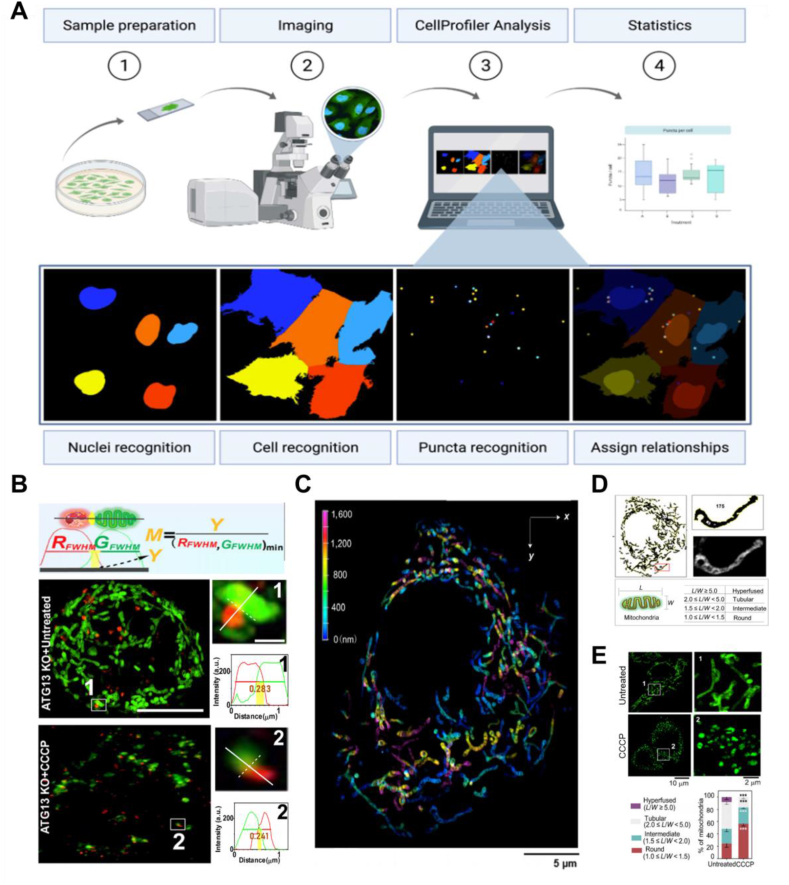
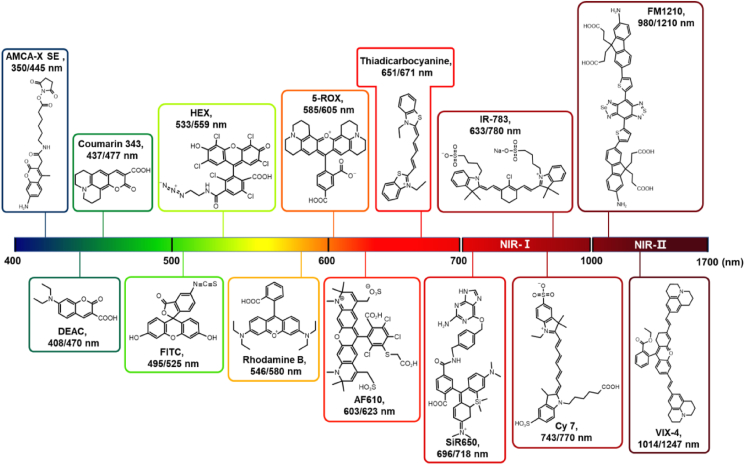
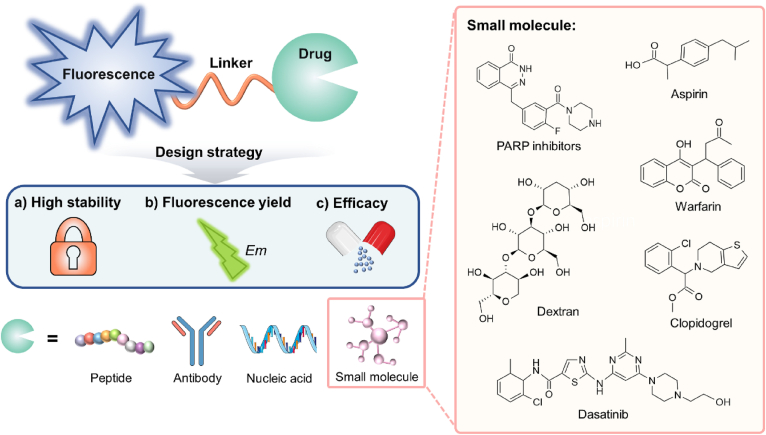
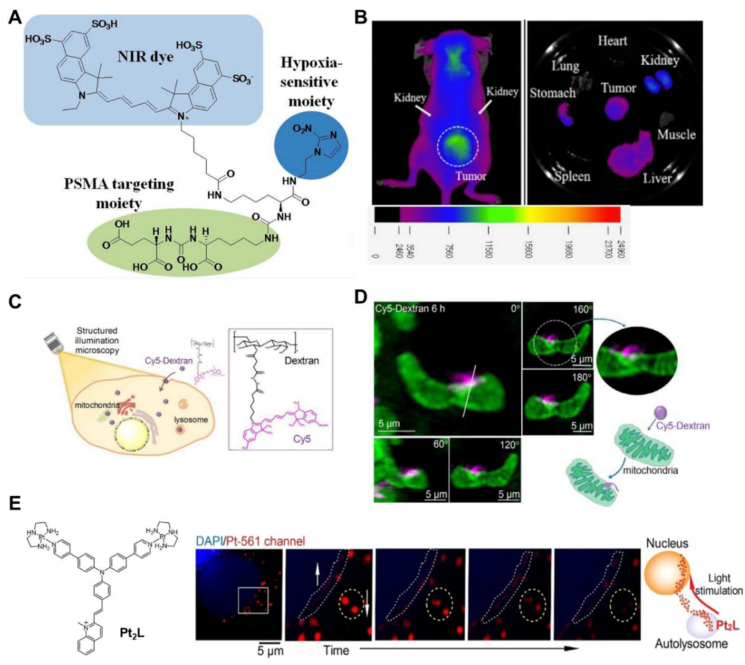
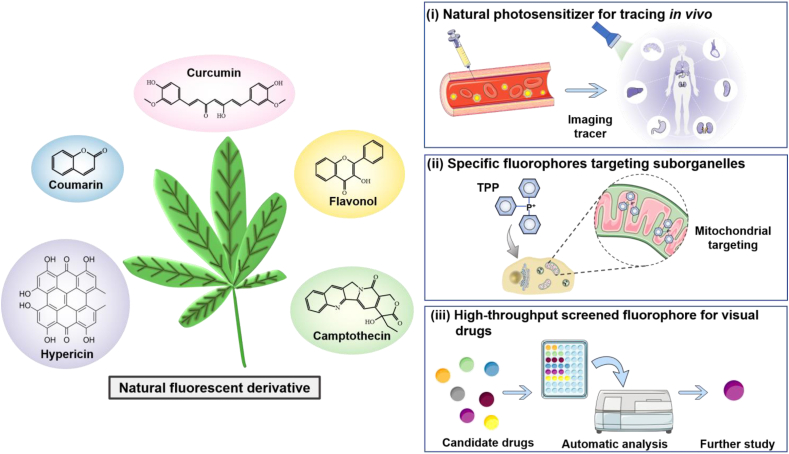
The visualization of drugs in living systems has become key techniques in modern therapeutics. Recent advancements in optical imaging technologies and molecular design strategies have revolutionized drug visualization. At the subcellular level, super-resolution microscopy has allowed exploration of the molecular landscape within individual cells and the cellular response to drugs. Moving beyond subcellular imaging, researchers have integrated multiple modes, like optical near-infrared II imaging, to study the complex spatiotemporal interactions between drugs and their surroundings. By combining these visualization approaches, researchers gain supplementary information on physiological parameters, metabolic activity, and tissue composition, leading to a comprehensive understanding of drug behavior. This review focuses on cutting-edge technologies in drug visualization, particularly fluorescence imaging, and the main types of fluorescent molecules used. Additionally, we discuss current challenges and prospects in targeted drug research, emphasizing the importance of multidisciplinary cooperation in advancing drug visualization. With the integration of advanced imaging technology and molecular design, drug visualization has the potential to redefine our understanding of pharmacology, enabling the analysis of drug micro-dynamics in subcellular environments from new perspectives and deepening pharmacological research to the levels of the cell and organelles.
Keywords: Drug visualization; Fluorophore labeling; Optical imaging; Therapeutics.
© 2024 The Authors.
Conflict of interest statement
We declare that we have no financial or personal relationships with other people or organizations that can inappropriately influence our work.
Figures
Similar articles
-
[Comparison and progress review of various super-resolution fluorescence imaging techniques].Se Pu. 2021 Oct;39(10):1055-1064. doi: 10.3724/SP.J.1123.2021.06015. Se Pu. 2021. PMID: 34505427 Free PMC article. Review. Chinese.
-
Subcellular visualization: Organelle-specific targeted drug delivery and discovery.Adv Drug Deliv Rev. 2023 Aug;199:114977. doi: 10.1016/j.addr.2023.114977. Epub 2023 Jun 28. Adv Drug Deliv Rev. 2023. PMID: 37391014 Review.
-
Molecular probes for super-resolution imaging of drug dynamics.Adv Drug Deliv Rev. 2024 Jul;210:115330. doi: 10.1016/j.addr.2024.115330. Epub 2024 May 10. Adv Drug Deliv Rev. 2024. PMID: 38735627 Review.
-
Surpassing the Diffraction Limit in Label-Free Optical Microscopy.ACS Photonics. 2024 Aug 27;11(10):3907-3921. doi: 10.1021/acsphotonics.4c00745. eCollection 2024 Oct 16. ACS Photonics. 2024. PMID: 39429866 Free PMC article. Review.
-
Role of in vivo imaging in Head and Neck cancer management.Oral Oncol. 2023 Nov;146:106575. doi: 10.1016/j.oraloncology.2023.106575. Epub 2023 Sep 22. Oral Oncol. 2023. PMID: 37741020
Cited by
-
Analysis of Personalized Cardiovascular Drug Therapy: From Monitoring Technologies to Data Integration and Future Perspectives.Biosensors (Basel). 2025 Mar 17;15(3):191. doi: 10.3390/bios15030191. Biosensors (Basel). 2025. PMID: 40136988 Free PMC article. Review.
-
Multifunctional quantum dot-decorated drug-loaded magnetite nanosystem for dual optical-magnetic resonance imaging and drug delivery.RSC Adv. 2025 Jun 23;15(27):21269-21283. doi: 10.1039/d5ra03379a. eCollection 2025 Jun 23. RSC Adv. 2025. PMID: 40556697 Free PMC article.
-
Imaging the Binding Between Dasatinib and Its Target Protein in Living Cells Using an SLP Tag System on Intracellular Compartments.Int J Mol Sci. 2025 Jun 13;26(12):5705. doi: 10.3390/ijms26125705. Int J Mol Sci. 2025. PMID: 40565169 Free PMC article.
-
DyeLeS: a web platform for predicting and classifying fluorescence properties of bioactive molecules.RSC Adv. 2025 Jun 27;15(27):21977-21986. doi: 10.1039/d5ra03164h. eCollection 2025 Jun 23. RSC Adv. 2025. PMID: 40584761 Free PMC article.
References
-
- Zhao Z., Ukidve A., Kim J., Mitragotri S. Targeting strategies for tissue-specific drug delivery. Cell. 2020;181:151–167. - PubMed
-
- Li T., Guo R., Zong Q., Ling G. Application of molecular docking in elaborating molecular mechanisms and interactions of supramolecular cyclodextrin. Carbohydr Polym. 2022;276 - PubMed
-
- Renaud J.P., Chung C.W., Danielson U.H., Egner U., Hennig M., Hubbard R.E., et al. Biophysics in drug discovery: impact, challenges and opportunities. Nat Rev Drug Discov. 2016;15:679–698. - PubMed
-
- Prescher J.A., Contag C.H. Guided by the light: visualizing biomolecular processes in living animals with bioluminescence. Curr Opin Chem Biol. 2010;14:80–89. - PubMed
Publication types
LinkOut - more resources
Full Text Sources
