. 2024 May 31;14(25):17557-17570.
doi: 10.1039/d4ra01556h. eCollection 2024 May 28.

The synthesis and evaluation of novel ALK inhibitors containing the sulfoxide structure

Affiliations

The synthesis and evaluation of novel ALK inhibitors containing the sulfoxide structure

Han Yao et al. RSC Adv. .

Abstract

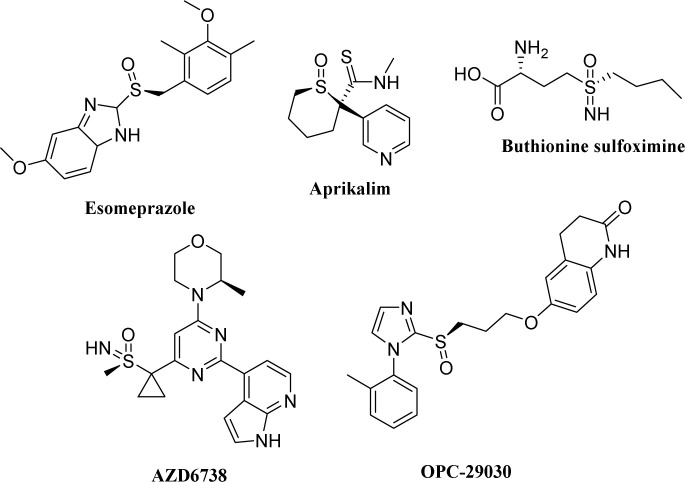
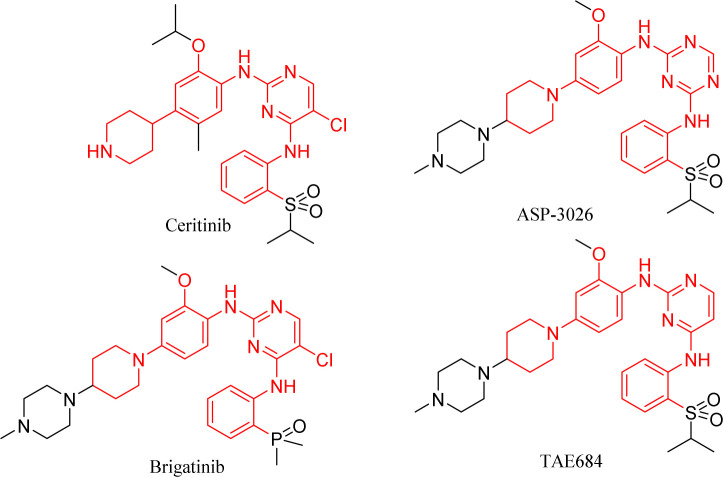
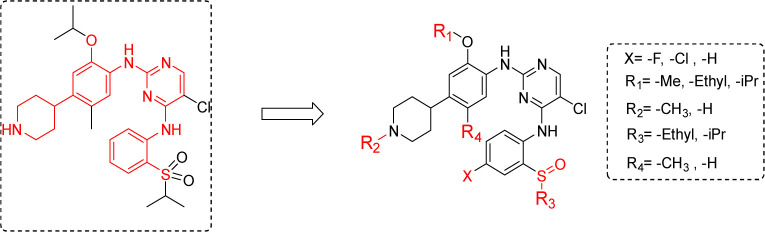
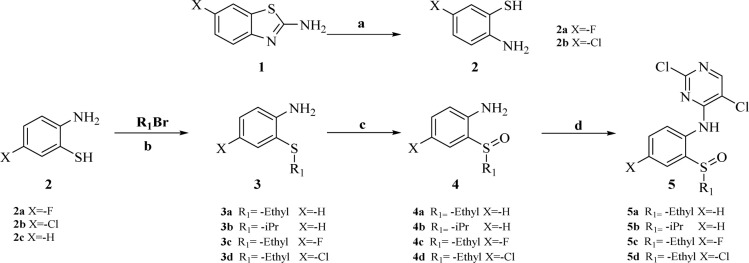
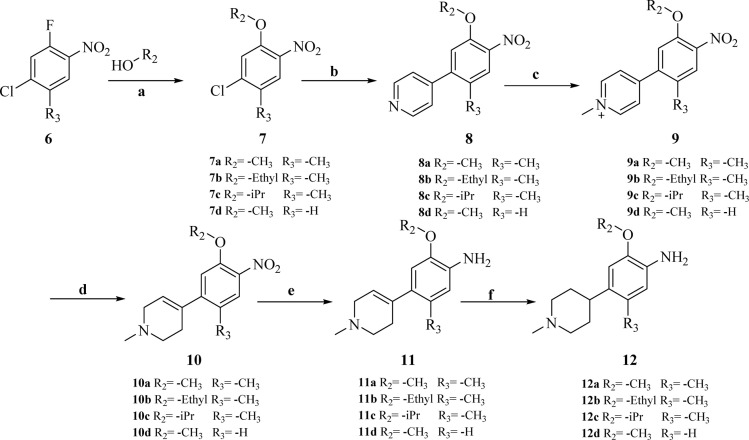
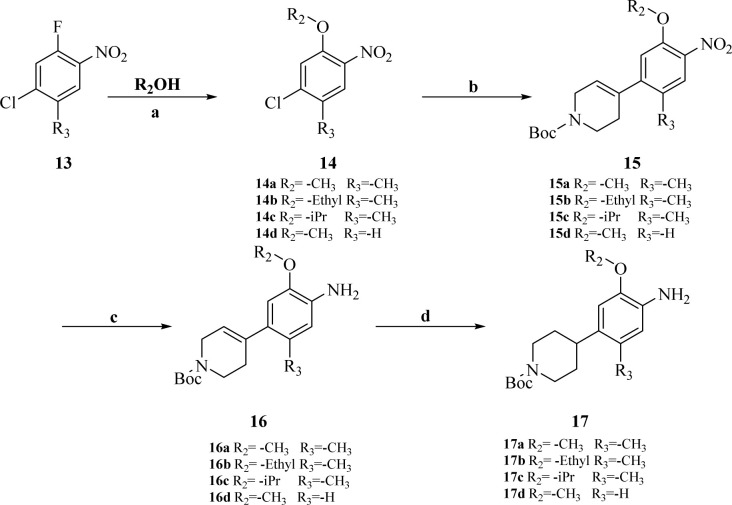
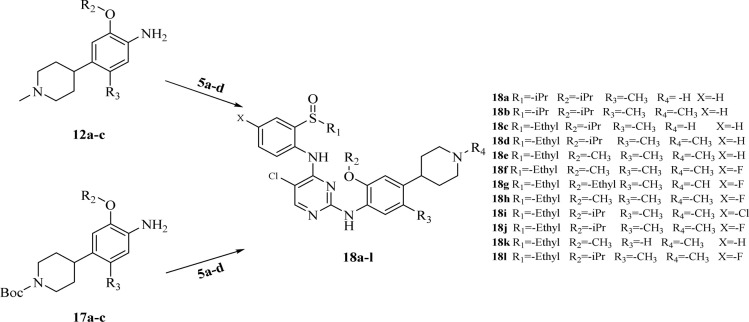
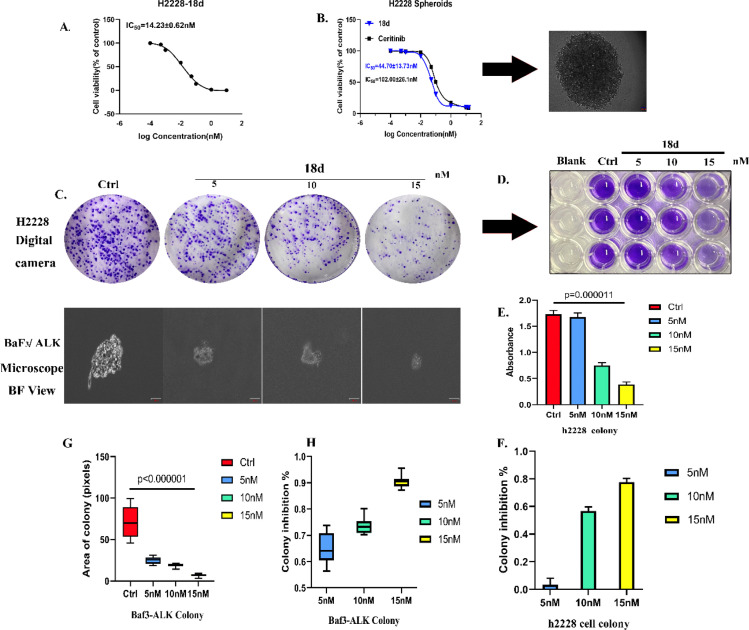
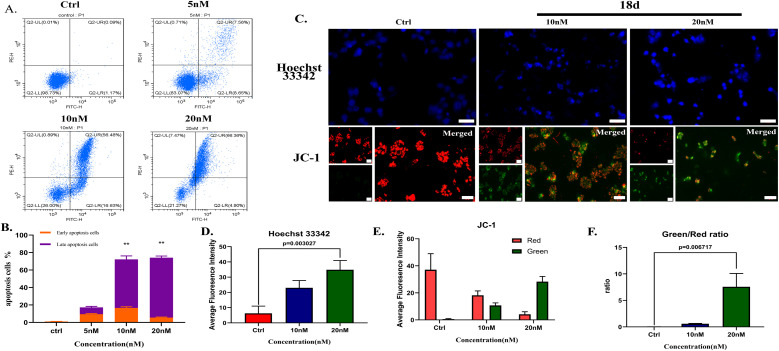
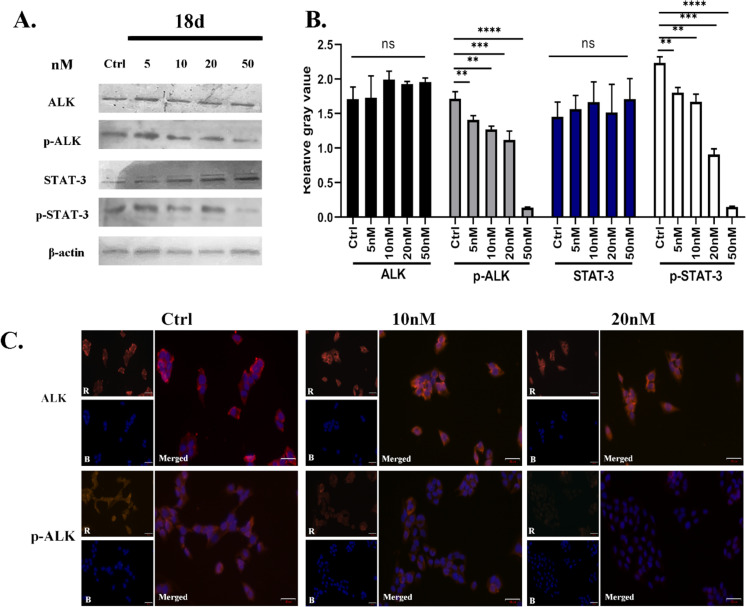
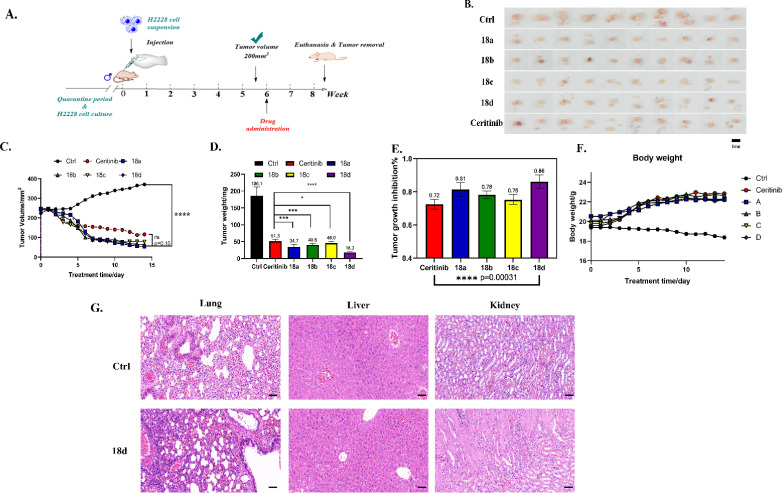
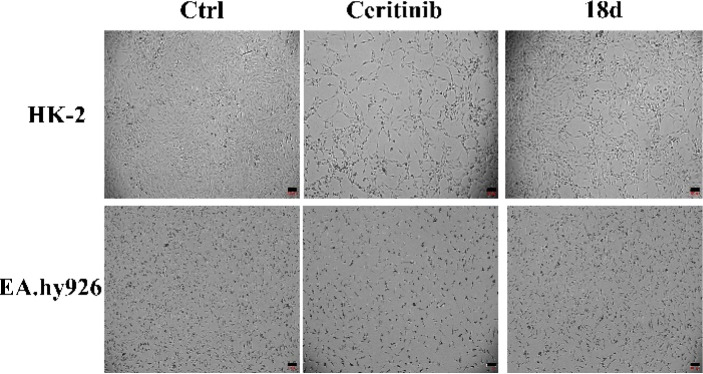
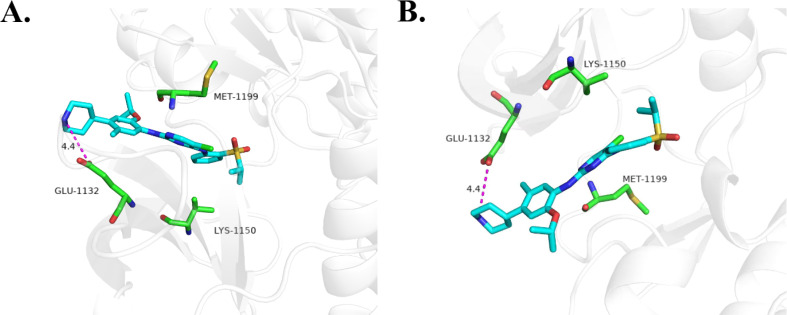
With ceritinib as the lead, a series of novel compounds containing the sulfoxide structure were synthesized and evaluated as anaplastic lymphoma kinase inhibitors. Among them, compounds 18a-d exhibited excellent anti-proliferation activities on H2228 EML4-ALK cancer cell lines with 14-28 nM of the IC50 values. In xenograft mouse models, 18a-d inhibited tumor growth with an excellent inhibitory rate of 75.0% to 86.0% at the dosage of 20 mg kg-1 as compared to 72.0% of the reference ceritinib. Using 18d as a representative, which exhibited the best in vivo results, we carried out mechanistic studies such as anti-colony formation, induced tumor cell apoptosis, ALK kinase protein phosphorylation in H2228 tumor cells, and molecular docking. All these results indicate that compound 18d is a good anti-tumor lead compound and worthy of further study.


Conflict of interest statement

There are no conflicts to declare.

Figures

Fig. 1
Fig. 1. Drugs containing sulfoxide.
Fig. 2
Fig. 2. Representative ALK inhibitors.
Fig. 3
Fig. 3. The modification strategy of the new ALK inhibitors.
Scheme 1
Scheme 1. Synthesis of intermediates 2a, 2b, and 5a–d. Reagents and conditions: (a) NaOH (aq., 2 mol L−1), reflux; (b) NaOH, MeOH, rt. (c) AcOH, H2O2, 0 °C. (d) NaH, 2,4,5-trichloropyrimidine, DMF, 0 °C.
Scheme 2
Scheme 2. Synthesis of intermediates 12a–d. Reagents and conditions: (a) K2CO3, reflux. (b) K2CO3, pyridin-4-ylboronic acid, Pd(PPh3)Cl2, dioxane, H2O. (c) MeCN, MeI. (d) MeOH, NaBH4, 0 °C. (e) SnCl2, HCl, MeOH/DCM = 1 : 1, reflux. (f) 10% Pd/C, H2, 40 bar, 50 °C.
Scheme 3
Scheme 3. Synthesis of intermediates 17a–c. Reagents and conditions: (a) K2CO3, reflux. (b) K2CO3, (1-(tert-butoxycarbonyl)-1,2,3,6-tetrahydropyridin-4-yl)boronic acid Pd(PPh3)Cl2, dioxane, H2O. (c) SnCl2, HCl, MeOH/DCM = 1 : 1, reflux. (d) 10% Pd/C, H2, 40 bar, 50 °C.
Scheme 4
Scheme 4. Synthesis of target compounds 18a–l. Reagents and conditions: TFA, isopropyl alcohol, reflux.
Fig. 4
Fig. 4. (A) The concentration of 18d and the H2228 monolayer model viability curve. (B) The concentration of 18d or ceritinib and the H2228 spheroid model viability curve; the photograph shows the spheroids under a 4× objective. (C) Representative images of H2228 plate colony formation and BaF3/ALK soft agar colony formation results; the scale bar represents 50 μm and the colony formation images of Baf3 cells were obtained using a 20× objective microscope. (D) 33% acetic acid eluted the color of H2228 cells stained with crystal violet. (E) The absorbance values of each group of H2228 after elution using a microplate reader. (F) The inhibitory effects of compound 18d at different concentrations calculated using absorbance values of the H2228 cell colony. (G) Ten randomly selected fields of view under a 20× objective; photographs of the formed colony cell clusters were taken and image J was used to calculate the area of the colony sphere. A plot of the size of the colony clusters formed by Baf3-ALK cells under different concentrations of 18d intervention. (H) The colony inhibition rates of 18d at various concentrations based on the colony area. The data was shown as mean ± SD and the unpaired two-way t-test (assuming all data with the same scatter) was used to determine the levels of significance between comparable samples. p > 0.05 was not significant (ns). *p < 0.05; **p < 0.01; ***p < 0.001; ****p < 0.0001.
Fig. 5
Fig. 5. (A & B) Flow cytometry results and statistics of PI/FITC double staining after treatment with different concentrations of 18d. (C) H2228 cells cultured with or without 18d for 48 h, then stained with Hoechst 33342 and photographed by fluorescence microscopy; the scale bar is 50 μm. (D) After JC-1 staining, H2228 cells were observed and photographed using the 10× objective of the fluorescence microscope under the U, B, and G channels; the scale bar is 100 μm. (E) The average fluorescence intensity of green and red channels of each group. (F) The green/red ratio of each group. The data are shown as the mean ± SD, and the unpaired two-way t-test (assuming all data with the same scatter) was used to determine the levels of significance between comparison samples. p > 0.05 was not significant (ns). *p < 0.05; **p < 0.01; ***p < 0.001; ****p < 0.0001.
Fig. 6
Fig. 6. (A & B) Changes in ALK, p-ALK, STAT-3, and p-STAT-3 protein bands in H2228 cells. (C) The changes in ALK and p-ALK in H2228 cells in the presence of 18d. The scale bar is 50 μm. The data are shown as the mean ± SD, and the unpaired two-way t-test (assuming all data with the same scatter) was used to determine the levels of significance between comparison samples. p > 0.05 was not significant (ns). *p < 0.05; **p < 0.01; ***p < 0.001; ****p < 0.0001.
Fig. 7
Fig. 7. (A) The cell cycle of H2228 cells after treatment with different doses of 18d. (B) The ratio of each cell stage in the whole cell cycle. (C) The ratio changes at each stage after the intervention with different concentrations of 18d.
Fig. 8
Fig. 8. (A) Experimental procedures and time points. (B) Images of tumors in each group. The scale bar is 1 cm. (C) The changes in the tumor volumes of nude mice in each group. The data were analyzed by the unpaired t-test (GraphPad Prism 8), and there were significant differences between the control group and 18a–d, P < 0.0001. (D) The weights of tumors in each group. (E) Growth inhibition rate (TGI) of tumors in each group. (F) The body weight of each group after treatment. (G) Control and 18d H&E staining results for the kidney, liver, and lung. The scale bar is 50 μm. The data are shown as the mean ± SD, and the unpaired two-way t-test (assuming all data with the same scatter) was used to determine the levels of significance between comparison samples. p > 0.05 was not significant (ns). *p < 0.05; **p < 0.01; ***p < 0.001; ****p < 0.0001.
Fig. 9
Fig. 9. HK-2 and EA.hy926 cell morphology when cultured with ceritinib or 18d (both 1 μM), the scale bar is 100 μm.
Fig. 10
Fig. 10. (A) Molecular docking of 18d with ALK kinase. (B) Molecular docking of ceritinib with ALK kinase.

Similar articles

Cited by

References

    1. Lin J. J. Riely G. J. Shaw A. T. Targeting ALK: Precision Medicine Takes on Drug Resistance. Cancer Discovery. 2017;7(2):137–155. doi: 10.1158/2159-8290.CD-16-1123. - DOI - PMC - PubMed
    1. Li T. Stayrook S. E. Tsutsui Y. et al., Structural basis for ligand reception by anaplastic lymphoma kinase. Nature. 2021;600(7887):148–152. doi: 10.1038/s41586-021-04141-7. - DOI - PMC - PubMed
    1. Reshetnyak A. V. Rossi P. Myasnikov A. G. et al., Mechanism for the activation of the anaplastic lymphoma kinase receptor. Nature. 2021;600(7887):153–157. doi: 10.1038/s41586-021-04140-8. - DOI - PMC - PubMed
    1. Haratake N. Toyokawa G. Seto T. et al., The mechanisms of resistance to second- and third-generation ALK inhibitors and strategies to overcome such resistance. Expert Rev. Anticancer Ther. 2021;21(9):975–988. doi: 10.1080/14737140.2021.1940964. - DOI - PubMed
    1. Barrows S. M. Wright K. Copley-Merriman C. et al., Systematic review of sequencing of ALK inhibitors in ALK-positive non-small-cell lung cancer. Lung Cancer. 2019;10:11–20. - PMC - PubMed