. 2024 Nov 4;26(11):1994-2009.
doi: 10.1093/neuonc/noae101.

Raman-based machine-learning platform reveals unique metabolic differences between IDHmut and IDHwt glioma

Affiliations

Raman-based machine-learning platform reveals unique metabolic differences between IDHmut and IDHwt glioma

Adrian Lita et al. Neuro Oncol. .

Erratum in

Abstract

Background: Formalin-fixed, paraffin-embedded (FFPE) tissue slides are routinely used in cancer diagnosis, clinical decision-making, and stored in biobanks, but their utilization in Raman spectroscopy-based studies has been limited due to the background coming from embedding media.

Methods: Spontaneous Raman spectroscopy was used for molecular fingerprinting of FFPE tissue from 46 patient samples with known methylation subtypes. Spectra were used to construct tumor/non-tumor, IDH1WT/IDH1mut, and methylation-subtype classifiers. Support vector machine and random forest were used to identify the most discriminatory Raman frequencies. Stimulated Raman spectroscopy was used to validate the frequencies identified. Mass spectrometry of glioma cell lines and TCGA were used to validate the biological findings.

Results: Here, we develop APOLLO (rAman-based PathOLogy of maLignant gliOma)-a computational workflow that predicts different subtypes of glioma from spontaneous Raman spectra of FFPE tissue slides. Our novel APOLLO platform distinguishes tumors from nontumor tissue and identifies novel Raman peaks corresponding to DNA and proteins that are more intense in the tumor. APOLLO differentiates isocitrate dehydrogenase 1 mutant (IDH1mut) from wild-type (IDH1WT) tumors and identifies cholesterol ester levels to be highly abundant in IDHmut glioma. Moreover, APOLLO achieves high discriminative power between finer, clinically relevant glioma methylation subtypes, distinguishing between the CpG island hypermethylated phenotype (G-CIMP)-high and G-CIMP-low molecular phenotypes within the IDH1mut types.

Conclusions: Our results demonstrate the potential of label-free Raman spectroscopy to classify glioma subtypes from FFPE slides and to extract meaningful biological information thus opening the door for future applications on these archived tissues in other cancers.

Keywords: FFPE tissue; Raman spectroscopy; glioma; lipid metabolism; machine learning.


Conflict of interest statement

None declared.

Figures

Graphical Abstract
Graphical Abstract
Figure 1.
Figure 1.
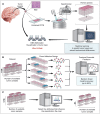
Overview of APOLLO. A. Our study design involves: 1) stain FFPE adjacent slides H&E staining to confirm tumor from the region of interest, 2) confirm methylation subtype, and 3) analyze the samples using spontaneous Raman spectroscopy. B. The machine learning training design. The dataset consists of the Raman spectra of each tumor spot, together with its methylation label (IDH1 mutant, or wild type, LGm1 or LGm2). Because the data are often imbalanced, i.e., one class is significantly more populated with than the other, we split the data into 5 disjoint datasets in preparation for the 5-fold cross-validation training of the machine learning model. To avoid data leakage, we used a tumor-stratified approach: a sample contributes all its spots to a single subset. The data distribution in each subset roughly follows the distribution of the entire dataset. We run a 5-fold cross-validation, training 5 separate random forest models, using each of the 5 subsets as the validation set, one by one, with the other 4 as training sets. The predictions of the 5 separate random forest models are combined into the final random forest model. C. The model is further boosted by training a support vector classifier on its 20 most important Raman frequencies.
Figure 2.
Figure 2.
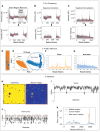
Pre-processing steps, artifact removal, and validation of tumor versus nontumor spectra. A. Remove silent region. The top graph shows the regions of the spectra to be removed and the bottom graph shows the overlaid spectra after the regions were removed. B. Example of baseline correction. The top graph illustrates the application of a polynomial function to correct the baseline (black line), and the bottom graph shows the overlaid spectra after the baseline was corrected. C. Spectral normalization. The top and bottom graphs show the data before and after normalization. The data were normalized by dividing the spectral intensities by the individual L2-norm of the spectra. Viewed as vectors, each spectrum had a norm of 1 after this step. The spectra in sample HF-1887 deviated significantly from those of the other samples, so we removed it from the dataset. D-G. Artifact removal steps. D, Spatial representation of the clusters; the tumor cluster is orange, and the nontumor is blue. E, Principal component analysis of the tumor (orange) versus nontumor (blue) clusters to visualize the separation between the spectra. Overlayed Raman spectra separated by clustering for the tumor (F, orange) and the nontumor (G, blue) subsets. H-K, Validations steps. H, DBSCAN clustering is shown as a 2D spatial representation with the yellow part representing the tumor cluster and the purple part as the nontumor cluster (H, left). It is compared with 2D mapping of the same region obtained using a correlation function on the OMNICSTM software provided by the instrument (H, right). A visual inspection is done to ensure similarity between the images. The silhouette indices for (I) the tumor spectra and (J) the nontumor spectra. Each boxplot corresponds to a sample. The points belonging to each boxplot correspond to the Raman spectra for the respective samples. The boxplot in which the median of its tumor spectra is close to 0 corresponds to sample HF-1887, which was later removed. K, Colored lines represent the median spectrum over the entire dataset (blue line), over the tumor areas (red line), and over the nontumor areas (yellow line). The shape of the tumor median is almost identical to that of the global median, while the nontumor median diverges from the global median.
Figure 3.
Figure 3.
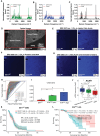
Identification and validation of most discriminative Raman frequencies for tumor versus nontumor. The analysis was done with (A) ANOVA, (B) Chi2, and (C) a random forest model, using a 5-fold cross-validation strategy with oversampling to compensate for the data imbalance as described in Figure 1B. D-R, Validation of discriminative frequencies using sample HF-1086 (LGm5-IDHwt). D, Optical image of the sample HF-1086 delineates the tumor tissue from the FFPE part. The red square indicates the areas that are shown in the following images. E, Autofluorescence of the using excitation at 641 nm and an emission window of 650-750 nm. F, The same image using fluorescence lifetime imaging (FLIM). G, Representative H&E staining of the adjacent slice from the same sample (HF-1086) to show the presence of tumor cells in the tissue. The scale is 500 mm. H, SRS image for 2930 cm−1 Raman frequency corresponding to CH3 bonds that predominate in proteins and DNA, and that was found to distinguish tumors from normal cells. I. SRS image for 2845 cm−1, the Raman frequency that corresponds to CH2 bonds that are abundant in lipids and that was found to distinguish tumor from normal cells., J and K, Spectral processing of SRS 2845 and 2930 cm−1 to match the tumor-nontumor delineation, using stimulated Raman histology., In J, the SRS image of 2845 cm−1 was subtracted from the SRS image of 2930 cm−1 and colored in blue; then it was overlayed with the SRS image of 2845 cm−1 which was colored in green. In K, 3 images are overlayed: the SRS image of 2845 cm−1 subtracted from the SRS image of 2930 cm−1 (red) is overlayed with the SRS image of 2845 cm−1 (green), and with SRS 2930 cm−1 (blue) as previously described, to produce stimulated Raman histology., l, SRS image for 2883 cm−1 identified by APOLLO to best in discriminate tumor from nontumor. M, SRS image for 1335 cm−1. N, The ratio between images corresponding to SRS 1335 cm−1 and SRS 2883 cm−1, identified by APOLLO. It clearly highlights the areas of tumors from FFPE and seen in D. O, SRS image for 2850 cm−1 identified by the APOLLO to have the second highest score in discriminating tumor from nontumor P, SRS image for 1607 cm−1. R, The ratio between images corresponding to SRS 1607 cm−1 and SRS 2850 cm−1, overlayed with the tissue autofluorescence. The image highlights the areas of tumor from FFPE seen in D.
Figure 4.
Figure 4.
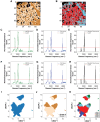
Identification and validation of the most discriminative Raman frequencies in our dataset that distinguish IDH1WT versus IDH1mut. The analysis was done with: A. ANOVA, B. Chi2, and C. a random forest model. D, Left: Optical image of the sample HF-1002-V2AT (LGm4 IDH1wt) distinguishes the tumor tissue from the FFPE part. Right: Optical image of the sample HF-2070-V1T (LGm2 IDH1mut) distinguishes the tumor tissue from the FFPE part. The red square indicates the area shown in the following images. Panels E-G are shown at the same scale and acquired under identical conditions. E, SRS of 2970 cm−1 for IDH1wt (left) and IDH1mut (right). F, SRS of 2930 cm−1 for IDH1wt (left) and IDH1mut (right). G, SRS of 2883 cm−1 for IDH1wt (left) and IDH1mut (right). H, ROC statistics to evaluate the performance of the classification. The analysis was done using a 5-fold cross-validation strategy with oversampling to compensate for the data imbalance. I, Cholesterol levels in IDHWT and IDHmut cell lines measured by mass spectrometry. Statistics were determined using Graph Prism 10 and paired t-test. P values lower than 0.05 are denoted with *P < 0.05; **P < 0.005; and ***P < 0.0005. J, mRNA expression of acetyl-CoA acetyltransferase (ACAT1) for IDH1wt (cyan) and IDH1mut (orange) from TCGA. K and L, Kaplan-Maier survival plots using TCGA data for glioblastoma (IDH1wt)(K) and low-grade gliomas (IDH1mut)(L) to show the different effect of ACAT1 expression on survival of patients with those tumor types. Graphs for J, K, and L were produced using GlioVis.
Figure 5.
Figure 5.
APOLLO discriminates between different IDH1mut subtypes and reveals intratumor heterogeneity. The graphs show the most discriminative Raman frequencies for classifying IDH1mut G-CIMP-high and IDH1mut G-CIMP-low. The analysis was done with: A. ANOVA, B. Chi2, and C. a random forest model using a 5-fold cross-validation strategy with oversampling to compensate for the data imbalance. D. Area under the precision-recall curves (AUPR) to evaluate the performance of the classification. E. F, Comparison of 2 samples: an IDH1mut G-CIMP-high (E, F, G, left panel) and IDH1mut G-CIMP-low (E, F, G right panel) for the highest scored frequencies-SRS 2836 cm−1 (F), SRS 2887 cm−1 (G), and the associated optical image (E).
Figure 6.
Figure 6.
APOLLO reveals intratumor heterogeneity. The surface of sample HF 2106 is separated by the binary clustering model (A) and the 6-cluster model (B). Both models show distinct shapes on the tumor surface. The most important features of the spectra, separated into 2 clusters are shown in (C-E) where ANOVA, Chi2, and Random Forest feature importance is displayed in that order. The same is shown for the 6-cluster model in (F-H). The biggest Raman peaks in the spectra are present as the most important features through all methods. The UMAP dimensionality reduction is displayed in (I), showing 4 apparent regions which the data can be organized into. The binary separation using the binary cluster model is shown in (J) and the 6-cluster separation is in (K). In both clustering models, the 2 smaller areas in the UMAP plot consist of a single cluster.

References

    1. Louis DN, Ohgaki H, Wiestler OD, et al. The 2007 WHO classification of tumours of the central nervous system. Acta Neuropathol. 2007;114(2):97–109. - PMC - PubMed
    1. Yan H, Parsons DW, Jin G, et al. IDH1 and IDH2 mutations in gliomas. N Engl J Med. 2009;360(8):765–773. - PMC - PubMed
    1. Cohen AL, Holmen SL, Colman H.. IDH1 and IDH2 mutations in gliomas. Curr Neurol Neurosci Rep. 2013;13(5):345. - PMC - PubMed
    1. Louis DN, Perry A, Reifenberger G, et al. The 2016 World Health Organization Classification of Tumors of the Central Nervous System: a summary. Acta Neuropathol. 2016;131(6):803–820. - PubMed
    1. Louis DN, Perry A, Wesseling P, et al. The 2021 WHO classification of tumors of the central nervous system: a summary. Neuro-Oncology. 2021;23(8):1231–1251. - PMC - PubMed