

Making Drug Approval Decisions in the Face of Uncertainty: Cumulative Evidence versus Value of Information
- PMID: 38828516
- PMCID: PMC11283736
- DOI: 10.1177/0272989X241255047
Making Drug Approval Decisions in the Face of Uncertainty: Cumulative Evidence versus Value of Information
Abstract
Background: The COVID-19 pandemic underscored the criticality and complexity of decision making for novel treatment approval and further research. Our study aims to assess potential decision-making methodologies, an evaluation vital for refining future public health crisis responses.
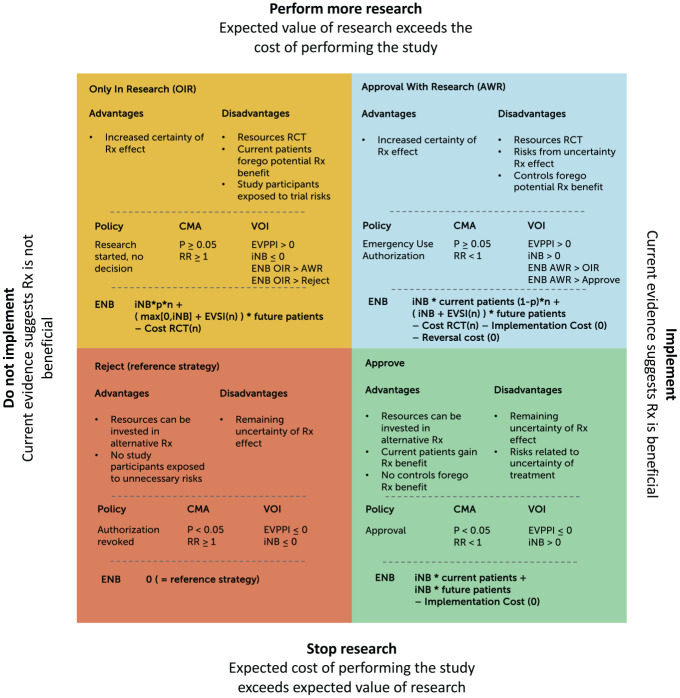
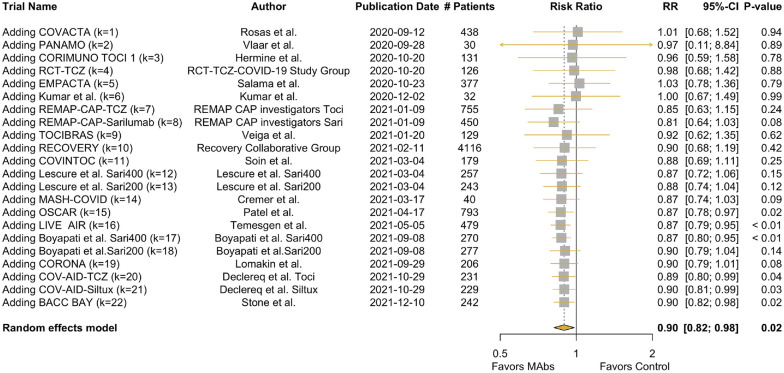
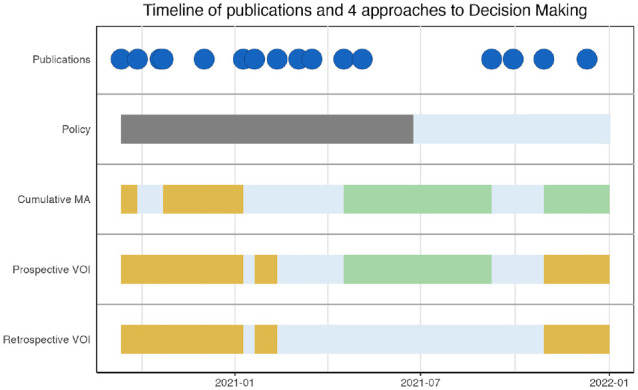
Methods: We compared 4 decision-making approaches to drug approval and research: the Food and Drug Administration's policy decisions, cumulative meta-analysis, a prospective value-of-information (VOI) approach (using information available at the time of decision), and a reference standard (retrospective VOI analysis using information available in hindsight). Possible decisions were to reject, accept, provide emergency use authorization, or allow access to new therapies only in research settings. We used monoclonal antibodies provided to hospitalized COVID-19 patients as a case study, examining the evidence from September 2020 to December 2021 and focusing on each method's capacity to optimize health outcomes and resource allocation.
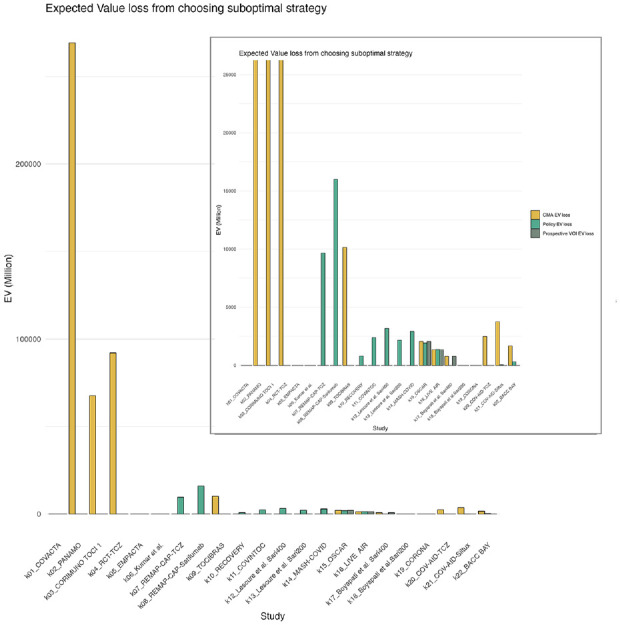
Results: Our findings indicate a notable discrepancy between policy decisions and the reference standard retrospective VOI approach with expected losses up to $269 billion USD, suggesting suboptimal resource use during the wait for emergency use authorization. Relying solely on cumulative meta-analysis for decision making results in the largest expected loss, while the policy approach showed a loss up to $16 billion and the prospective VOI approach presented the least loss (up to $2 billion).
Conclusion: Our research suggests that incorporating VOI analysis may be particularly useful for research prioritization and treatment implementation decisions during pandemics. While the prospective VOI approach was favored in this case study, further studies should validate the ideal decision-making method across various contexts. This study's findings not only enhance our understanding of decision-making strategies during a health crisis but also provide a potential framework for future pandemic responses.
Highlights: This study reviews discrepancies between a reference standard (retrospective VOI, using hindsight information) and 3 conceivable real-time approaches to research-treatment decisions during a pandemic, suggesting suboptimal use of resources.Of all prospective decision-making approaches considered, VOI closely mirrored the reference standard, yielding the least expected value loss across our study timeline.This study illustrates the possible benefit of VOI results and the need for evidence accumulation accompanied by modeling in health technology assessment for emerging therapies.
Keywords: COVID-19; antibodies; cost-benefit analysis; decision support techniques; drug approval; meta-analysis; monoclonal; policy analyses.
Conflict of interest statement
The authors declared the following potential conflicts of interest with respect to the research, authorship, and/or publication of this article: Dr. Dijk reports grants from the Gordon and Betty Moore Foundation during the conduct of the study and grants from the German Innovation Fund outside the submitted work. Dr. Krijkamp reports grants and personal fees from the Society for Medical Decision Making fellowship through a grant from the Gordon and Betty Moore Foundation (GBMF7853) outside the submitted work. Dr. Kunst has nothing to disclose. Dr. Gross reports grants from the American Cancer Society, Johnson & Johnson, Pfizer, Flatiron Health, and Genentech outside the submitted work. Dr. Labrecque is supported by an NWO/ZonMW Veni grant (09150162010213). Mrs. Pandit has nothing to disclose. Ms. Lu has nothing to disclose. Dr. Visser has nothing to disclose. Dr. Wong has nothing to disclose. Dr. Hunink reports grants from the Gordon and Betty Moore Foundation during the conduct of the study; other support from the European Society of Radiology, the European Institute for Biomedical Imaging Research, and Cambridge University Press; grants from the American Diabetes Association, the Netherlands Organization for Health Research and Development, the German Innovation Fund, and the Netherlands Educational Grant (“Studie Voorschot Middelen”) outside the submitted work. The authors disclosed receipt of the following financial support for the research, authorship, and/or publication of this article: This research was funded by the Gordon and Betty Moore Foundation through grant GBMF9634 to Johns Hopkins University to support the work of the Society for Medical Decision Making COVID-19 Decision Modeling Initiative. The funding sources played no role in the writing or submission of this article. The funding agreement ensured the authors’ independence in designing the study, interpreting the data, writing, and publishing the report.
Figures
References
-
- Claxton K, Sculpher M, Drummond M. A rational framework for decision making by the National Institute for Clinical Excellence (NICE). Lancet. 2002;360(9334):711–5. - PubMed
-
- Claxton K, Palmer S, Longworth L, et al. A comprehensive algorithm for approval of health technologies with, without, or only in research: the key principles for informing coverage decisions. Value Health. 2016;19(6):885–91. - PubMed
-
- Johns Hopkins University. COVID-19 data repository by the Center for Systems Science and Engineering (CSSE) at Johns Hopkins University. 2020. Available from: https://github.com/CSSEGISandData/COVID-19 [Accessed 11 November, 2020].
-
- Claxton K, Griffin S, Koffijberg H, McKenna C. How to estimate the health benefits of additional research and changing clinical practice. BMJ. 2015;351:h5987. - PubMed
MeSH terms
Substances
Grants and funding
LinkOut - more resources
Full Text Sources
Medical
