. 2024 Jun 3;134(11):e170125.
doi: 10.1172/JCI170125.

Calcineurin inhibition rescues alloantigen-specific central memory T cell subsets that promote chronic GVHD

Affiliations

Calcineurin inhibition rescues alloantigen-specific central memory T cell subsets that promote chronic GVHD

Yewei Wang et al. J Clin Invest. .

Abstract

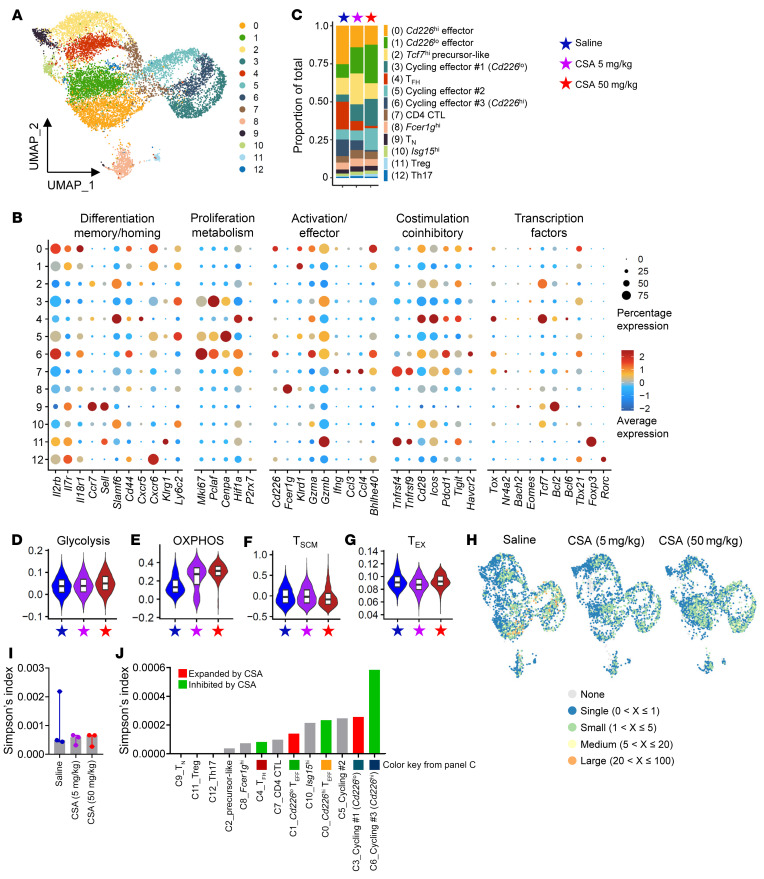
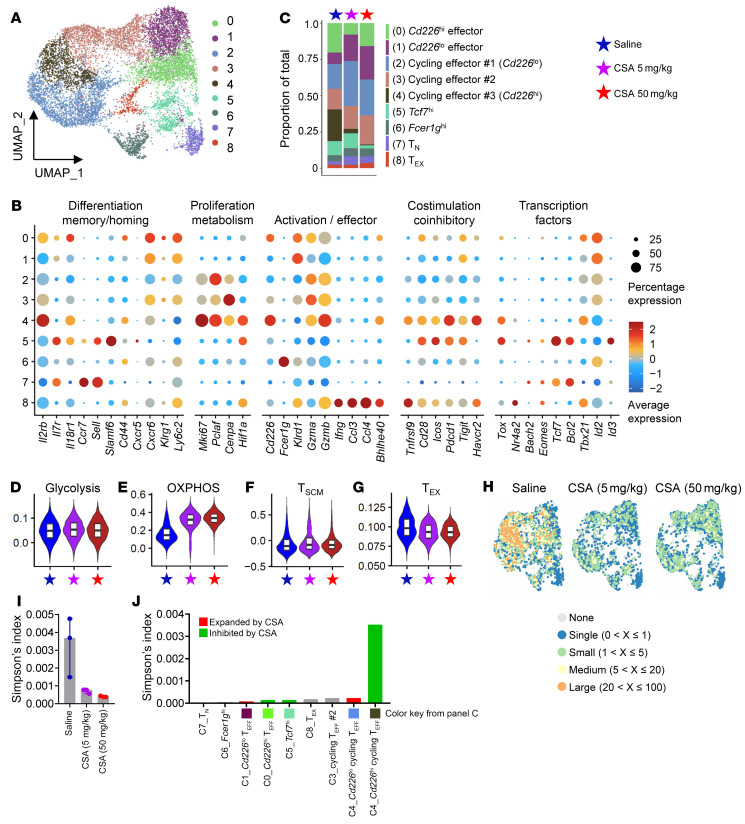
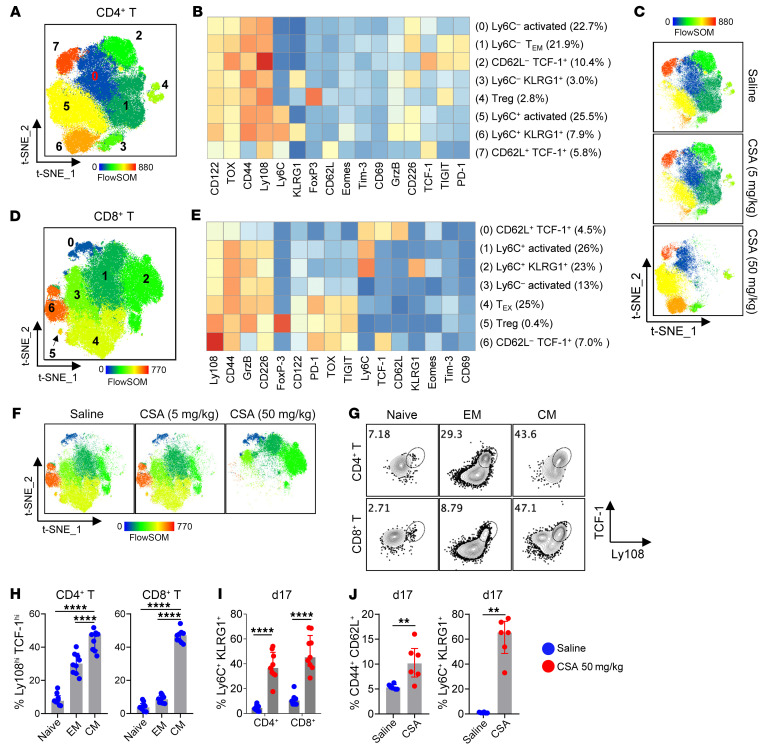
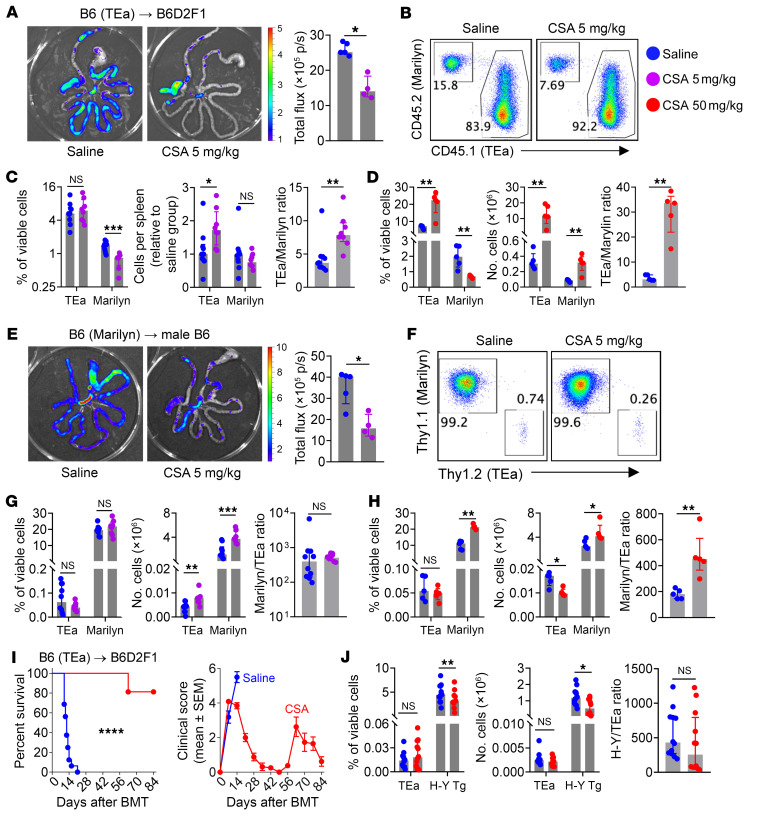
Calcineurin inhibitors (CNIs) constitute the backbone of modern acute graft-versus-host disease (aGVHD) prophylaxis regimens but have limited efficacy in the prevention and treatment of chronic GVHD (cGVHD). We investigated the effect of CNIs on immune tolerance after stem cell transplantation with discovery-based single-cell gene expression and T cell receptor (TCR) assays of clonal immunity in tandem with traditional protein-based approaches and preclinical modeling. While cyclosporin and tacrolimus suppressed the clonal expansion of CD8+ T cells during GVHD, alloreactive CD4+ T cell clusters were preferentially expanded. Moreover, CNIs mediated reversible dose-dependent suppression of T cell activation and all stages of donor T cell exhaustion. Critically, CNIs promoted the expansion of both polyclonal and TCR-specific alloreactive central memory CD4+ T cells (TCM) with high self-renewal capacity that mediated cGVHD following drug withdrawal. In contrast to posttransplant cyclophosphamide (PT-Cy), CSA was ineffective in eliminating IL-17A-secreting alloreactive T cell clones that play an important role in the pathogenesis of cGVHD. Collectively, we have shown that, although CNIs attenuate aGVHD, they paradoxically rescue alloantigen-specific TCM, especially within the CD4+ compartment in lymphoid and GVHD target tissues, thus predisposing patients to cGVHD. These data provide further evidence to caution against CNI-based immune suppression without concurrent approaches that eliminate alloreactive T cell clones.

Keywords: Bone marrow transplantation; Immunology; T cells; Transplantation.


Figures

Figure 1
Figure 1. CSA promotes the expansion of central memory donor T cells.
B6D2F1 recipients were transplanted with B6 BM (5 × 10⁶) + T cells (2 × 10⁶) and treated with saline or CSA (5 mg/kg/d) up until day 13 after BMT. Spleens were taken 5 or 18 days after BMT and donor CD4+ and CD8+ T cells were analyzed (n = 10–15 per group from 2–3 experiments). (A) Frequency of donor T cells in viable cells and (B) absolute numbers per spleen. (C) Expression of T-bet in donor T cells. (DH) Expression of cytokines in donor T cells were analyzed following intracellular cytokine staining: (D) UMAP plots of donor T cells on day 5 (concatenated from 5 samples per group), expression of (E) IFNγ, (F) TNF, (G) IL-17A, and (H) frequency and numbers of IFNγ+IL-10+ Tr1 cells. (I) Frequency and numbers of CD4+ FoxP3+ Tregs. (JK) Composition of TN (CD44CD62L+), TEM (CD44+CD62L), and TCM (CD44+CD62L+) subsets in donor T cells on day 5 (J) and day 18 (K). Data are presented as median ± interquartile range and analyzed with the Mann-Whitney U test. *P < 0.05; **P < 0.01; ***P < 0.001.
Figure 2
Figure 2. Higher-dose CSA inhibits the acquisition of effector function but promotes survival and central memory differentiation.
(AH) B6D2F1 recipients were transplanted with B6 BM (5 × 10⁶) + T cells (2 × 10⁶) and treated with saline or CSA (5 or 50 mg/kg/d) until day 13. Spleens were taken for immune phenotyping and donor T cells were gated with congenic markers. (A) Frequency of donor T cells in the spleens over time after BMT. (B and C) Ratio of CD4+ to CD8+ donor T cells on day 5 (B) and day 7 (C) (n = 10–11 per group from 2 experiments). (D) Representative flow cytometric plots and expression of caspase-3 and Ki-67 (relative to the saline group) in donor T cells on day 5 (n = 9–10 per group from 2 experiments). (E and F) Number of cytokine-producing donor T cells on day 5 (n = 9–10 per group from 2 experiments) (E) and day 17 (F) (n = 12–13 per group from 3 experiments). (G and H) Number of donor TN (CD44CD62L+), TEM (CD44+CD62L), and TCM (CD44+CD62L+) cells on day 5 (G) and day 17 with representative flow cytometric plots (H) (n = 9–13 per group from 2 experiments). (I and J) Experiments were set up as described in Supplemental Figure 1I whereby magnetic activated cell sorting–selected (MACS-selected) CD4+ and CD8+ T cells were combined from saline/CSA-treated mice and transferred to secondary recipients. Memory phenotype (I) and numbers of TCM subset (J) of the transferred T cells were determined 35 days after transfer (n = 8–10 per group from 2 experiments). (K) Donor CD4+ T cells were isolated from spleens on day 15 after BMT (saline or CSA treated), sort-purified to TN, TEM and TCM subsets, and individually transferred to secondary BMT recipients (1 × 10⁵ per recipient) on day 0. Spleens were taken 49 days after adoptive transfer and transferred T cells were determined based on congenic markers (n = 2, 3, 6, 5, 6, and 4 per group respectively). (L) B6D2F1 recipients were transplanted with B6 BM (5 × 10⁶) + T cells (2 × 10⁶), treated with saline or CSA (50 mg/kg/d) up until day 13 and monitored for survival and clinical scores (n = 12–13 per group from 2 experiments). (AK) Data are presented as median ± interquartile range and analyzed with the Mann-Whitney U test; (L) clinical score data are presented as mean ± SEM and survival analyzed by log rank. *P < 0.05; **P < 0.01; ***P < 0.001; ****P < 0.0001.
Figure 3
Figure 3. CSA promotes the expansion of quiescent alloreactive CD4+ T cells.
B6D2F1 recipients were transplanted with B6 BM (5 × 10⁶) + B6 T cells (2 × 10⁶) + TEa TCR transgenic T cells (1 × 10³) and treated daily with saline or CSA (5 or 50 mg/kg/kg). Spleens were taken on day 7, pooled from every 2 mice, and donor CD4+ T cells were sort purified for single-cell RNA-Seq (n = 3 per group). (A) UMAP of CD4+ T cells colored by clusters. (B) Expression of genes across clusters. (C) Proportion of each cluster across groups. (DG) Gene set enrichment analysis for (D) Glycolysis, (E) OXPHOS, (F) TSCM, and (G) TEX associated genes across groups. (H) UMAP of CD4+ T cells colored by clonality scores across groups. (I) Simpson’s clonality index of TCR diversity across groups (presented as median ± interquartile range). (J) Simpson’s clonality index of TCR diversity across clusters.
Figure 4
Figure 4. CSA inhibits the clonal expansion in CD8+ T cells.
Samples were processed as described in Figure 3 and single-cell RNA-Seq was conducted on sort-purified CD8+ T cells. (A) UMAP of CD8+ T cells colored by clusters. (B) Expression of genes across clusters. (C) Proportion of each cluster across groups. (DG) Gene set enrichment analysis for (D) Glycolysis, (E) OXPHOS, (F) TSCM, and (G) TEX associated genes across groups. (H) UMAP of CD8+ T cells colored by clonality scores across groups. (I) Simpson’s clonality index of TCR diversity across groups (presented as median ± interquartile range). (J) Simpson’s clonality index of TCR diversity across clusters.
Figure 5
Figure 5. CSA expands alloreactive CD4+ TCM with high self-renewal capacity.
(AH) B6D2F1 recipients were transplanted with B6 BM (5 × 10⁶) + T cells (2 × 10⁶) and treated with saline or CSA (5 or 50 mg/kg/d). Spleens were taken on day 7 and analyzed with high-parameter flow cytometry (concatenated from 4–5 samples per group). (AC) Donor CD4+ T cells were analyzed for: (A) t-SNE plots colored by FlowSOM populations, (B) Heatmap of marker expression (MFI) across FlowSOM populations, and (C) t-SNE plots (colored by FlowSOM populations) across groups. (DF) Donor CD8+ T cells were analyzed for: (D) t-SNE plots colored by FlowSOM populations, (E) Heatmap of marker expression (MFI) across FlowSOM populations, and (F) t-SNE plots (colored by FlowSOM populations) across groups. (G and H) Expression of TCF-7/TCF-1 and Ly108 in TN (CD44CD62L+), TEM (CD44+CD62L), and TCM (CD44+CD62L+) subsets of donor T cells in untreated mice (n = 9 per group from 2 experiments). (I) B6D2F1 recipients were transplanted as above. Spleens were taken on day 17 and analyzed for the memory phenotypes of donor CD4+ and CD8+ T cells (n = 9–10 per group from 2 experiments). (J) B6D2F1 recipients were transplanted with B6 TCD BM (5 × 10⁶) + TEa TCR transgenic T cells (5 × 10³) and treated with saline or CSA (50 mg/kg/d). Spleens were taken on day 17 and TEa cells were analyzed (n = 6 per group from 1 experiment). Data are presented as median ± interquartile range and analyzed with 1-way ANOVA (H) or Mann-Whitney U test (I and J). **P < 0.01; ****P < 0.0001.
Figure 6
Figure 6. Cyclosporine and Tacrolimus broadly inhibit all stages of T cell exhaustion and promote effector T cell differentiation.
Female B6D2F1 recipients were transplanted with B6 BM (5 × 10⁶) + T cells (2 × 10⁶) and treated with saline, CSA (25 mg/kg/d), or TAC (10 mg/kg/d) from day 0 to 13. Spleens were taken on day 14 and analyzed with high-parameter flow cytometry. (A) Numbers of donor CD4+ and CD8+ T cells per spleen with the ratio of CD4+ to CD8+ donor T cells. (B) Frequency of TCM in donor CD4+ and CD8+ T cells. (C) Schema (created with BioRender; biorender.com) of T cell exhaustion and TEFF differentiation pathways whereby CNIs suppress exhaustion (downregulating PD-1 and TOX) and promote TEFF differentiation. (D) Gating strategy of the flow cytometric analysis (a representative sample from the saline group) whereby the gray histograms represent fluorescence minus 1 (FMO) control. (E) Expression of PD-1 and TOX in CD8+ T cells (representative flow cytometric plots). (F and G) Frequency (upper panels) of the above defined T cell subsets in donor CD8+ T cells (F) and CD4+ T cells (G) with corresponding absolute numbers per spleen (lower panels). Data are presented as median ± interquartile range and analyzed with 1-way ANOVA. *P < 0.05; **P < 0.01; ***P < 0.001; ****P < 0.0001.
Figure 7
Figure 7. CSA attenuates acute GVHD but promotes alloantigen-specific CD4+ T cell survival.
(AD) Female B6D2F1 (I-Ed) recipients were transplanted with 5 × 10⁶ PTPrca TCD BM, 5 × 10⁴ luciferase-expressing TEaluc+ T cells and 6 × 10⁵ Marilyn T cells, treated with saline or CSA (5 or 50 mg/kg/d) and taken for analysis on day 7. (A) Representative bioluminescence images and total flux of gut infiltrating TEaluc+ cells (n = 4–5 per group). (B) Representative flow cytometric plots and (C and D) frequencies, numbers and ratio of transferred T cells in spleens treated with lower dose CSA (5 mg/kg/d) (C: n = 8–10 per group from 2 experiments) or with higher dose CSA (50 mg/kg/d) (D: n = 5 per group). (EH) Male B6 recipients were transplanted with 5 × 10⁶ C57xPTP TCD BM, 5 × 10⁴ TEa T cells and 6 × 10⁵ luciferase-expressing Marilynluc+ T cells, treated with saline or CSA (5 or 50 mg/kg) and taken for analysis on day 7. (E) Representative bioluminescence images and total flux of gut infiltrating Marilynluc+ T cells (n = 4–5 per group). (F) Representative flow cytometric plots and (G and H) frequencies, numbers, and ratio of transferred T cells in spleens treated with lower dose CSA (5 mg/kg/d) (G: n = 8–10 per group from 2 experiments) or with higher dose CSA (50 mg/kg/d) (H: n = 5 per group). (I) B6D2F1 recipients were transplanted with B6 TCD BM (5 × 10⁶) and 1 × 10⁴ TEa T cells, treated with saline or higher dose CSA (50 mg/kg/d) and monitored for survival and clinical scores (n = 16 per group from 2 experiments). (J) Male B6 recipients were transplanted with 5 × 10⁶ B6 TCD BM, 5 × 10⁴ TEa T cells and 1 × 10⁶ H-Y specific CD8+ T cells and treated with saline or CSA (50 mg/kg/d). Spleens were taken on day 7 (n = 12 per group from 2 experiments) and analyzed for the frequency, numbers, and ratio of transferred T cells. (AH, and J) Data are presented as median ± interquartile range and analyzed with the Mann-Whitney U test; (I) Survival data are analyzed with log-rank test, and clinical scores are presented as mean ± SEM. *P < 0.05; **P < 0.01; ***P < 0.001; ****P < 0.0001.
Figure 8
Figure 8. CSA and PT-Cy have differential effects on cGVHD effector pathways.
(A) Female B6D2F1 recipients were transplanted with 5 × 10⁶ C57xPTP TCD BM, 2 × 10³ TEa T cells, and 4 × 10⁵ Marilyn T cells and treated with saline or PT-Cy. Spleens were taken on day 30 (n = 11 per group from 2 experiments) and analyzed for the expansion of transferred T cells. (BH) B6D2F1 recipients were transplanted with BM (5 × 10⁶) and T cells (2 × 10⁶) from B6.Il17aeYFP donors, and treated with saline, CSA (5 mg/kg), or PT-Cy (100 mg/kg). (BD) Spleens were taken on day 7 and donor T cells were analyzed for: (B) Expression of Ki-67, (C) Expression of Bcl-2, and (D) composition of TN (CD44CD62L+), TEM (CD44+CD62L), and TCM (CD44+CD62L+) subsets. (E and F) Spleens were analyzed for: (E) representative flow cytometric plots of Il17aeYFP in donor T cells on day 7 with (F) frequencies on day 7 and 30 (n = 10–14 per group from 2–3 experiments). (G and H) Mononuclear cells were isolated from skin and analyzed for: (G) frequency of donor T cells with (H) Il17aeYFP expression on day 7 (n = 8 per group from 2 experiments) and day 30 (n = 4–8 per group from 1 experiment). (IL) B6D2F1 recipients were transplanted with BM (5 × 10⁶) + T cells (2 × 10⁶) or TCD BM (5 × 10⁶) from B6.Il17aeYFP donors. BMT recipients were treated with CSA (5 mg/kg/d for 14 days) or PT-Cy. Skin was taken on day 56 for analysis (n = 8 for CSA, 7 for PT-Cy, and 4 for TCD groups respectively): (I) numbers of donor T cells per gram skin tissue, (J) expression of Il17aeYFP in donor T cells, (K) numbers of Th17 and Tc17 cells per gram skin tissue, and (L) representative images of H&E staining with pathology scores. Data are presented as median ± interquartile range and analyzed with the Mann-Whitney U test (A), 2-way ANOVA (D), or 1-way ANOVA (FK). ND, not detectable; *P < 0.05; **P < 0.01; ***P < 0.001; ****P < 0.0001.
Figure 9
Figure 9. CSA-expanded TCM preferentially mediate late GVHD.
Male B6D2F1 recipients were transplanted with 5 × 10⁶ B6 TCD BM (CD45.2 or CD45.1), 1 × 10⁶ B6 CD4+ T cells (WT or Il17aeYFP, CD45.2, CD90.2), and 0.15 × 10⁶ Marilyn CD4+ TCR Tg T cells (CD45.2, CD90.1) followed by CSA (50 mg/kg) from day 0. Spleen and mesenteric lymph nodes were isolated on day +7 and sorted as CD4+ TEM and TCM. Equal numbers of sort-purified CD4+ TEM and TCM (5 × 10⁵ per mouse) were adoptively transferred into secondary BMT recipients (male B6D2F1) of a parallel experiment which had been transplanted with TCD BM. Clinical scores were undertaken weekly and analysis was conducted at 28 days after T cell transfer. (A) Experimental schema (created with BioRender; biorender.com). (B) Clinical scores. (C) Pathology scores in the skin and representative images. (D and E) Adoptively transferred T cells were identified by congenic markers following enzymatic digestion of the skin tissue. (D) Numbers of transferred Marilyn Tg and polyclonal CD4+ T cells (relative to the TEM group). (E) Numbers of Il17aeYFP+ polyclonal CD4+ T cells in the skin with concatenated flow cytometric plots in the skin and the graft. (BD) n = 10, 8, and 6 per group from 2 experiments; (E) n = 5, 5, and 2 per group from 1 experiment. Data are presented as mean ± SEM and analyzed with 2-way ANOVA (B) or 2-tailed t test (CE). *P < 0.05; **P < 0.01; ***P < 0.001.

References

    1. Zeiser R, Blazar BR. Acute graft-versus-host disease - biologic process, prevention, and therapy. N Engl J Med. 2017;377(22):2167–2179. doi: 10.1056/NEJMra1609337. - DOI - PMC - PubMed
    1. Zeiser R, Blazar BR. Pathophysiology of chronic graft-versus-host disease and therapeutic targets. N Engl J Med. 2017;377(26):2565–2579. doi: 10.1056/NEJMra1703472. - DOI - PubMed
    1. Bleakley M, et al. Naive T cell depletion to prevent chronic graft-versus-host disease. J Clin Oncol. 2022;40(11):1174–1185. doi: 10.1200/JCO.21.01755. - DOI - PMC - PubMed
    1. Anderson BE, et al. Memory CD4+ T cells do not induce graft-versus-host disease. J Clin Invest. 2003;112(1):101–108. doi: 10.1172/JCI17601. - DOI - PMC - PubMed
    1. Hataye J, et al. Naive and memory CD4+ T cell survival controlled by clonal abundance. Science. 2006;312(5770):114–116. doi: 10.1126/science.1124228. - DOI - PubMed

MeSH terms