

Modular CRISPR/Cas12a synergistic activation platform for detection and logic operations
- PMID: 38828769
- PMCID: PMC11229313
- DOI: 10.1093/nar/gkae470
Modular CRISPR/Cas12a synergistic activation platform for detection and logic operations
Abstract
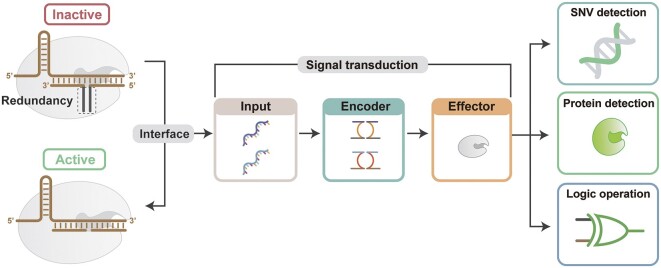
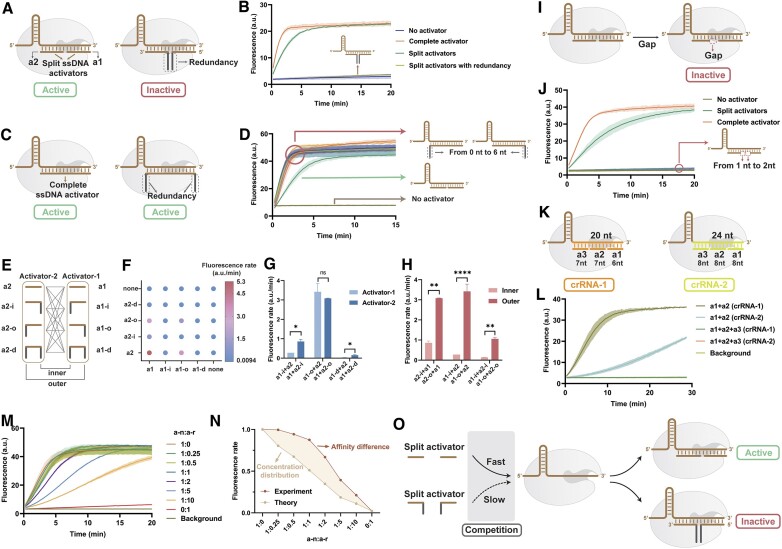
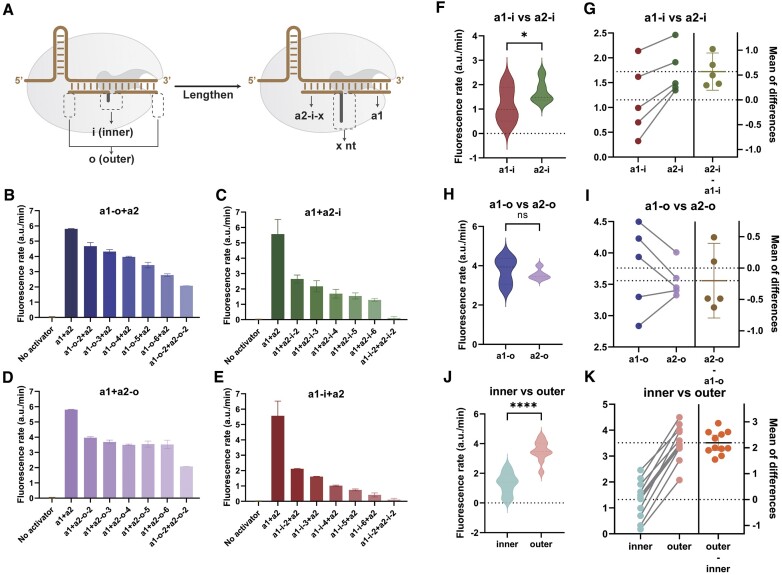
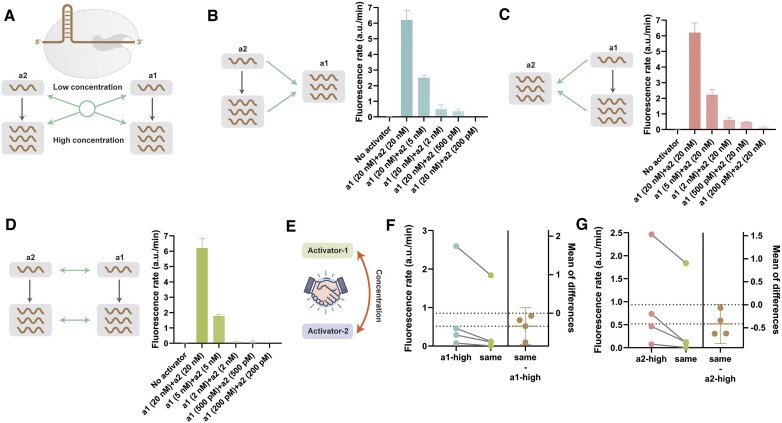
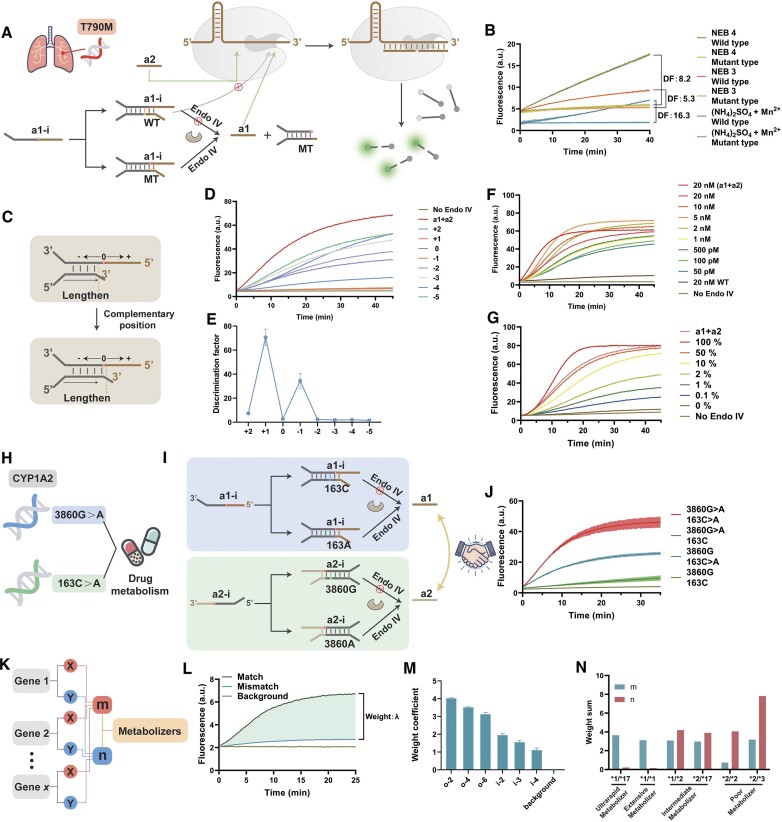
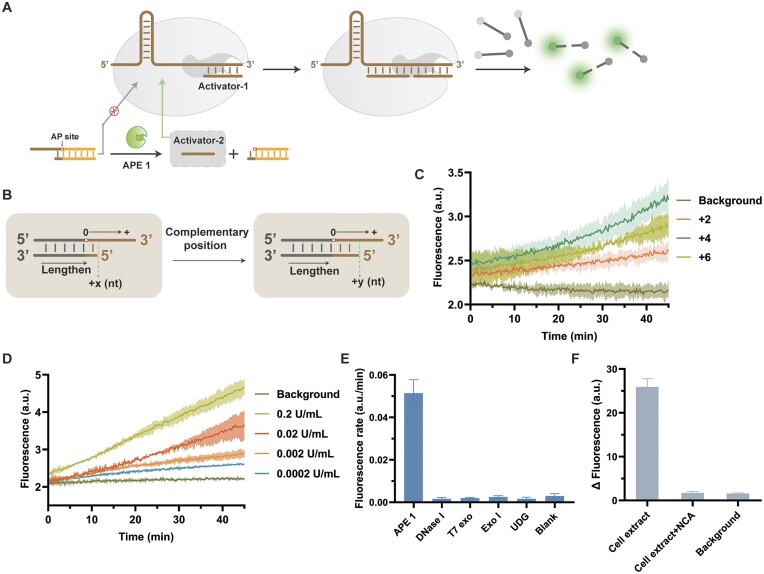
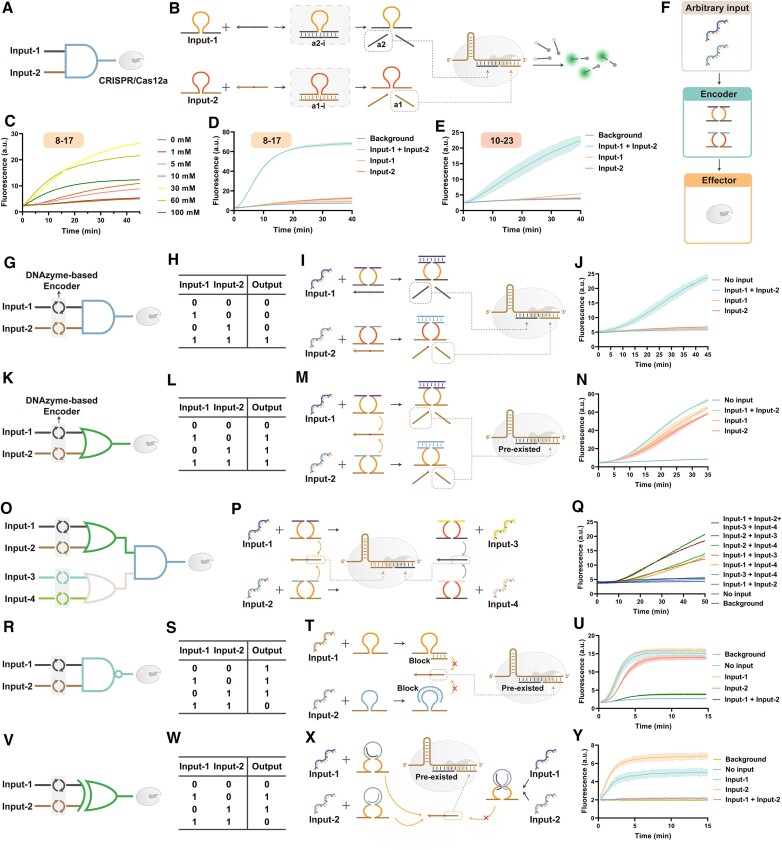
The revolutionary technology of CRISPR/Cas has reshaped the landscape of molecular biology and molecular engineering. This tool is of interest to researchers in multiple fields, including molecular diagnostics, molecular biochemistry circuits, and information storage. As CRISPR/Cas spreads to more niche areas, new application scenarios and requirements emerge. Developing programmability and compatibility of CRISPR/Cas becomes a critical issue in the new phase. Here, we report a redundancy-based modular CRISPR/Cas12a synergistic activation platform (MCSAP). The position, length, and concentration of the redundancy in the split DNA activators can finely regulate the activity of Cas12a. With the redundant structure as an interface, MCSAP serves as a modular plug-in to seamlessly integrate with the upstream molecular network. MCSAP successfully performs three different tasks: nucleic acid detection, enzyme detection, and logic operation. MCSAP can work as an effector for different molecular networks because of its compatibility and programmability. Our platform provides powerful yet easy-to-use tools and strategies for the fields of DNA nanotechnology, molecular engineering, and molecular biology.
© The Author(s) 2024. Published by Oxford University Press on behalf of Nucleic Acids Research.
Figures
Similar articles
-
CRISPR/Cas12a-Powered Electrochemical Platform for Dual-miRNA Detection via an AND Logic Circuit.Anal Chem. 2025 Jan 14;97(1):1028-1036. doi: 10.1021/acs.analchem.4c06256. Epub 2024 Dec 24. Anal Chem. 2025. PMID: 39718242
-
Binding-driven forward tearing protospacer activated CRISPR-Cas12a system and applications for microRNA detection.J Nanobiotechnology. 2024 Nov 8;22(1):684. doi: 10.1186/s12951-024-02915-5. J Nanobiotechnology. 2024. PMID: 39516870 Free PMC article.
-
Synergistic effect of split DNA activators of Cas12a with exon-unwinding and induced targeting effect.Nucleic Acids Res. 2024 Oct 14;52(18):11148-11157. doi: 10.1093/nar/gkae766. Nucleic Acids Res. 2024. PMID: 39258555 Free PMC article.
-
CRISPR-Cas12a System for Biosensing and Gene Regulation.Chem Asian J. 2021 Apr 19;16(8):857-867. doi: 10.1002/asia.202100043. Epub 2021 Mar 18. Chem Asian J. 2021. PMID: 33638271 Review.
-
Anti-CRISPRs: Protein Inhibitors of CRISPR-Cas Systems.Annu Rev Biochem. 2020 Jun 20;89:309-332. doi: 10.1146/annurev-biochem-011420-111224. Epub 2020 Mar 18. Annu Rev Biochem. 2020. PMID: 32186918 Free PMC article. Review.
Cited by
-
CRISPR/Cas12a-Based Biosensing: Advances in Mechanisms and Applications for Nucleic Acid Detection.Biosensors (Basel). 2025 Jun 4;15(6):360. doi: 10.3390/bios15060360. Biosensors (Basel). 2025. PMID: 40558442 Free PMC article. Review.
-
Direct repeat region 3' end modifications regulate Cas12a activity and expand its applications.Nucleic Acids Res. 2025 Jan 24;53(3):gkaf040. doi: 10.1093/nar/gkaf040. Nucleic Acids Res. 2025. PMID: 39883010 Free PMC article.
-
Exploring the effect of activator topology on CRISPR-Cas12a trans-cleavage activity.Nucleic Acids Res. 2025 Apr 22;53(8):gkaf311. doi: 10.1093/nar/gkaf311. Nucleic Acids Res. 2025. PMID: 40263707 Free PMC article.
-
Regulation of CRISPR trans-cleavage activity by an overhanging activator.Nucleic Acids Res. 2025 Feb 8;53(4):gkaf117. doi: 10.1093/nar/gkaf117. Nucleic Acids Res. 2025. PMID: 39995038 Free PMC article.
-
Engineering stimuli-responsive CRISPR-Cas systems for versatile biosensing.Anal Bioanal Chem. 2025 Apr;417(9):1699-1711. doi: 10.1007/s00216-024-05678-y. Epub 2024 Nov 27. Anal Bioanal Chem. 2025. PMID: 39601843 Review.
References
-
- Liu G.W., Lin Q.P., Jin S., Gao C.X.. The CRISPR-Cas toolbox and gene editing technologies. Mol. Cell. 2022; 82:333–347. - PubMed
-
- Song X.R., Liu C., Wang N., Huang H., He S.Y., Gong C.Y., Wei Y.Q.. Delivery of CRISPR/Cas systems for cancer gene therapy and immunotherapy. Adv. Drug Deliv/ Rev. 2021; 168:158–180. - PubMed
-
- Li H.M., Xie Y., Chen F.M., Bai H.W., Xiu L.S., Zhou X.N., Guo X.K., Hu Q.Q., Yin K.. Amplification-free CRISPR/Cas detection technology: challenges, strategies, and perspectives. Chem. Soc. Rev. 2023; 52:361–382. - PubMed
-
- Hu Y.Q., Zhang Z., Ye W.C., Zhang W., Hu M.H., Yuan W.Q., Wang H.B., Xiao X.J., Wu T.B.. A DNA structure-mediated fluorescent biosensor for apurinic/apyrimidinic endonuclease 1 activity detection with ultra-high sensitivity and selectivity. Sens. Actuators B. 2021; 330:129332.
MeSH terms
Substances
Grants and funding
LinkOut - more resources
Full Text Sources
Research Materials
