. 2024 Jun 3:13:RP91924.
doi: 10.7554/eLife.91924.

Agent-based model demonstrates the impact of nonlinear, complex interactions between cytokinces on muscle regeneration

Affiliations

Agent-based model demonstrates the impact of nonlinear, complex interactions between cytokinces on muscle regeneration

Megan Haase et al. Elife. .

Abstract

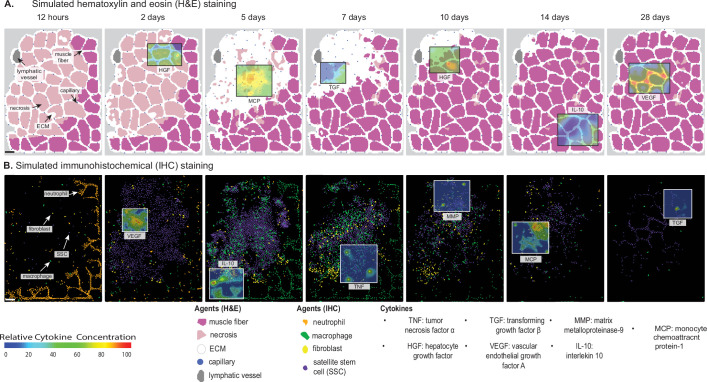
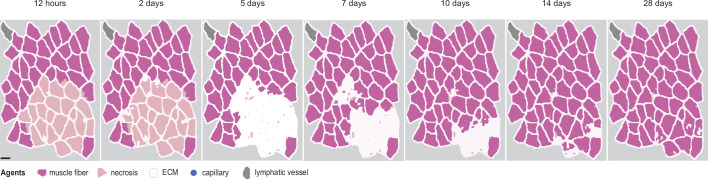
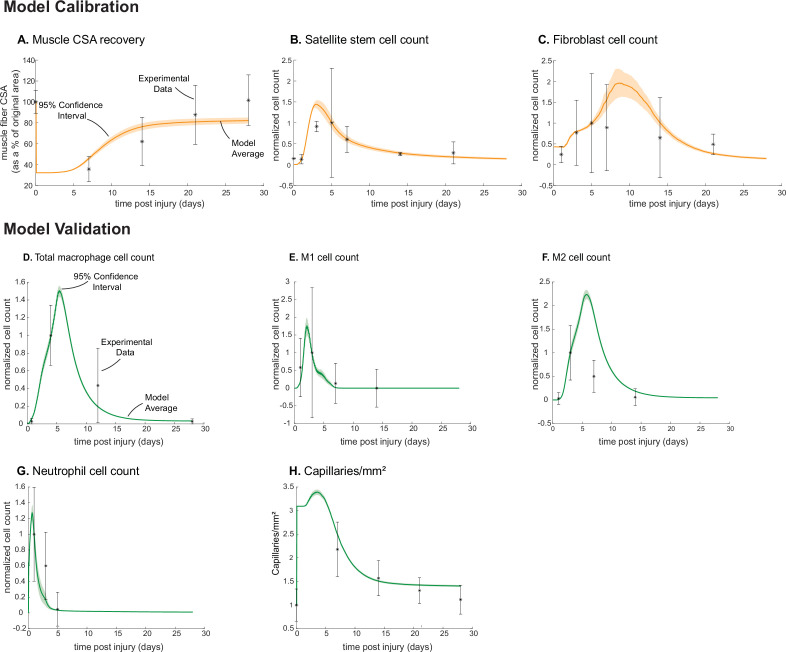
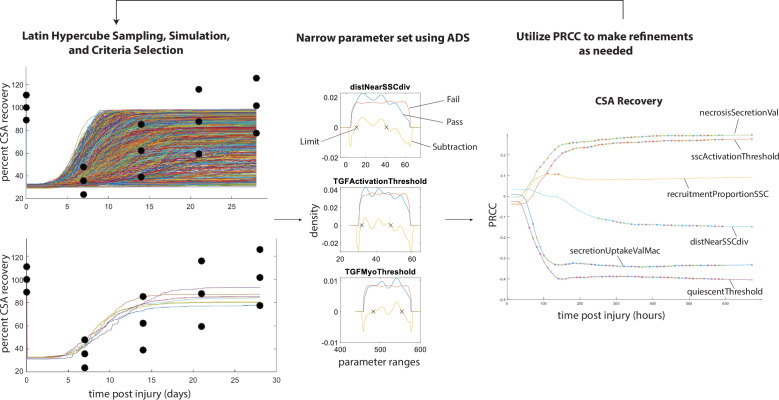
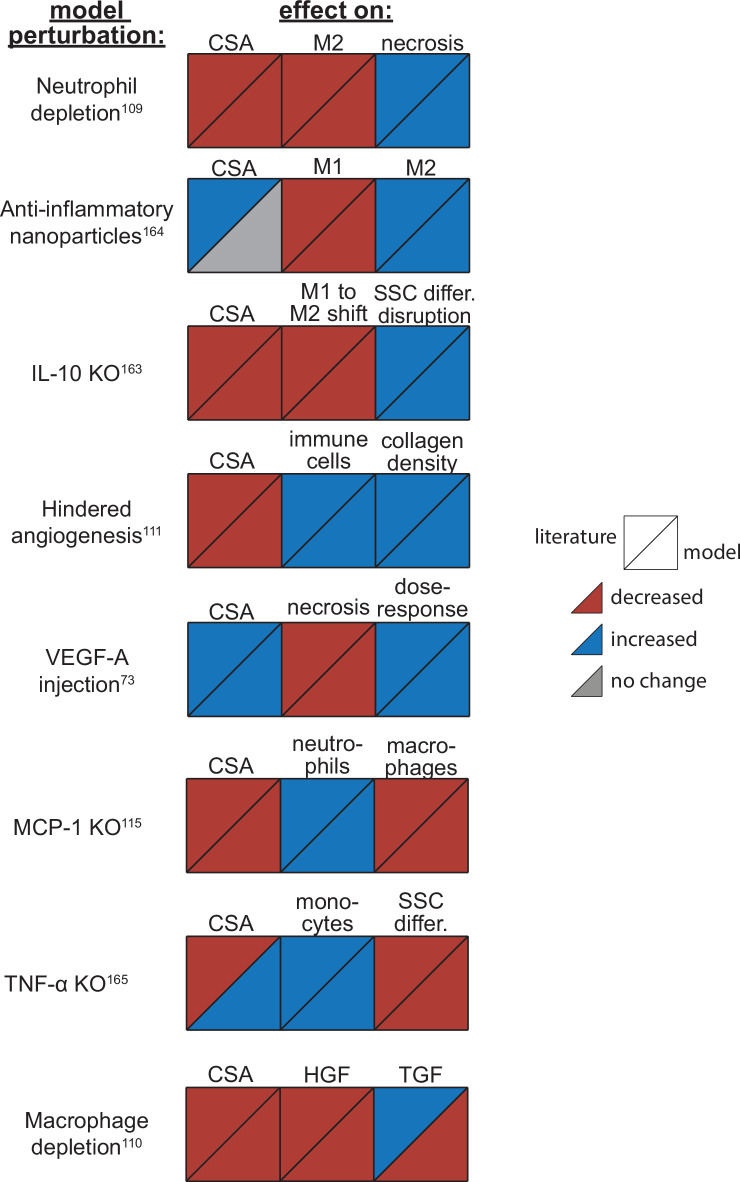
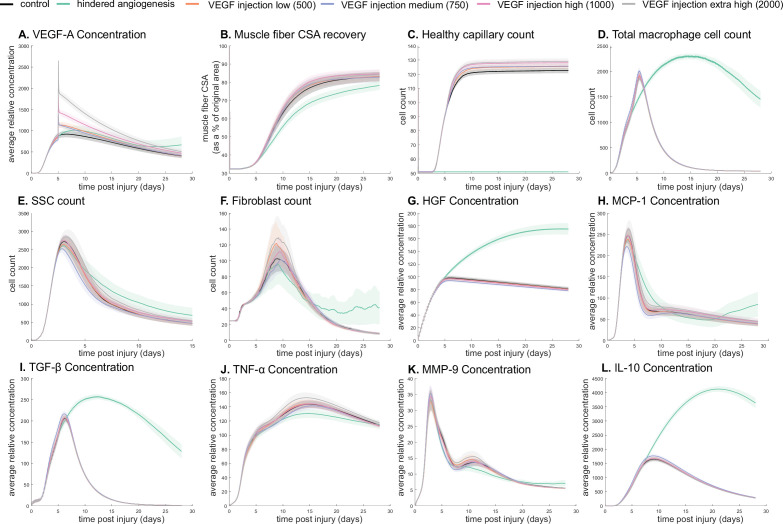
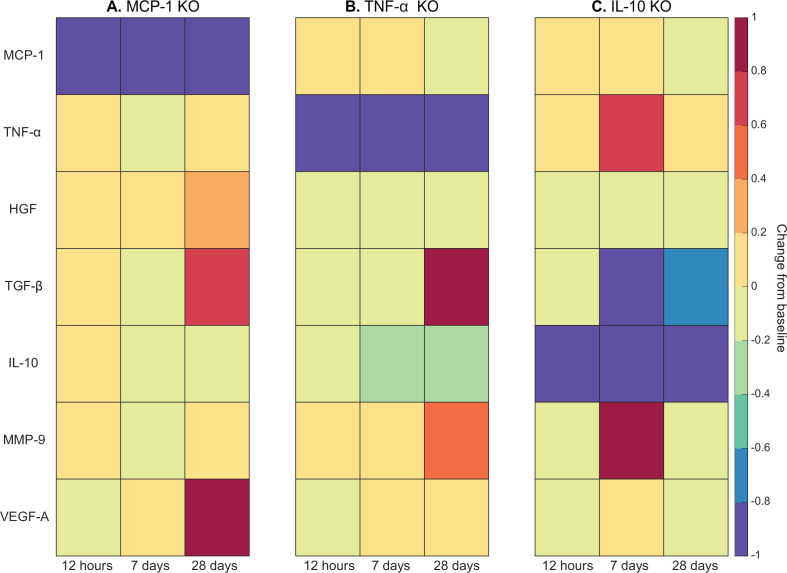
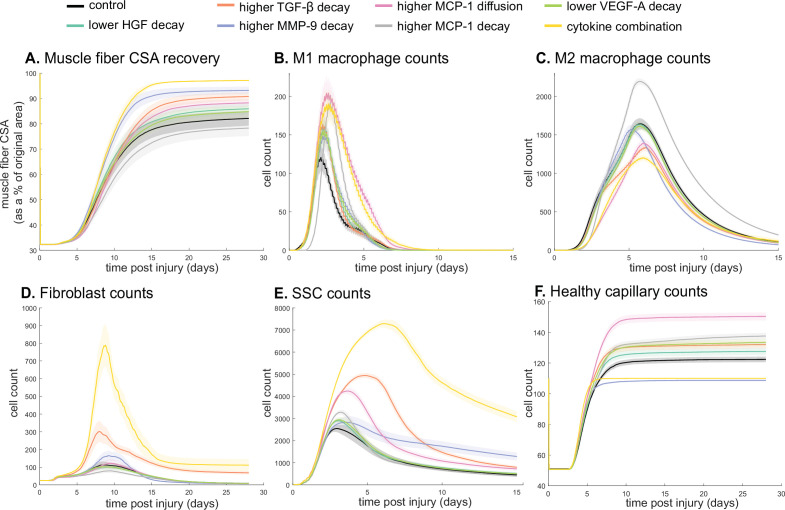
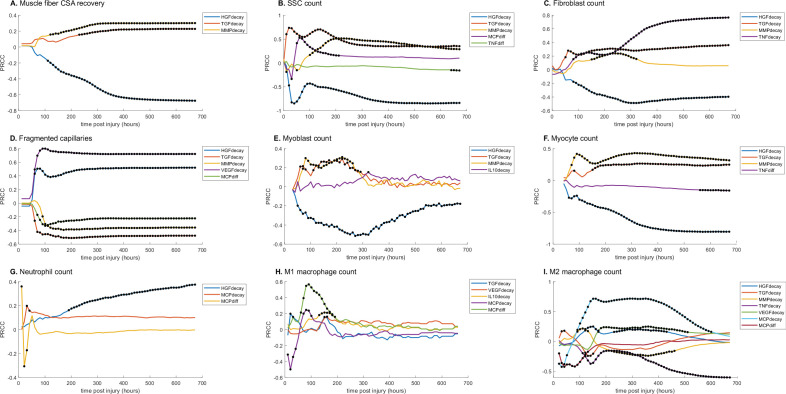
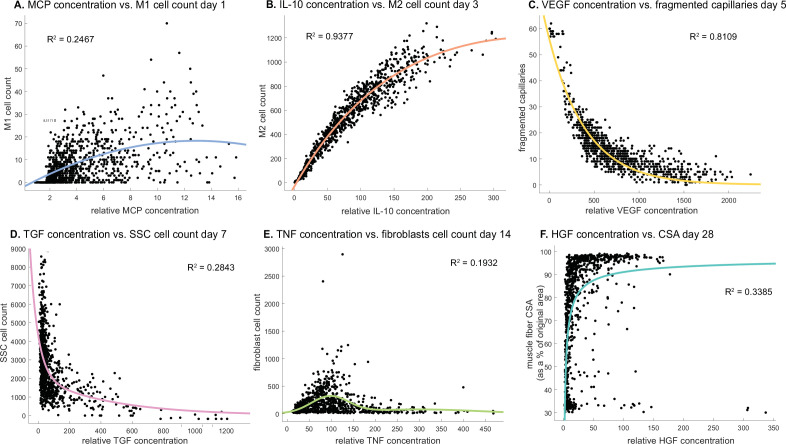
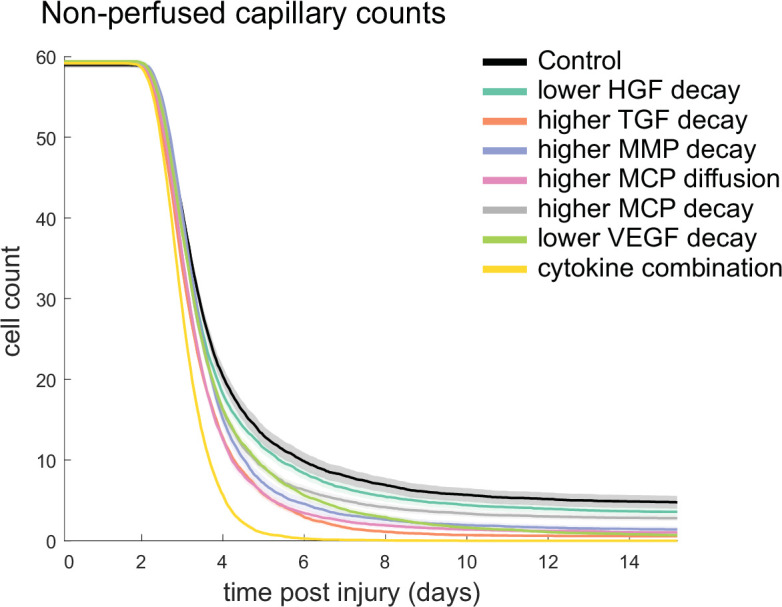
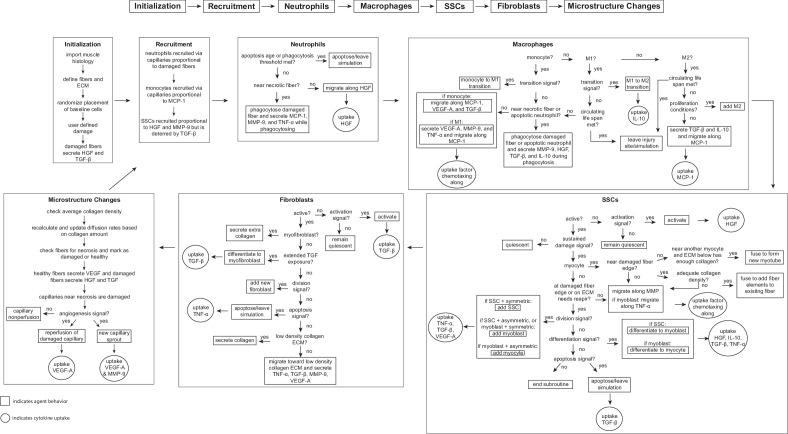
Muscle regeneration is a complex process due to dynamic and multiscale biochemical and cellular interactions, making it difficult to identify microenvironmental conditions that are beneficial to muscle recovery from injury using experimental approaches alone. To understand the degree to which individual cellular behaviors impact endogenous mechanisms of muscle recovery, we developed an agent-based model (ABM) using the Cellular-Potts framework to simulate the dynamic microenvironment of a cross-section of murine skeletal muscle tissue. We referenced more than 100 published studies to define over 100 parameters and rules that dictate the behavior of muscle fibers, satellite stem cells (SSCs), fibroblasts, neutrophils, macrophages, microvessels, and lymphatic vessels, as well as their interactions with each other and the microenvironment. We utilized parameter density estimation to calibrate the model to temporal biological datasets describing cross-sectional area (CSA) recovery, SSC, and fibroblast cell counts at multiple timepoints following injury. The calibrated model was validated by comparison of other model outputs (macrophage, neutrophil, and capillaries counts) to experimental observations. Predictions for eight model perturbations that varied cell or cytokine input conditions were compared to published experimental studies to validate model predictive capabilities. We used Latin hypercube sampling and partial rank correlation coefficient to identify in silico perturbations of cytokine diffusion coefficients and decay rates to enhance CSA recovery. This analysis suggests that combined alterations of specific cytokine decay and diffusion parameters result in greater fibroblast and SSC proliferation compared to individual perturbations with a 13% increase in CSA recovery compared to unaltered regeneration at 28 days. These results enable guided development of therapeutic strategies that similarly alter muscle physiology (i.e. converting extracellular matrix [ECM]-bound cytokines into freely diffusible forms as studied in cancer therapeutics or delivery of exogenous cytokines) during regeneration to enhance muscle recovery after injury.

Keywords: agent-based model; cell biology; computational biology; cytokine dynamics; mouse; muscle regeneration; skeletal muscle; systems biology.


Conflict of interest statement

MH, TC, AP, SP, SB No competing interests declared

Figures

Figure 1.
Figure 1.. Overview of agent-based model (ABM) simulation of muscle regeneration following an acute injury.
(A) Simulated cross-sections of a muscle fascicle that was initially defined by spatial geometry from a histology image. Muscle injury was simulated by replacing a section of the healthy fibers with necrotic elements. In response to the injury, a variety of factors are secreted in the microenvironment which impacts the behavior of the cells. The colors correspond with those typically seen in H&E staining. (B) ABM screen captures show the spatial locations of the cells throughout the 28-day simulation. The agent colors were matched to those typically seen in IHC-stained muscle sections. Scale bar: 50 µm.
Figure 1—figure supplement 1.
Figure 1—figure supplement 1.. Overview of agent-based model (ABM) simulation with different initial histology configuration.
Scale bar: 50 µm.
Figure 2.
Figure 2.. Agent-based model (ABM) calibration and validation.
ABM parameters were calibrated so that model outputs for cross-sectional area (CSA) recovery, satellite stem cell (SSC), and fibroblast counts were consistent with experimental data (A–C). (Murphy et al., 2011; Ochoa et al., 2007). Separate outputs from those used in calibration were compared to experimental data (Hardy et al., 2016; Ochoa et al., 2007; Wang et al., 2018; Nguyen et al., 2011) to validate the ABM (D–H). Error bars represent experimental standard deviation, and model 95% confidence interval is indicated by the shaded region. Cell count data were normalized by number of cells on the day of the experimental peak to allow for comparison between experiments and simulations.
Figure 2—figure supplement 1.
Figure 2—figure supplement 1.. Overview of calibration methods.
Latin hypercube sampling is used to generate 600 unique parameter sets given starting bounds, each of which was run in triplicate. The simulations were filtered given specified criteria (i.e. fitting within experimental bounds for cross-sectional area [CSA] recovery) and then alternative density subtraction (ADS) was used to narrow in the parameter bounds. Partial rank correlation coefficient (PRCC) was used to gain insight into model sensitivity and adjust the bounds in case initial parameter bounds were too wide or too narrow. This method also allowed for model rule execution refinement to correct cases that interfere with the dynamics of other cell types.
Figure 3.
Figure 3.. Agent-based model (ABM) perturbation outputs are compared to various literature experimental results.
Each perturbation model output is compared to the available corresponding published result. The top triangles indicate the literature findings and the bottom triangles indicate the model outputs. Red triangles represent a decrease, blue represents an increase, and gray represents no significant change. Timepoints of comparison were based on which timepoints were available from published experimental data. Refer to Table 8 for model input conditions and Supplementary file 7 for information on experimental references.
Figure 4.
Figure 4.. Dose-dependent response with vascular endothelial growth factor A (VEGF-A) injection compared to hindered angiogenesis.
VEGF-A concentration response to varied levels of VEGF injection (A). Hindered angiogenesis resulted in slower and overall decreased cross-sectional area (CSA) recovery (B). Capillary count was dependent on VEGF-A injection level (C). Total macrophage count was similar between control and VEGF-A injection perturbations but macrophage count was higher in later timepoints in the hindered angiogenesis simulation (D). Satellite stem cell (SSC) peak varied with VEGF-A injection level and counts were prolonged in the hindered angiogenesis simulations (E). The fibroblast peak was lower for the hindered angiogenesis perturbation and highest with the extra high VEGF-A injection. In contrast to the other simulations, the fibroblast count was trending upward at later timepoints in the hindered angiogenesis perturbation (F). Hepatocyte growth factor (HGF) levels were consistent between control and VEGF-A injection perturbations but was significantly elevated in the hindered angiogenesis perturbation (G). Monocyte chemoattractant protein-1 (MCP-1), transforming growth factor beta (TGF-β), and interleukin 10 (IL-10) concentrations were elevated at later stages of regeneration with hindered angiogenesis (H, I, L). Tumor necrosis factor alpha (TNF-α) was elevated with the extra high VEGF-A injection and lower with hindered angiogenesis (J). Matrix metalloproteinase-9 (MMP-9) concentration was lower at the simulation midpoint but elevated at late regeneration stages (K).
Figure 5.
Figure 5.. Heatmaps of changes in cytokine concentration at various timepoints throughout regeneration following individual cytokine knockout (KO) demonstrating cross-talk between cytokines.
With monocyte chemoattractant protein-1 (MCP-1) KO there was an increase in all cytokines except vascular endothelial growth factor A (VEGF-A) at 12 hr post injury. Over the course of regeneration there was continued increasing elevation of hepatocyte growth factor (HGF), increases in VEGF-A, and transforming growth factor beta (TGF-β) decreased at day 7 followed by a strong increase by day 28 post injury (A). In the tumor necrosis factor-alpha (TNF-α) KO simulations, there was an early decrease in TGF-β that shifts to strong increases by day 28. Matrix metalloproteinase-9 (MMP-9) increased throughout the duration, HGF and interleukin 10 (IL-10) were decreased, VEGF-A lagged in the beginning but was increased during mid to late timepoints (B). Following IL-10 KO there were increases in TNF-α, decreases in HGF and TGF-β, and elevated MMP-9 at day 7 that decreased by day 28 (C).
Figure 6.
Figure 6.. Combined alterations of various cytokine dynamics enhance muscle regeneration outcomes.
All tested alterations except higher monocyte chemoattractant protein-1 (MCP-1) decay resulted in higher cross-sectional area (CSA) recovery compared to the control (A). M1 cell count was higher for all perturbations with the highest peaks with increased MCP-1 diffusion and the combined cytokine alteration perturbation (B). Higher MCP-1 decay resulted in the largest M2 peak and higher MCP-1 diffusion, higher transforming growth factor beta (TGF-β) decay, and the combined cytokine alteration had a lower M2 peak than the control (C). Fibroblasts had the largest increase in cell count with the higher TGF-β decay and the cytokine combination perturbations (D). All perturbations resulted in an increased satellite stem cell (SSC) count with the largest increase resulting from the combined cytokine alteration (E). All perturbations except the combined and higher matrix metalloproteinase-9 (MMP-9) decay resulted in increased capillaries as a result of additional capillary sprouts (F).
Figure 6—figure supplement 1.
Figure 6—figure supplement 1.. Partial rank correlation coefficient (PRCC) plots for various model outputs over time to illustrate how the significance of cytokine decay and diffusion parameters varies at different points throughout regeneration.
Black dots indicate statistically significant (p<0.05) correlation for that timepoint. (A) Cross-sectional area (CSA) recovery had correlations with hepatocyte growth factor (HGF), transforming growth factor beta (TGF-β), and matrix metalloproteinase-9 (MMP-9) decay. (B) Satellite stem cell (SSC) count was correlated with HGF, TGF-β, MMP-9 decay and MCP-1 and TND diffusion. (C) Fibroblast count was correlated with HGF, TGF-β, MMP-9, and tumor necrosis factor alpha (TNF-α) decay. (D) HGF, TGF-β, MMP-9, VGEF decay, and MCP-1 diffusion were correlated with the number of non-perfused capillaries. (E) Myoblast cell count was correlated with HGF, TGF-β, MMP-9, and interleukin 10 (IL-10) decay. (F) Myocyte cell count was correlated with HGF, TGF-β, and MMP-9 decay and TNF-α diffusion. (G) HGF and MCP-1 decay as well as MCP-1 diffusion were correlated with neutrophil count. (H) M1 macrophage cell count was correlated with TGF-β, vascular endothelial growth factor A (VEGF-A), IL-10, and MCP-1 decay and MCP-1 diffusion. (I) M2 macrophage count was correlated with HGF, TGF-β, MMP-9, TNF-α, VEGF-A, MCP-1 decay, and MCP-1 diffusion.
Figure 6—figure supplement 2.
Figure 6—figure supplement 2.. Cytokine concentrations are correlated with cell counts and recovery metrics at various stages of regeneration.
There is an optimal monocyte chemoattractant protein-1 (MCP-1) concentration that tends to result in higher M1 counts 1 day post injury (A). Interleukin 10 (IL-10) concentration is positively correlated with M2 count 3 days post injury (B). Vascular endothelial growth factor A (VEGF-A) concentration is negatively correlated with the number of fragmented (non-perfused) capillaries 5 days post injury (C). Higher transforming growth factor beta (TGF-β) concentrations tend to result in lower satellite stem cell (SSC) cell count 7 days post injury (D). Fibroblasts cell count is highest at an optimal tumor necrosis factor alpha (TNF-α) concentration with higher or lower levels hindering cell count 14 days post injury (E). Hepatocyte growth factor (HGF) concentration is positively correlated with cross-sectional area (CSA) recovery at day 28 post injury but there appears to be a threshold where high HGF is no longer correlated with increased recovery (F).
Figure 6—figure supplement 3.
Figure 6—figure supplement 3.. Non-perfused capillaries for each cytokine perturbation.
The combined cytokine perturbation had the lowest number of non-perfused capillaries and all other perturbations resulted in less non-perfused capillaries compared to the control.
Figure 7.
Figure 7.. Flowchart of agent-based model (ABM) rules.
The model starts with initialization of the geometry and the prescribed injury. This is followed by recruitment of cells based on relative cytokine amounts within the microenvironment. The inflammatory cells, SSCs, and fibroblasts follow their literature-defined rules and probability-based decision tree to govern their behaviors. The boxes represent the behavior that the agent completes during that timestep given the appropriate conditions and the circles represent the uptake that occurs as a result of the simulated binding with microenvironmental factors for certain cell behaviors. ABM, agent-based model; SSC, satellite stem cell; ECM, extracellular matrix; TGF-β, transforming growth factor beta; HGF, hepatocyte growth factor; TNF-α, tumor necrosis factor alpha; VEGF-A, vascular endothelial growth factor A; MMP-9, matrix metalloproteinase-9; MCP-1, monocyte chemoattractant protein-1; IL-10; interleukin 10.

Update of

Similar articles

Cited by

References

    1. Abmayr SM, Pavlath GK. Myoblast fusion: lessons from flies and mice. Development. 2012;139:641–656. doi: 10.1242/dev.068353. - DOI - PMC - PubMed
    1. Akhurst RJ. TGF-beta antagonists: why suppress a tumor suppressor? The Journal of Clinical Investigation. 2002;109:1533–1536. doi: 10.1172/JCI15970. - DOI - PMC - PubMed
    1. Alberts B, Johnson A, Lewis J, Raff M, Roberts K, Walter P. Extracellular control of cell division, cell growth, and apoptosis. 2002. [March 13, 2023]. https://www.ncbi.nlm.nih.gov/books/NBK26877
    1. Allen RE, Boxhorn LK. Regulation of skeletal muscle satellite cell proliferation and differentiation by transforming growth factor-beta, insulin-like growth factor I, and fibroblast growth factor. Journal of Cellular Physiology. 1989;138:311–315. doi: 10.1002/jcp.1041380213. - DOI - PubMed
    1. Allen RE, Sheehan SM, Taylor RG, Kendall TL, Rice GM. Hepatocyte growth factor activates quiescent skeletal muscle satellite cells in vitro. Journal of Cellular Physiology. 1995;165:307–312. doi: 10.1002/jcp.1041650211. - DOI - PubMed