. 2024 Jul 15;213(2):135-147.
doi: 10.4049/jimmunol.2400032.

Activated PI3Kδ Specifically Perturbs Mouse Regulatory T Cell Homeostasis and Function Leading to Immune Dysregulation

Affiliations

Activated PI3Kδ Specifically Perturbs Mouse Regulatory T Cell Homeostasis and Function Leading to Immune Dysregulation

Akhilesh K Singh et al. J Immunol. .

Abstract

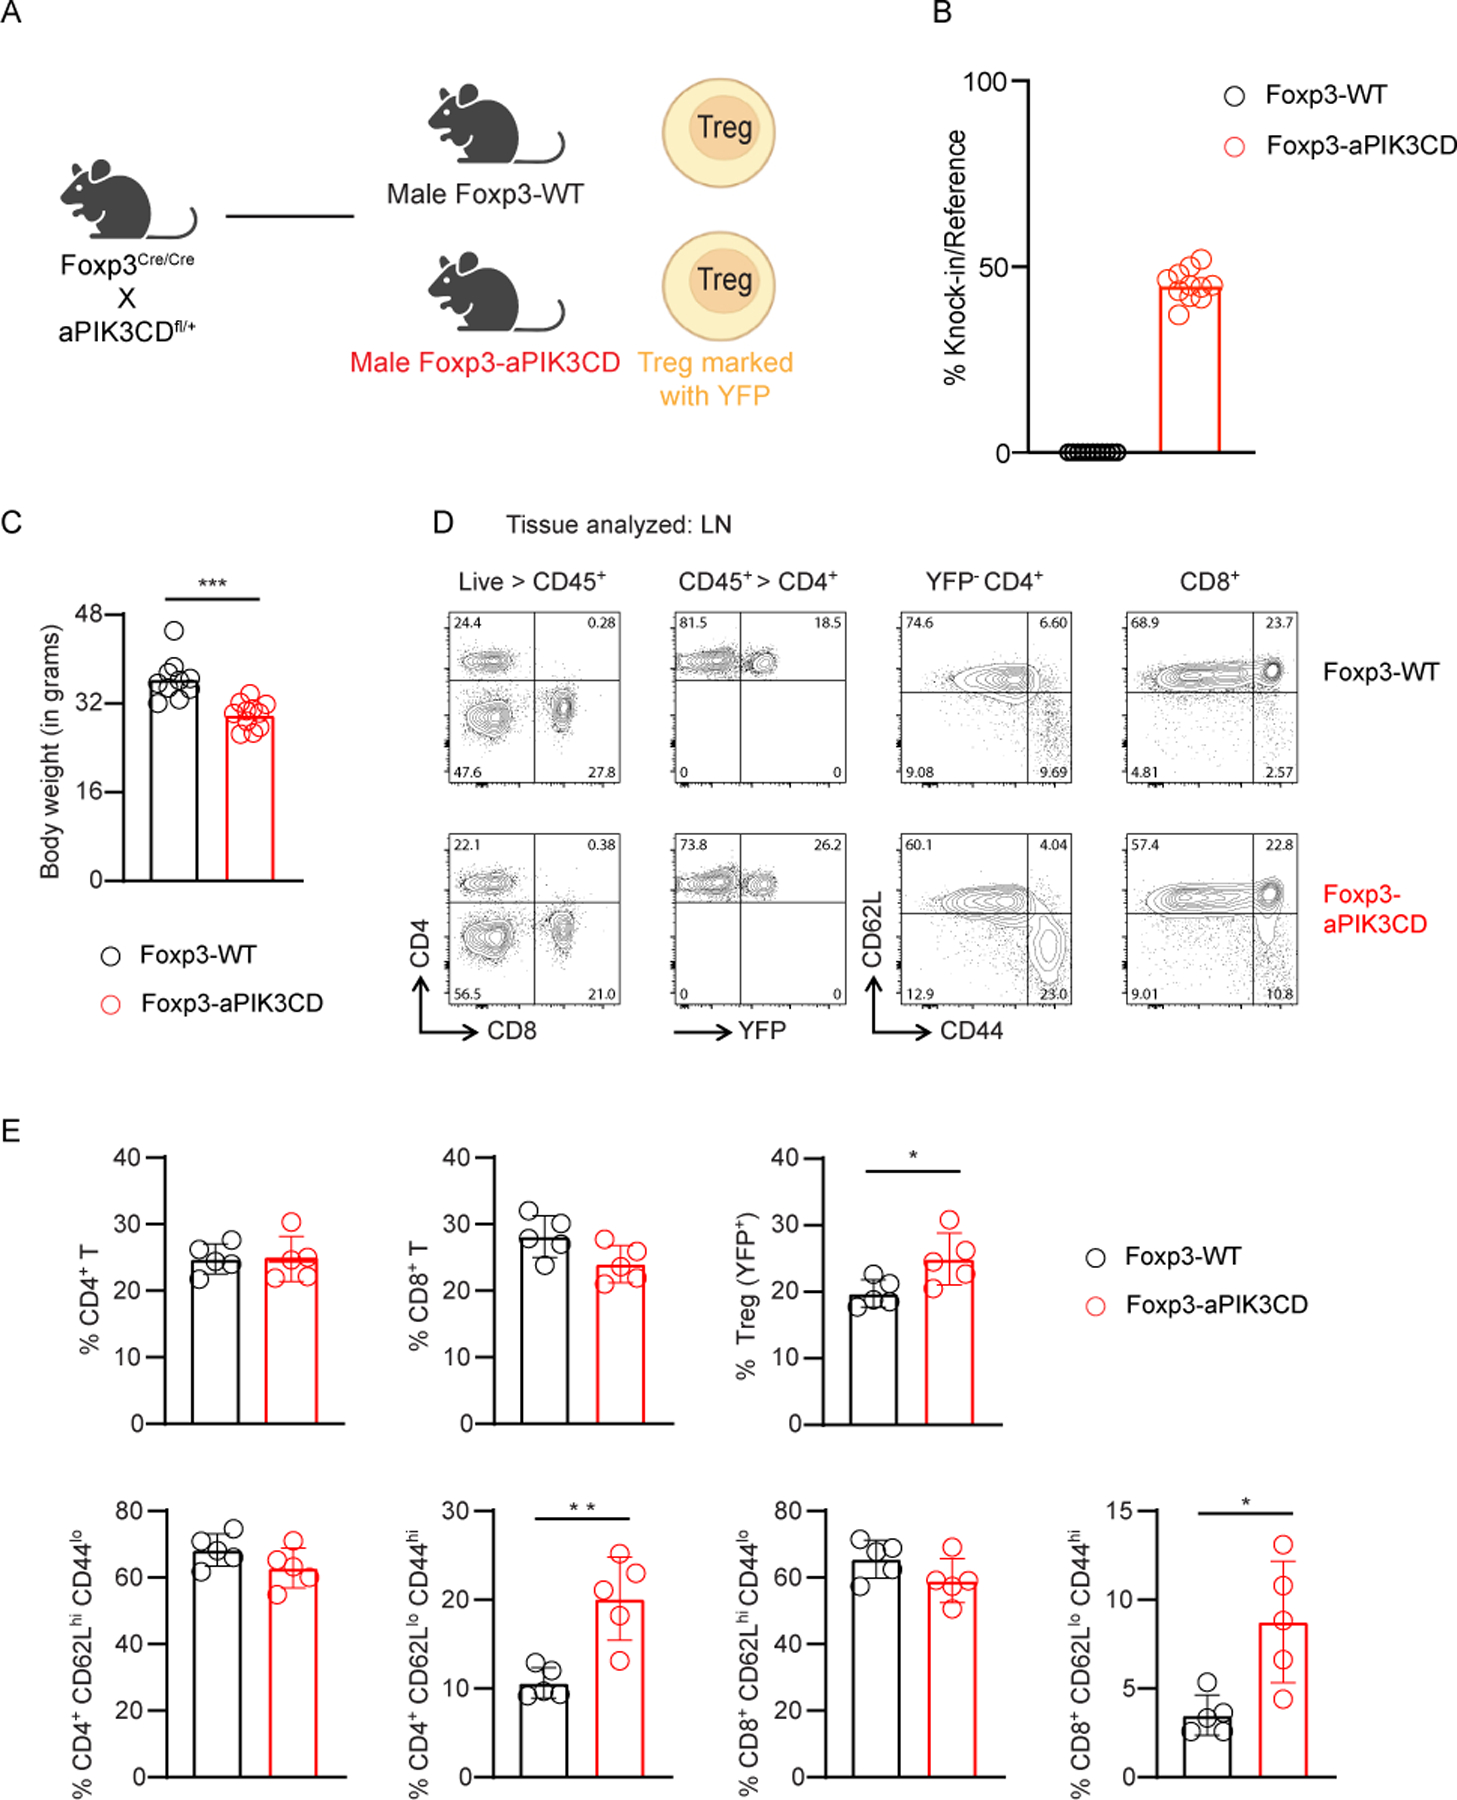
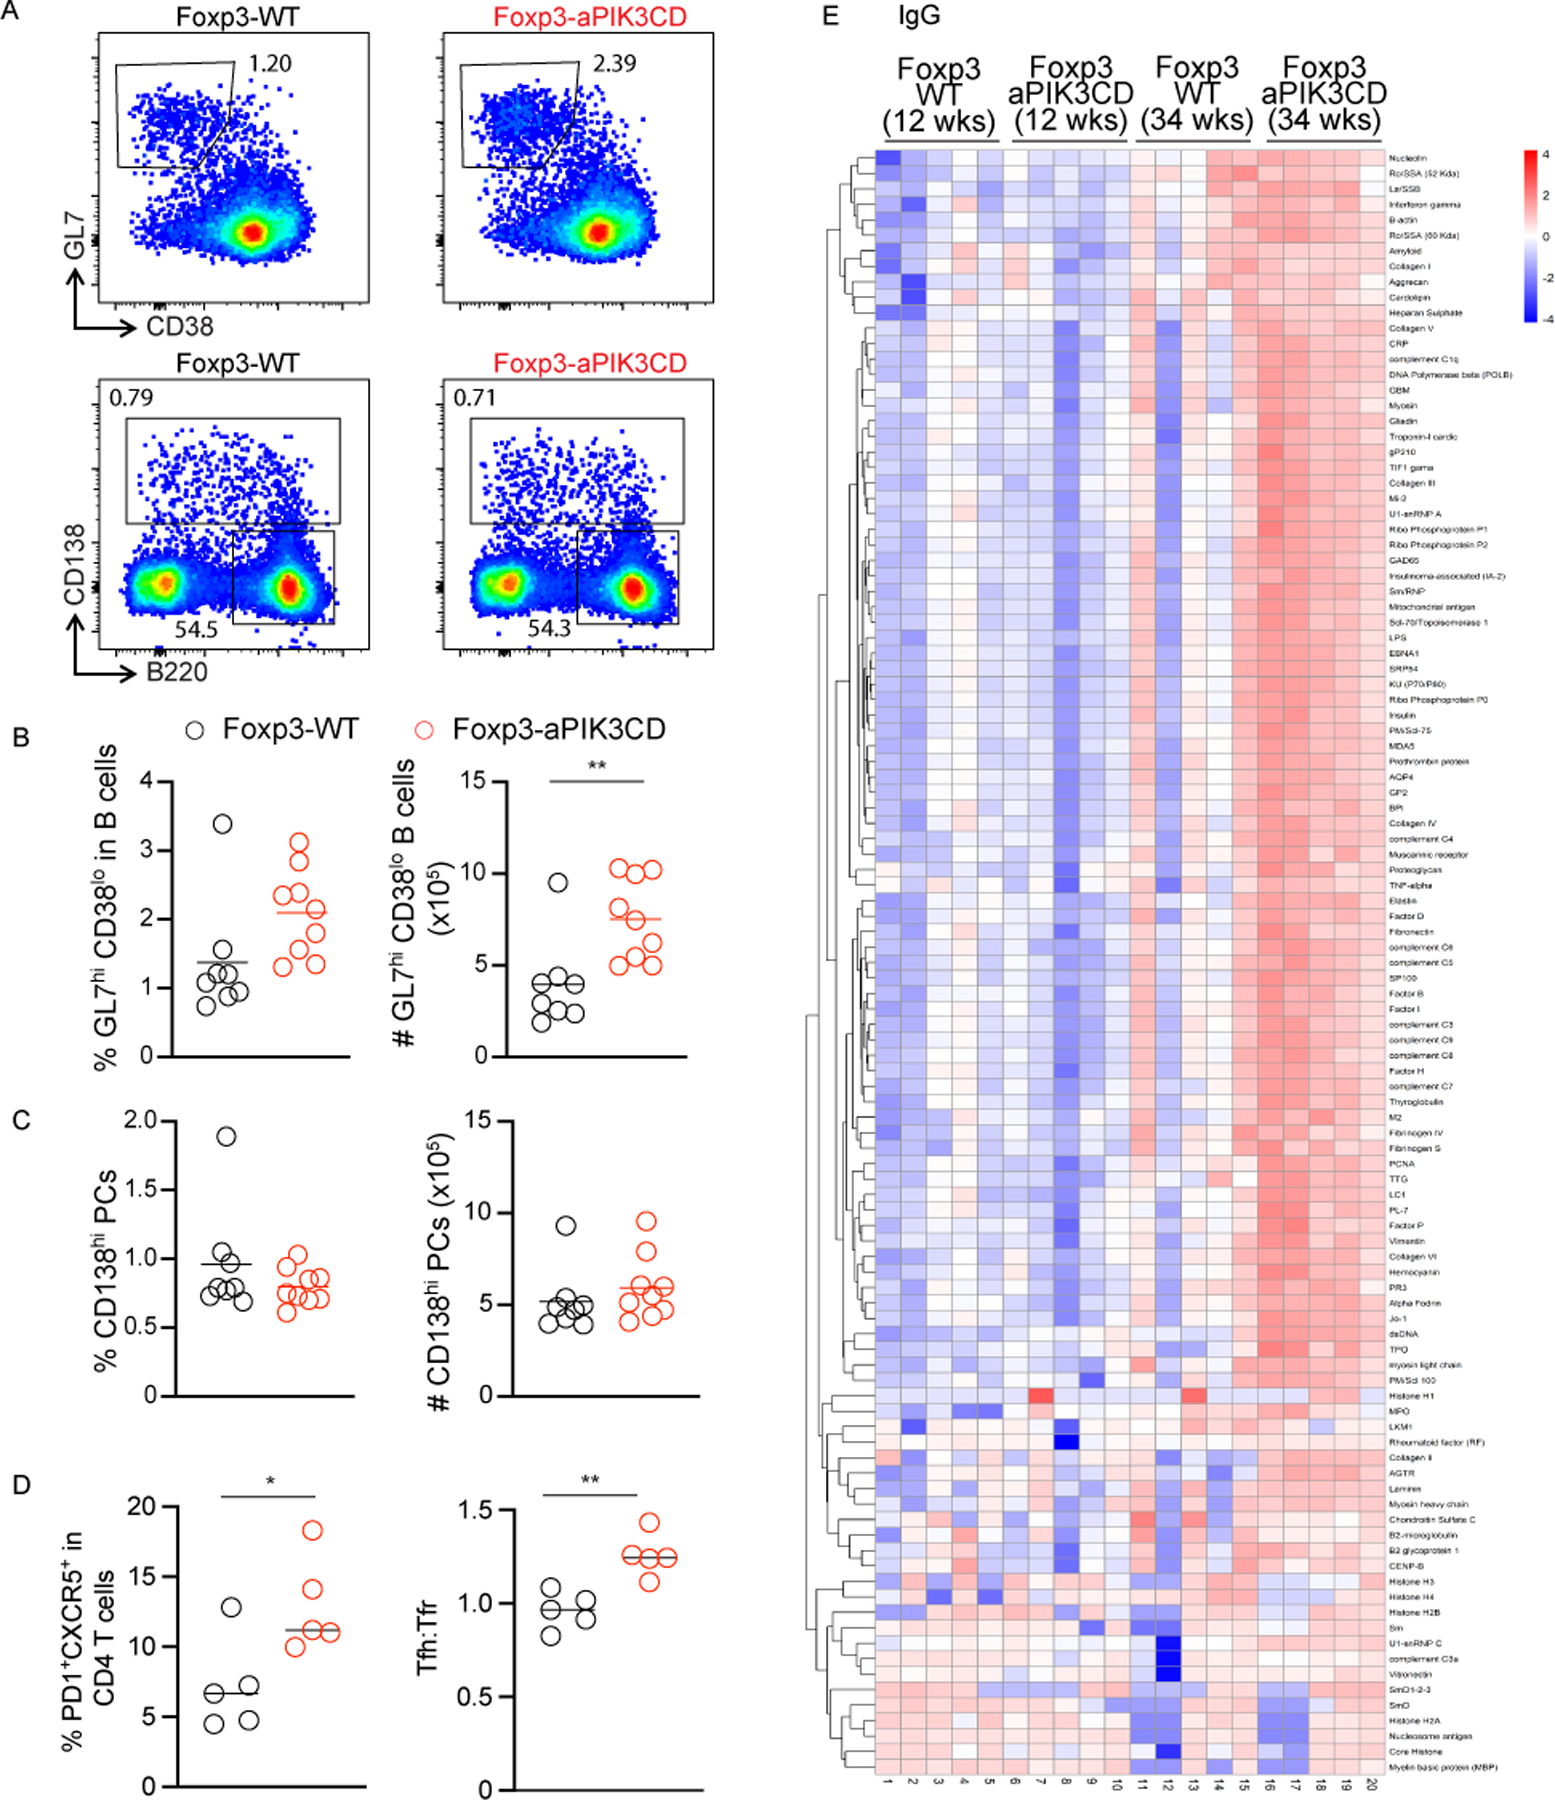
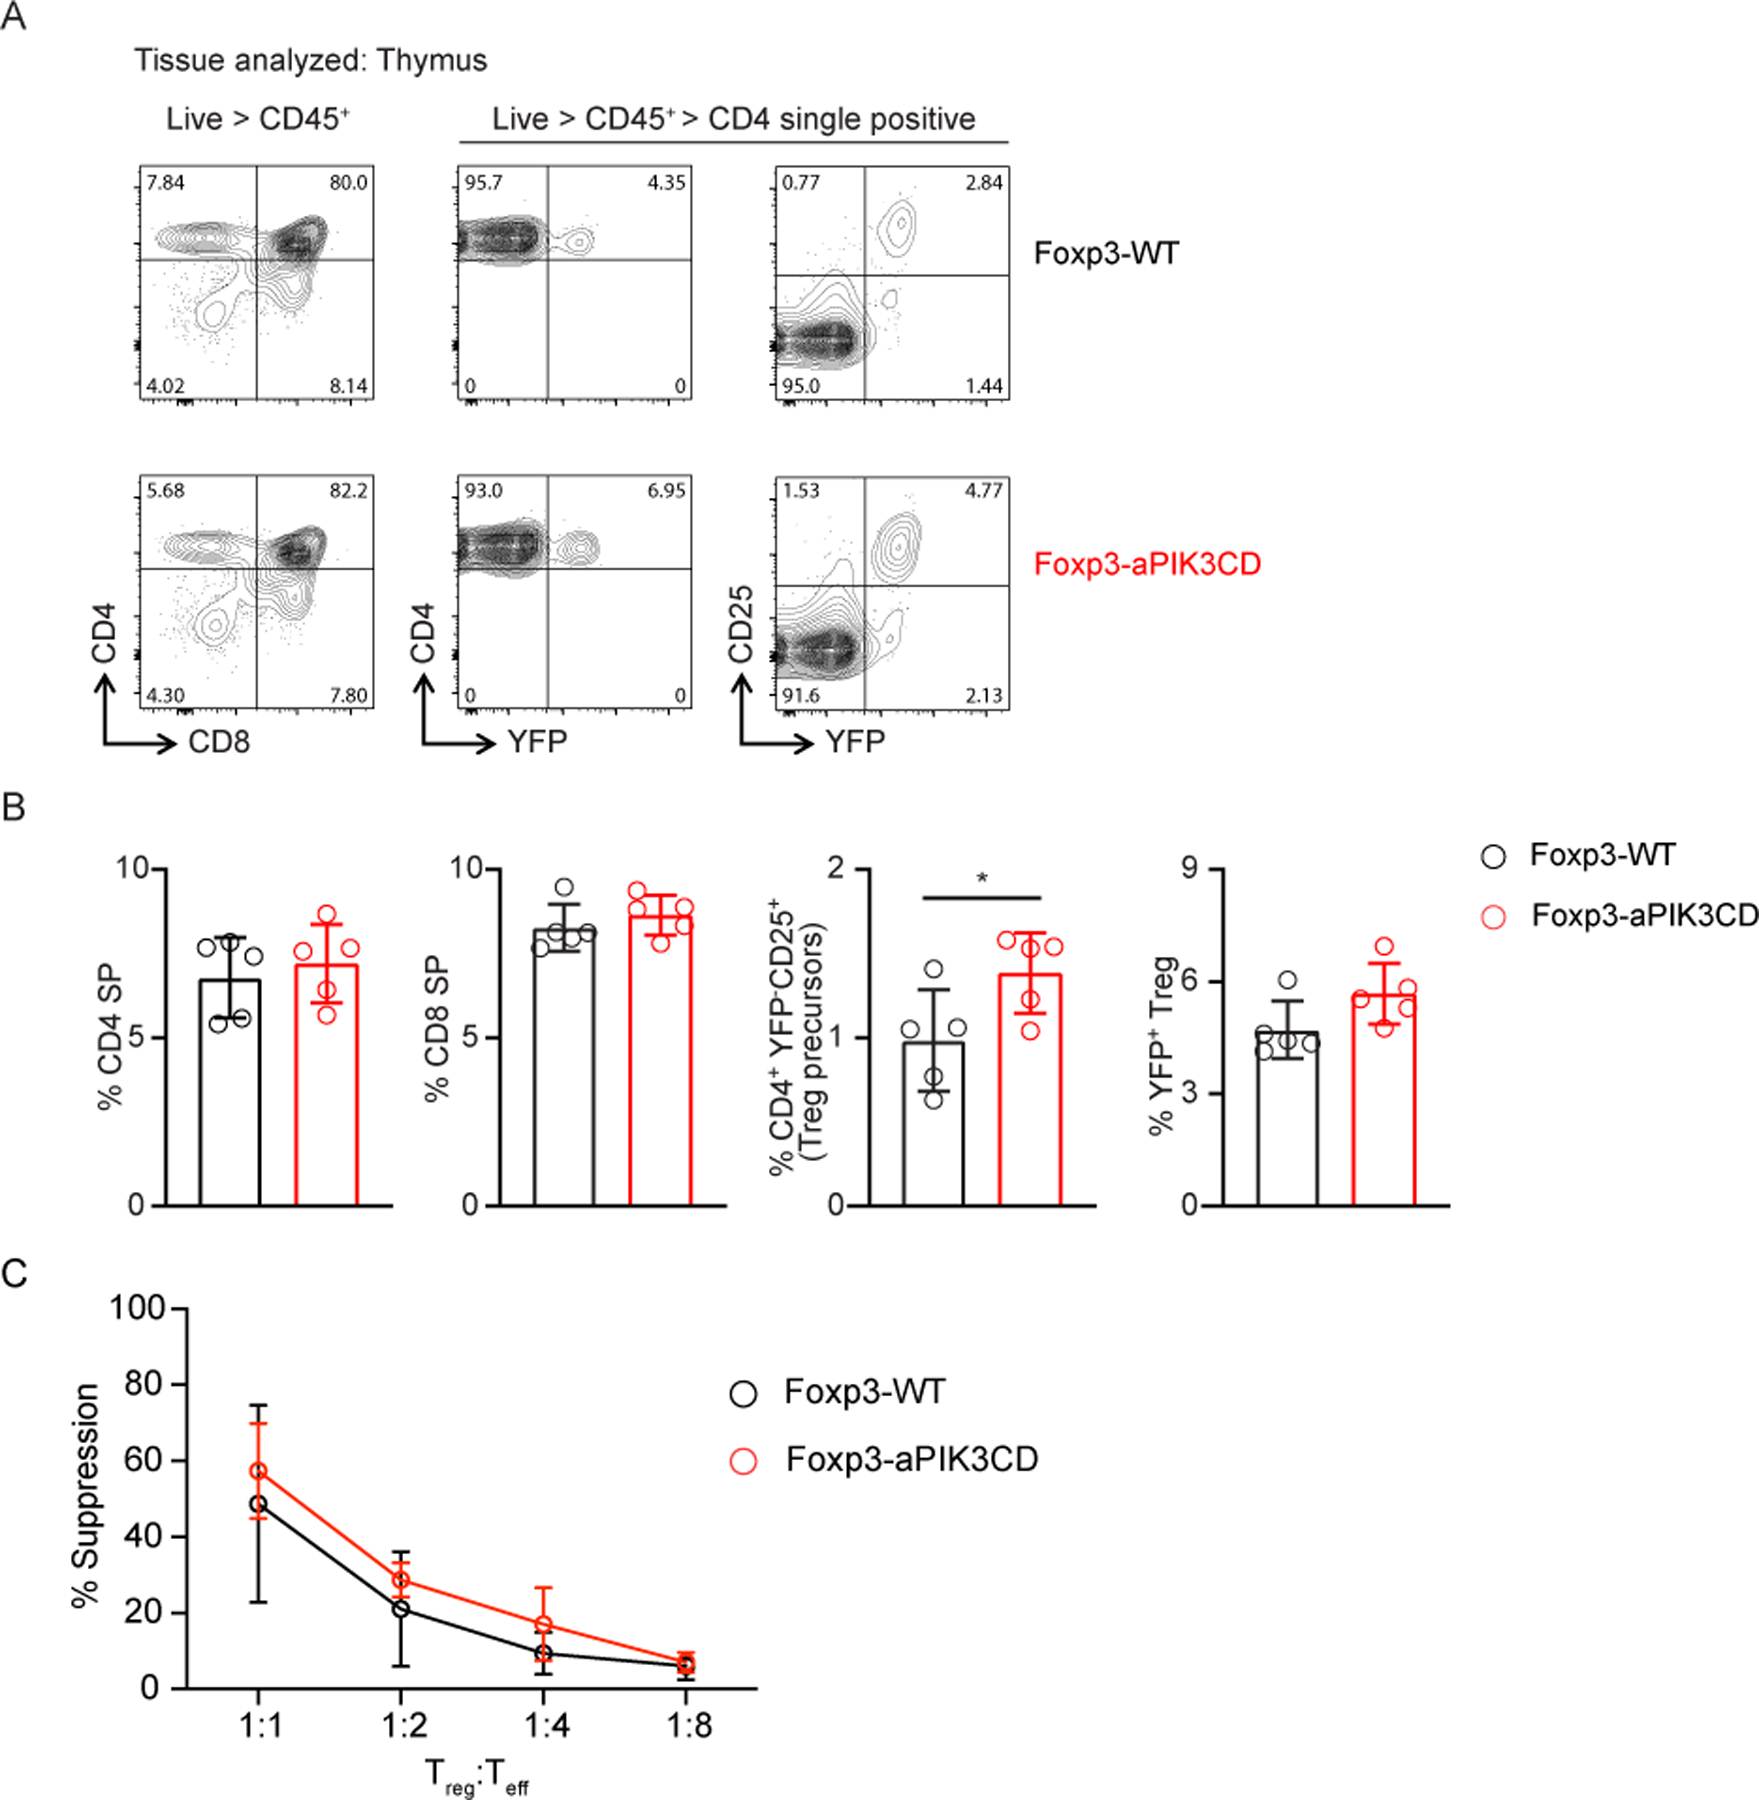
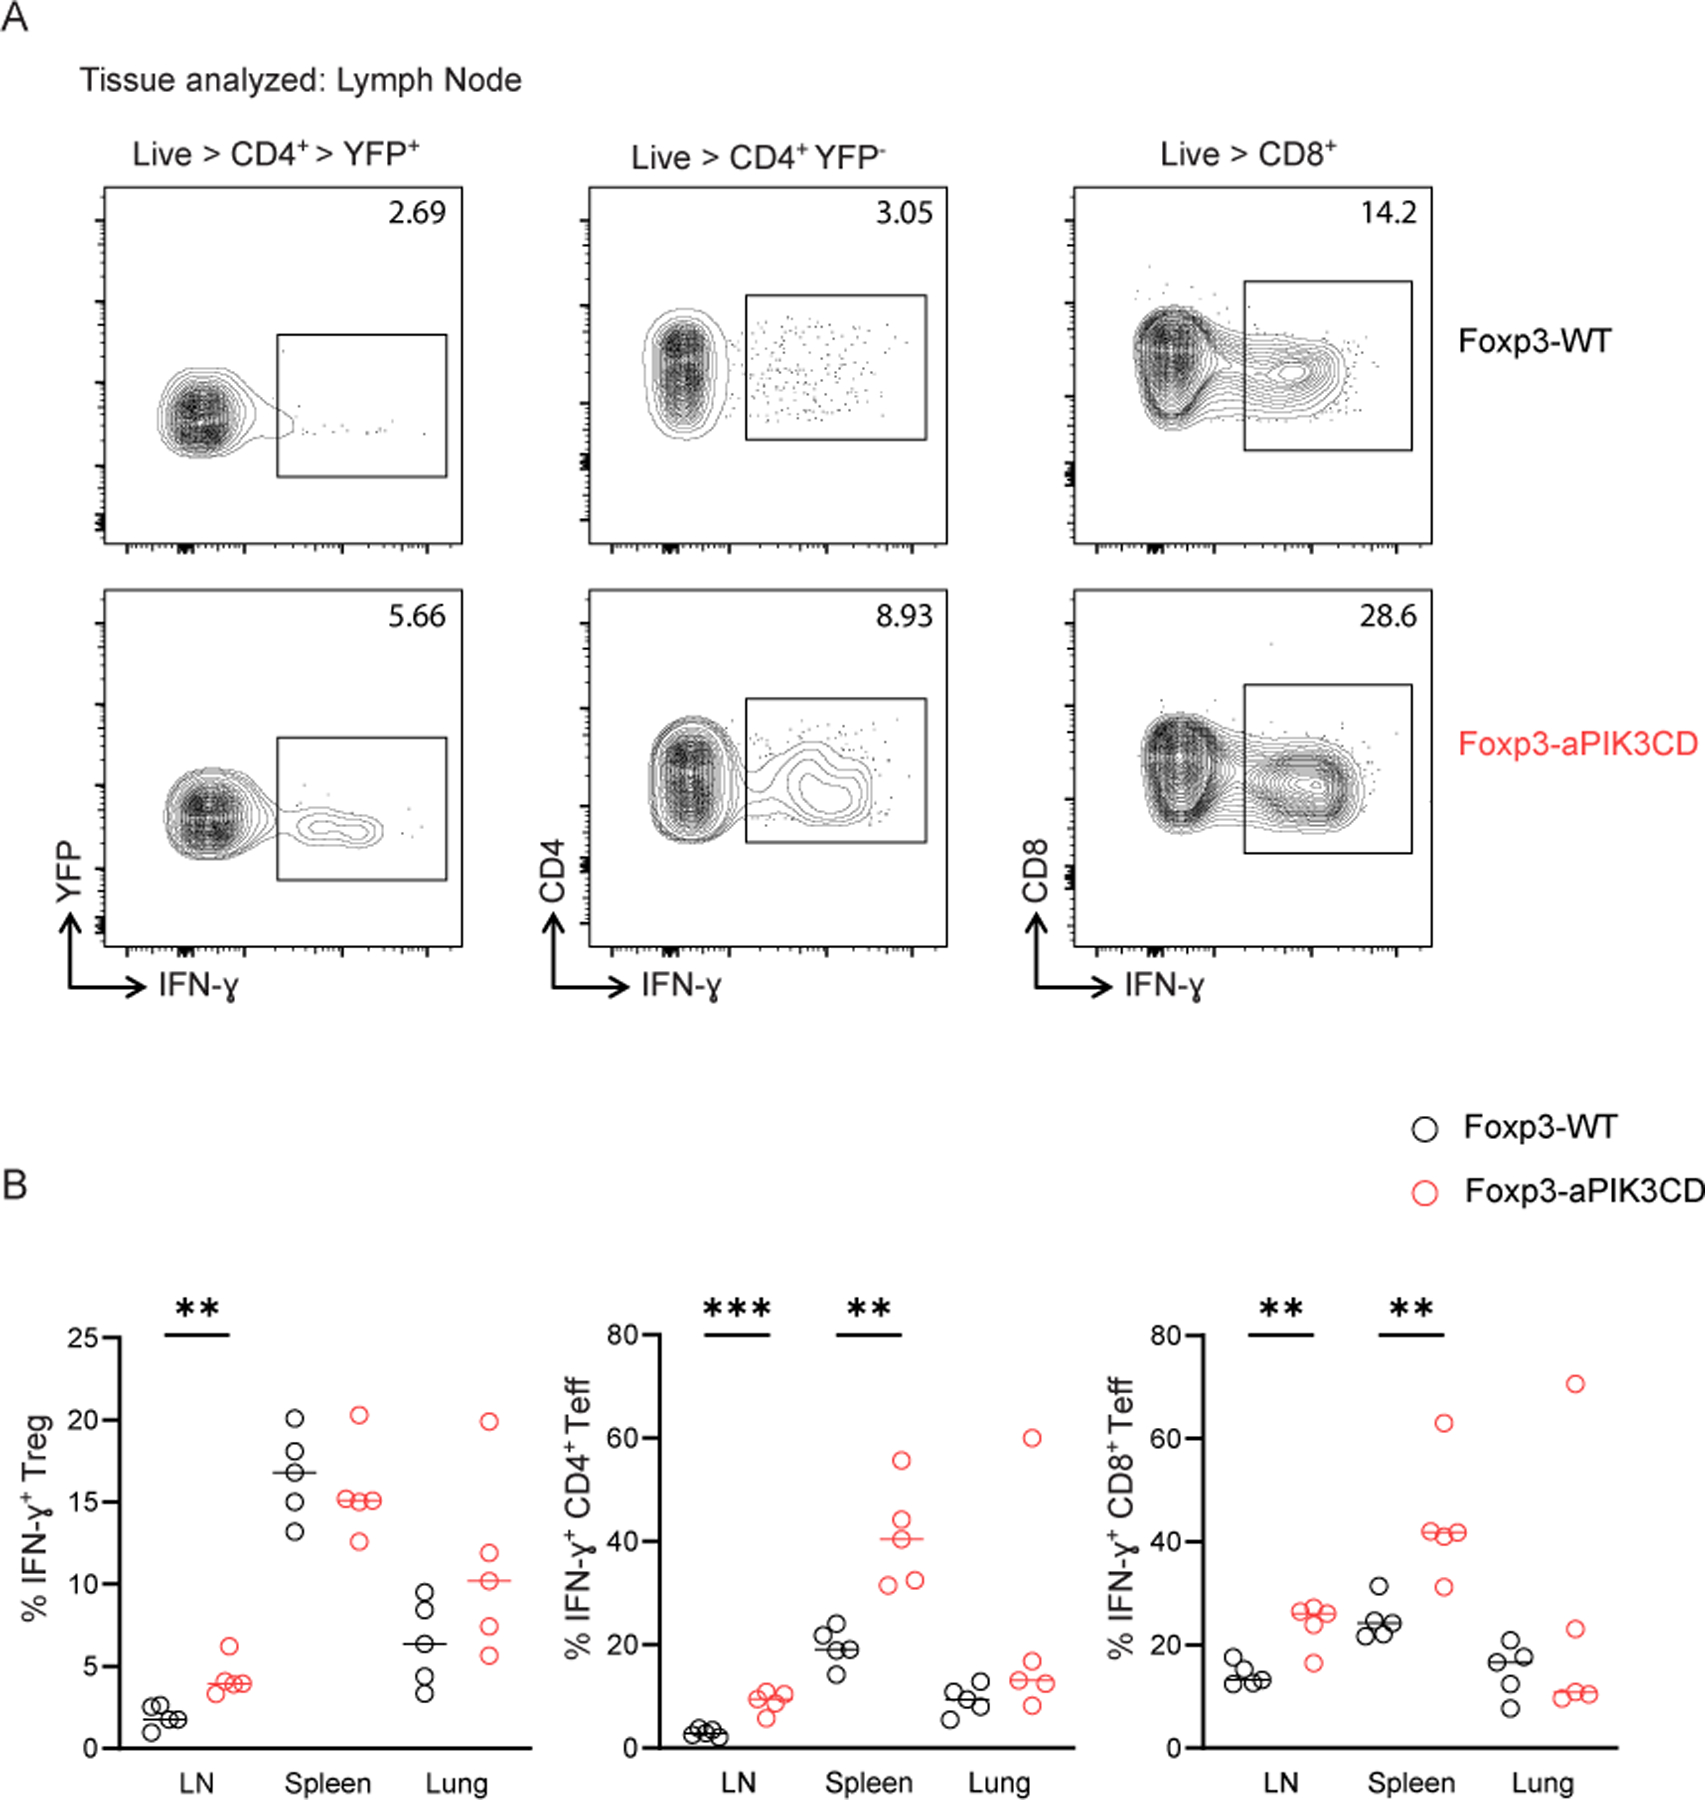
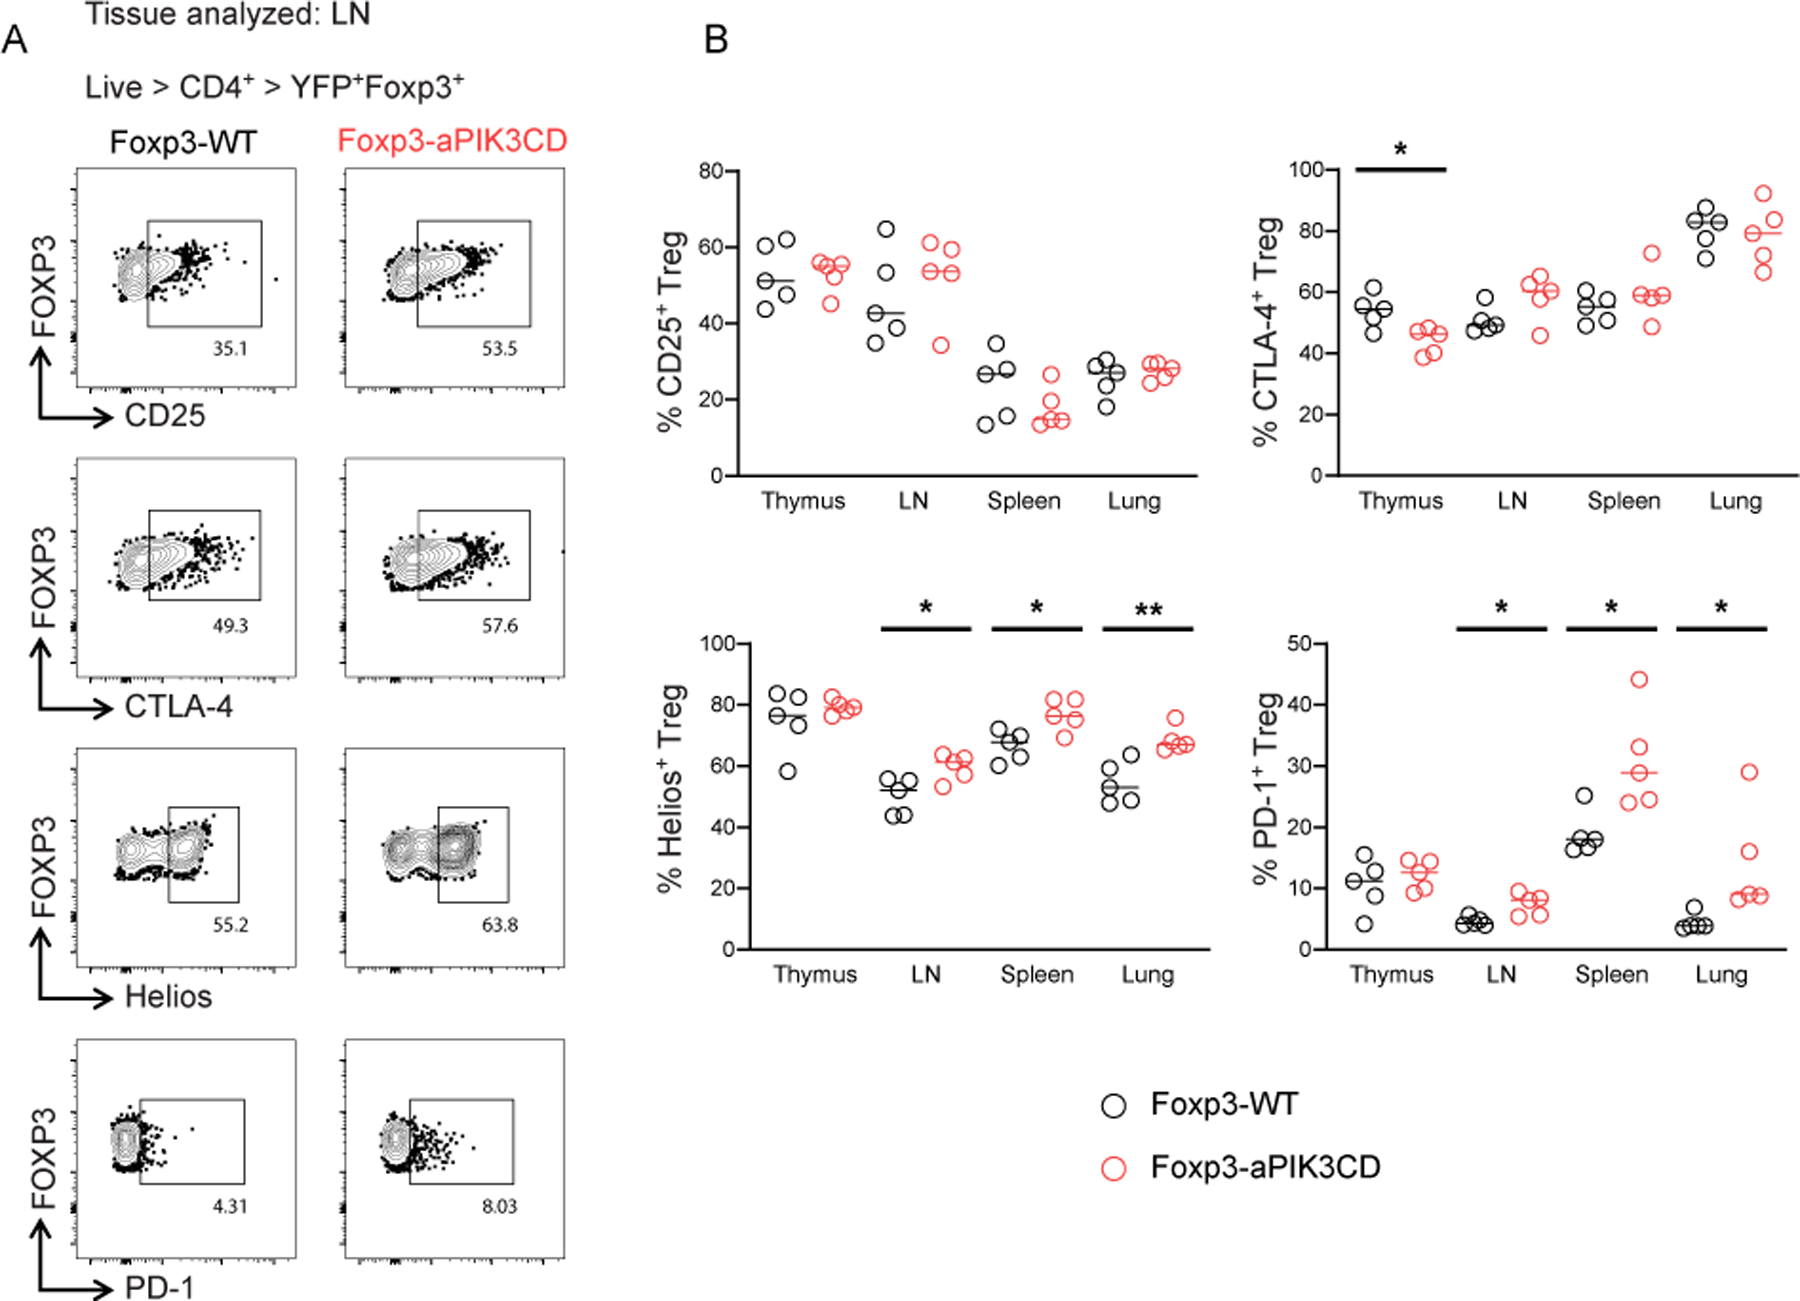
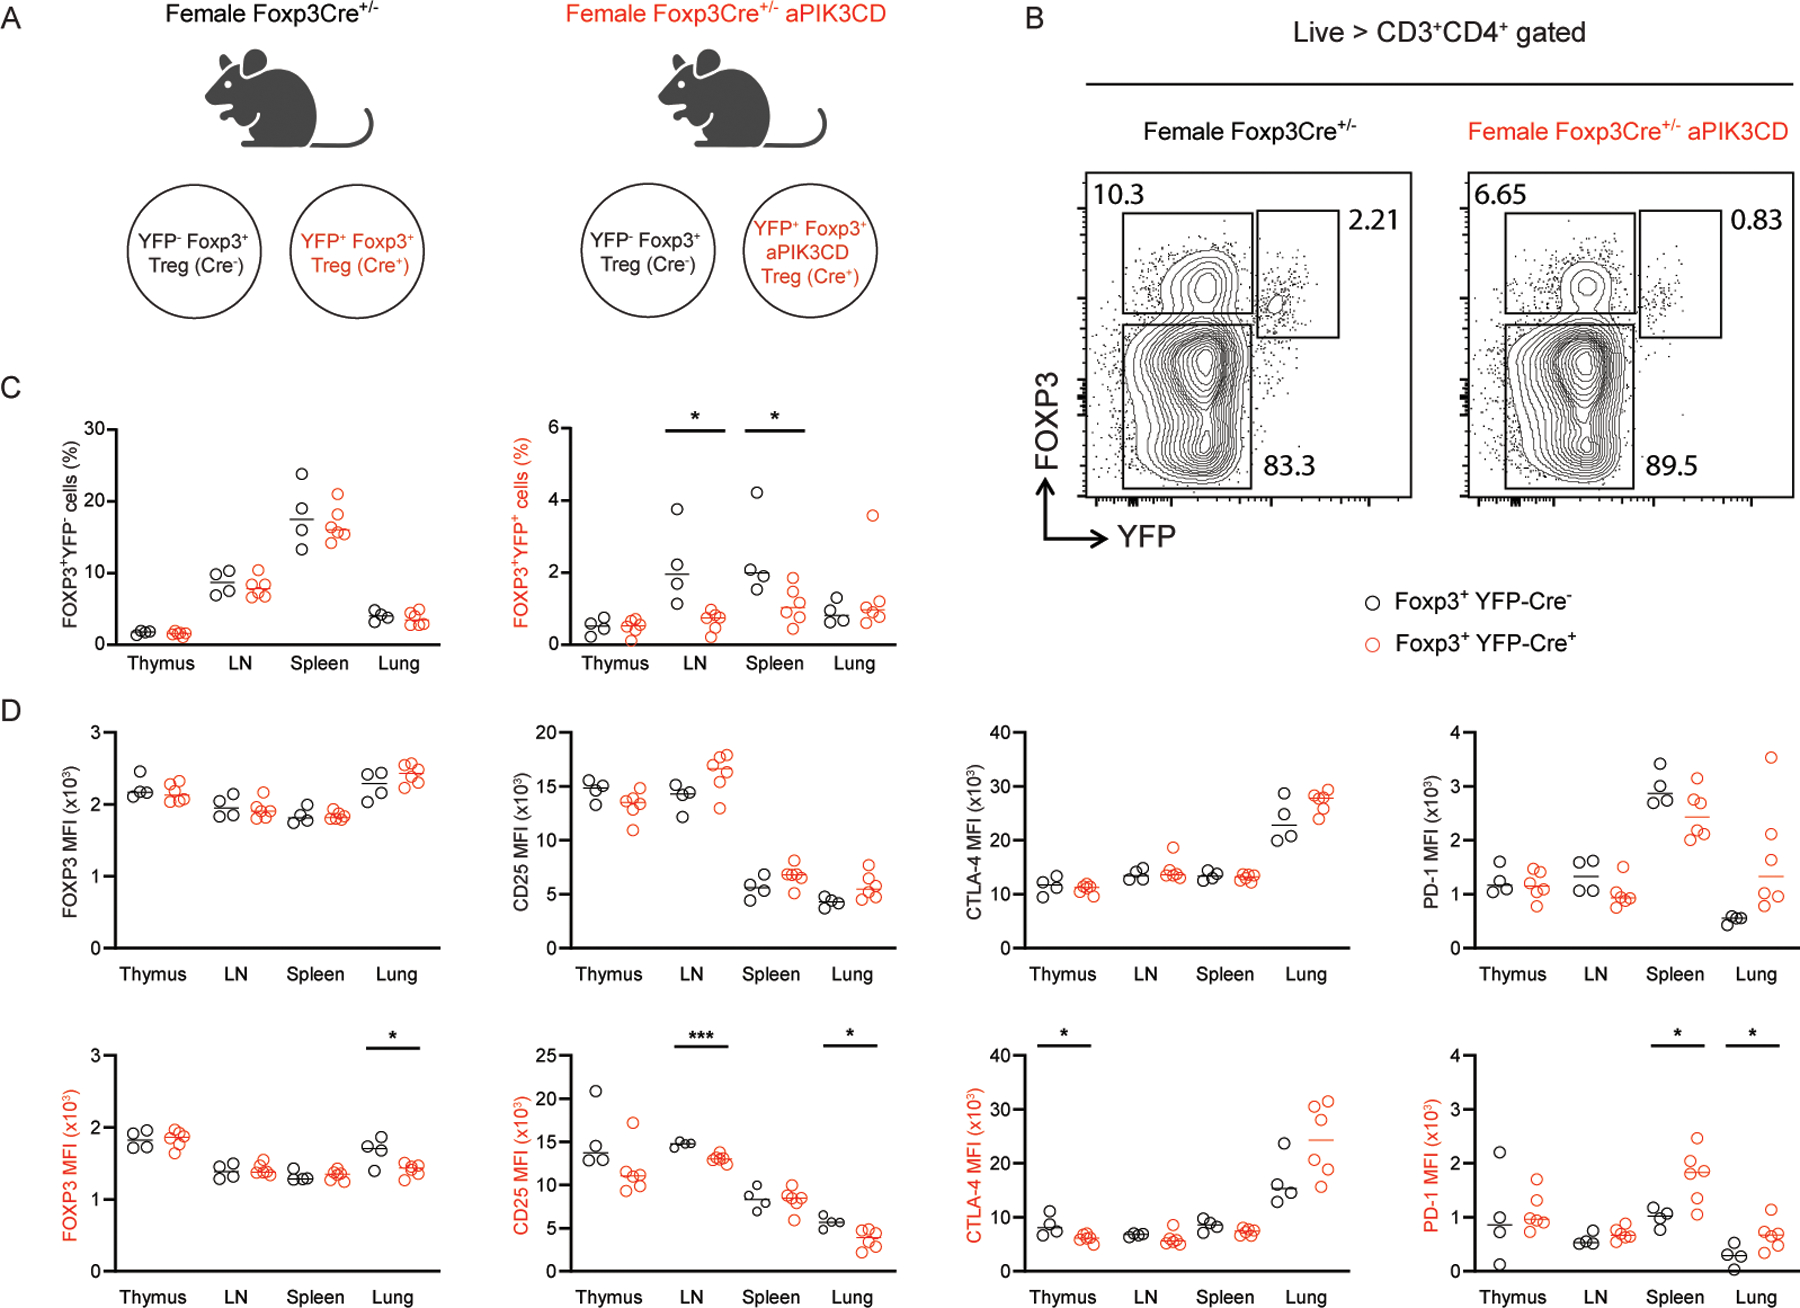
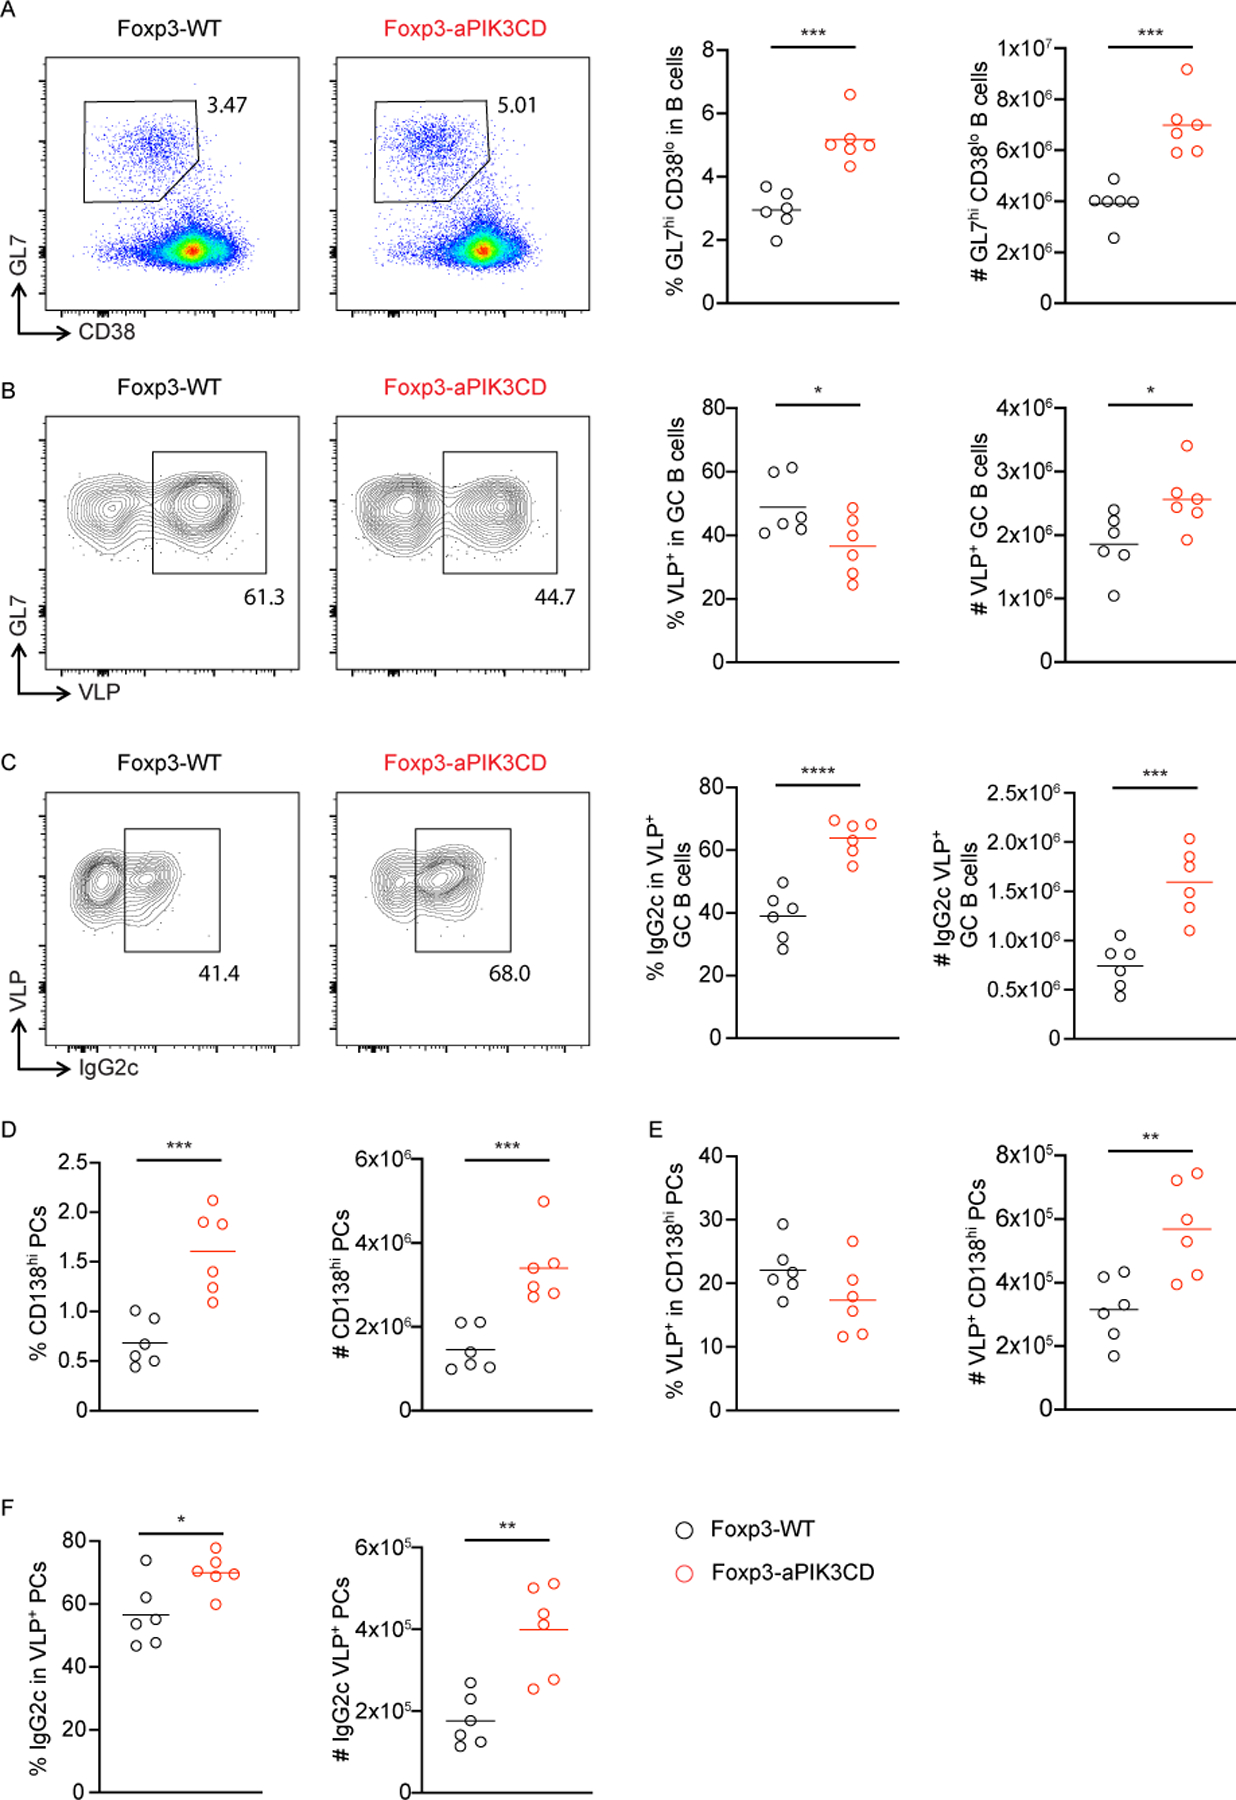
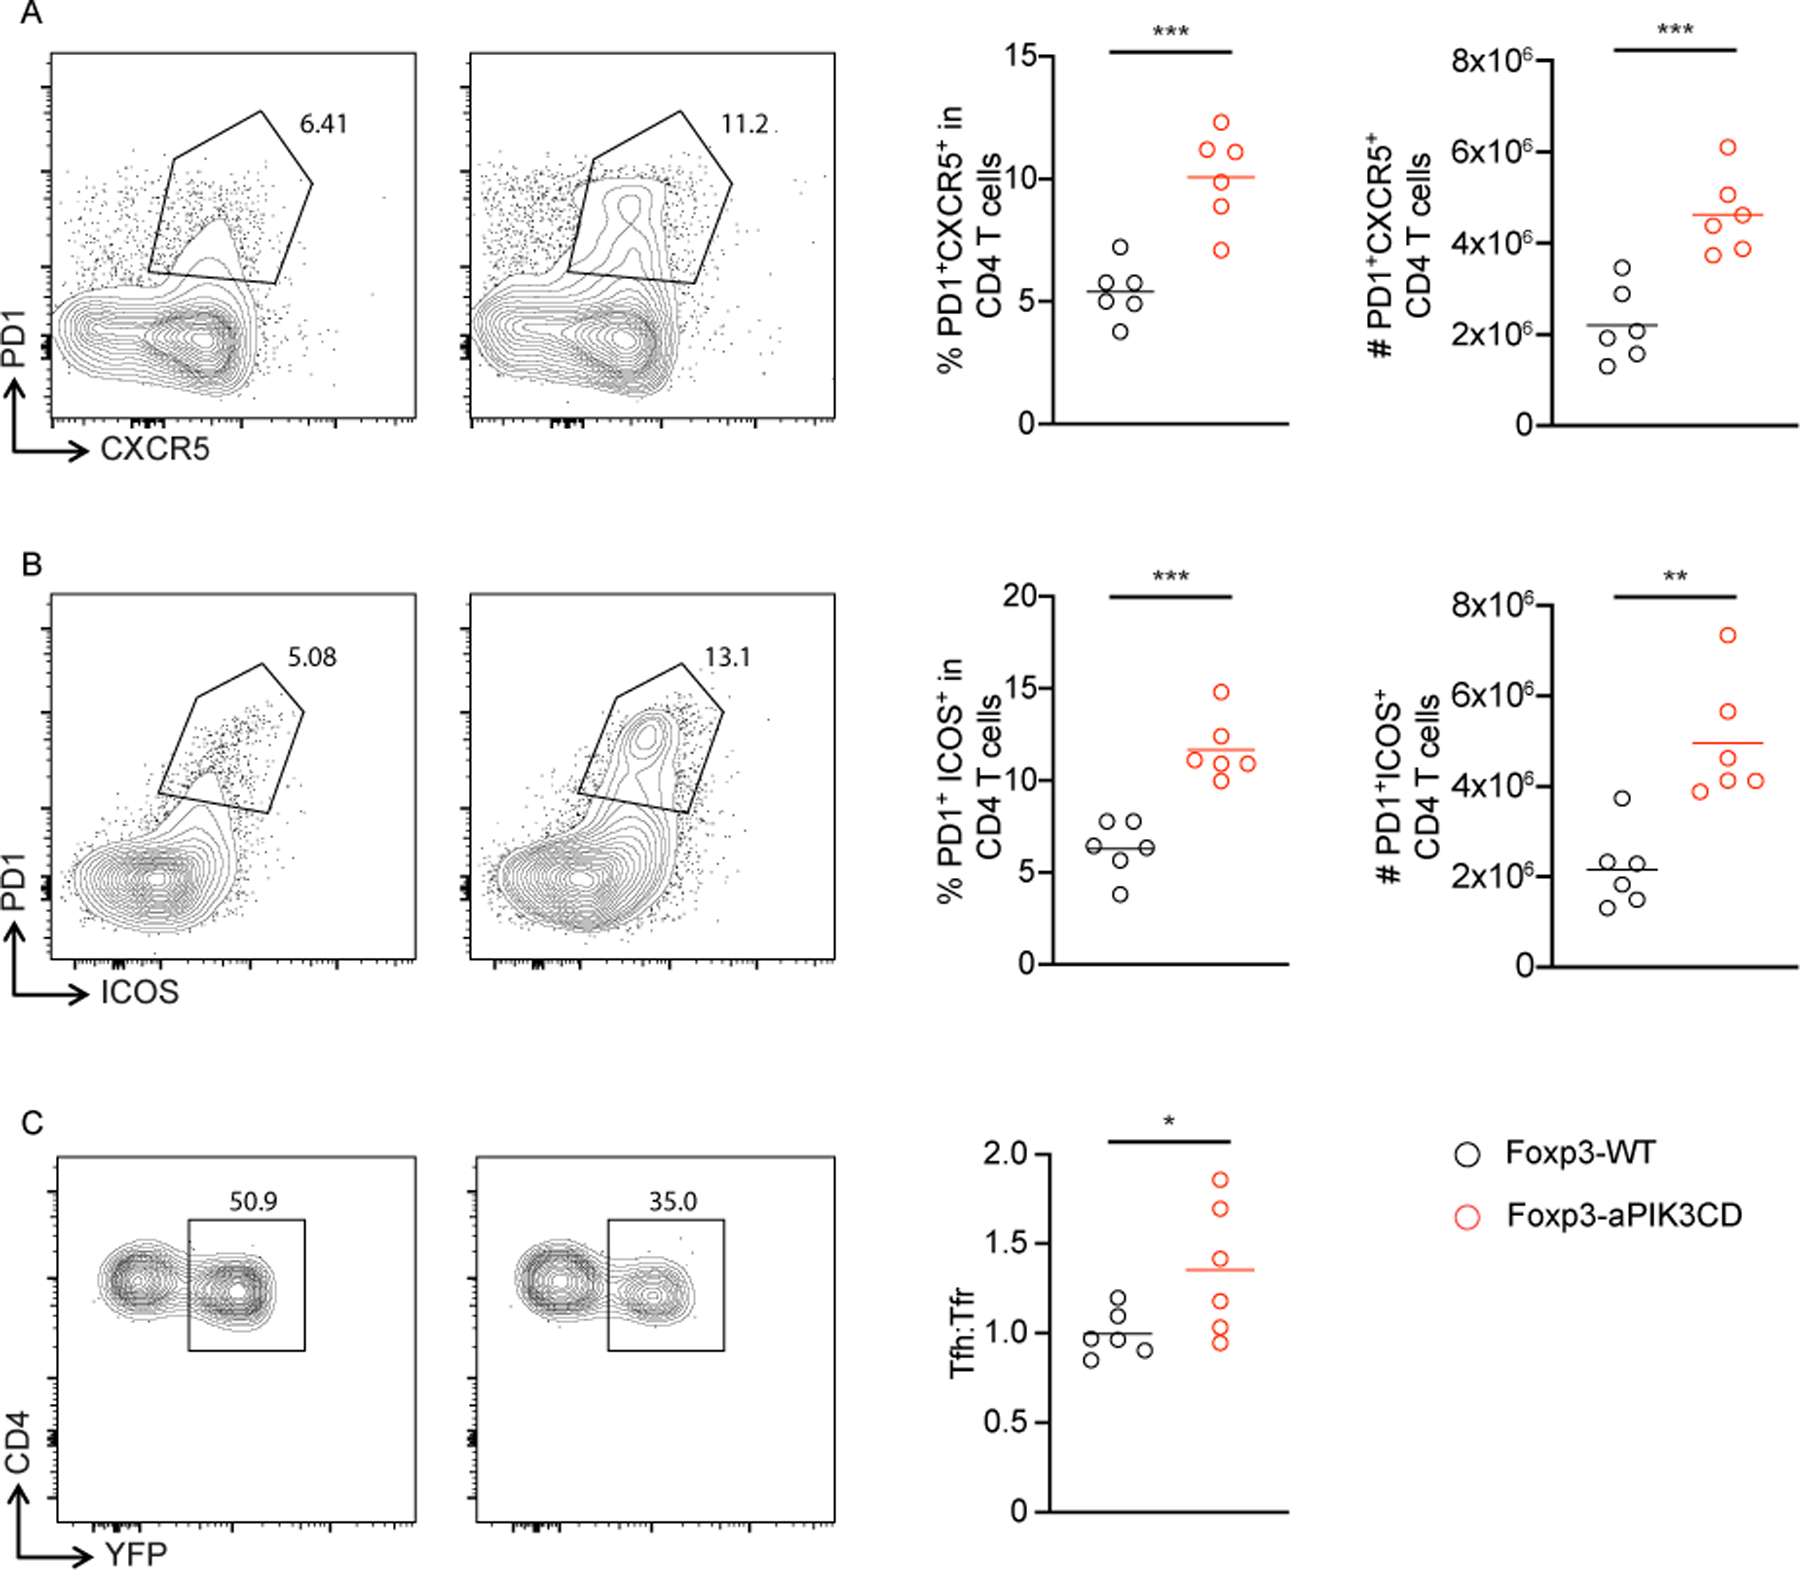
FOXP3+ regulatory T cells (Treg) are required for maintaining immune tolerance and preventing systemic autoimmunity. PI3Kδ is required for normal Treg development and function. However, the impacts of dysregulated PI3Kδ signaling on Treg function remain incompletely understood. In this study, we used a conditional mouse model of activated PI3Kδ syndrome to investigate the role of altered PI3Kδ signaling specifically within the Treg compartment. Activated mice expressing a PIK3CD gain-of-function mutation (aPIK3CD) specifically within the Treg compartment exhibited weight loss and evidence for chronic inflammation, as demonstrated by increased memory/effector CD4+ and CD8+ T cells with enhanced IFN-γ secretion, spontaneous germinal center responses, and production of broad-spectrum autoantibodies. Intriguingly, aPIK3CD facilitated Treg precursor development within the thymus and an increase in peripheral Treg numbers. Peripheral Treg, however, exhibited an altered phenotype, including increased PD-1 expression and reduced competitive fitness. Consistent with these findings, Treg-specific aPIK3CD mice mounted an elevated humoral response following immunization with a T cell-dependent Ag, which correlated with a decrease in follicular Treg. Taken together, these findings demonstrate that an optimal threshold of PI3Kδ activity is critical for Treg homeostasis and function, suggesting that PI3Kδ signaling in Treg might be therapeutically targeted to either augment or inhibit immune responses.


Figures

Figure 1.
Figure 1.. Generation and characterization of Treg-specific aPIK3CD mutant mice.
(A) Schematic representation of the generation of Foxp3-WT and Foxp3-aPIK3CD mice by crossing homozygous male aPIK3CD with homozygous female Foxp3Cre mice. (B) ddPCR analysis of genomic DNA isolated from purified Treg (CD4+YFP+) from the spleens and lymph nodes of Foxp3-aPIK3CD mice. Data is expressed as frequency of knock-in probe binding normalized to reference probe binding. Expected frequency of an aPIK3CD heterozygote mouse is ∼50% in the presence of Cre. Data is combined from two independent experiments; technical replicates were averaged, and each dot represents a biological replicate. (C) Body weight of Foxp3-aPIK3CD and age matched control Foxp3-WT mice at the time of analysis (32–35 weeks of age), n ≥ 10 mice per group. (D) Representative flow plots and (E) relative frequency of T cell subsets in Foxp3-WT and Foxp3-aPIK3CD mice. D, left two panels and E, top panels: Representative flow plots and graphs showing the frequency of CD4+, CD8+, and Treg (CD4+YFP+) in LNs. D, right two panels and E, bottom panels: Naïve (CD62LhighCD44low) and effector (CD62LlowCD44high) CD4+ and CD8+ T cells from LNs. Two independent experiments were performed (n ≥ 3 mice per group). Significance determined by t-test (unpaired). *, P < 0.05, **, P < 0.01. Graphs depict mean.
Figure 2.
Figure 2.. Foxp3-aPI3KCD mice develop spontaneous GC responses and autoantibodies.
(A) Representative flow plots showing GC B cells (GL7+CD38−) B cells (gated on B220+) and plasma cells (CD138+) in the spleen of 34-wk-old Foxp3-WT and Foxp3-aPIK3CD mice. (B) Frequency and absolute number of GC B cells in the spleen of 34-wk-old Foxp3-WT and Foxp3-aPIK3CD mice. (C) Frequency and absolute number of CD138+ PCs in the spleen of 34-wk-old Foxp3-WT and Foxp3-aPIK3CD mice. (D) Frequency of CD4+PD1+ICOS+ Tfh cells (left), and the ratio of Tfh (YFP-):Tfr (YFP+) cells (right) in the spleen of 34-wk-old Foxp3-WT and Foxp3-aPIK3CD mice. (E) Autoantibody microarray heatmap shows signal intensity of IgG autoantibodies to the most significant autoantigens in the serum of young (12wks) and old (34wks) Foxp3-WT and Foxp3-aPIK3CD mice. Two independent experiments were performed (n ≥ 3 mice per group). Significance determined by t-test (unpaired). *, P < 0.05, **, P < 0.01. Graphs depict mean.
Figure 3.
Figure 3.. Thymic Treg development and in vitro Treg suppressive activity in Foxp3-aPIK3CD mice.
(A) Representative flow plots showing the development of CD4 or CD8 single positive (SP) T cells (left panels), Treg precursors (middle panels) and Treg (right panels) in thymus of Foxp3-WT vs. Foxp3-aPIK3CD mice. (B) Graphs showing the frequency of CD4 and CD8 SP T cells (left two panels), Treg precursor (CD4 SP, CD25+YFP- T cells) and Treg (CD4+YFP+ T cells). Two independent experiments were performed (n ≥ 3 mice per group). (C) Percent suppression of CellTrace Violet-labeled effector CD4 T cells (Teff) by Treg isolated from Foxp3-aPIK3CD vs. wild-type C57BL/6 mice expressed as a function of the ratio of Treg to Teff. Significance determined by t-test (unpaired). *, P < 0.05. Graphs depict mean.
Figure 4.
Figure 4.. Dysregulated IFN-γ cytokine production by Treg and Teff in Foxp3-aPIK3CD mice.
(A) Representative flow plots showing the IFN-γ cytokine production by Treg (left panels), CD4+ Teff (middle panels) and CD8+ Teff (right panels) isolated from LNs of Foxp3-WT vs. Foxp3-aPI3K3CD mice. (B) Graphs showing the frequency of IFN-γ producing Treg, CD4+ and CD8+ T cells isolated from LNs, spleen and lung of Foxp3-WT and Foxp3-aPI3K3CD mice. Two independent experiments were performed (n ≥ 3 mice per group; ages 30–34 wks). Significance determined by t-test (unpaired). **, P < 0.01, ***, P < 0.001. Graphs depict mean.
Figure 5.
Figure 5.. Treg expressing aPIK3CD exhibit phenotypic changes including increased PD-1 levels.
(A) Representative flow plots showing the expression of Treg associated proteins in Treg isolated from LNs of Foxp3-WT (left panels) and Foxp3-aPIK3CD mice (right panels). (B) Graphs showing the frequency of Treg expressing indicated proteins (CD25, CTLA-4, Helios, PD-1) in thymus, LNs, spleen and lung of Foxp3-WT and Foxp3-aPIK3CD mice. Two independent experiments were performed (n ≥ 3 mice per group; ages 30-34wks). Significance determined by t-test (unpaired). *, P < 0.05 **, P < 0.01, Graphs depict mean.
Figure 6.
Figure 6.. Treg expressing aPIK3CD exhibit a competitive disadvantage in vivo.
(A) Schema showing the strategy for tracking WT vs aPIK3CD Treg in vivo in heterozygous carrier female mice. (B) Representative flow plots used to identify Foxp3+YFP- (upper left gate) and Foxp3+YFP+ (upper right gate) in female Foxp3Cre/WT control (left) vs. Foxp3Cre/WT aPIK3CD (right) “test” mice. (C) Graphs showing the frequency of control Foxp3+YFP- (left) and test Foxp3+YFP+ (right) Treg in thymus, LNs, spleen and lung of Foxp3Cre/WT vs. Foxp3Cre/WT aPIK3CD female mice. (D) Graphs showing the mean fluorescent intensity of Foxp3, CD25, CTLA-4 and PD-1 on Foxp3+YFP- gated Treg (upper panels) and Foxp3+YFP+ gated Treg (lower panels). Two independent experiments were performed (n ≥ 4 mice per group). Significance determined by t-test (unpaired). *, P < 0.05 ***, P < 0.001, Graphs depict mean.
Figure 7.
Figure 7.. Treg-specific aPIK3CD mice exhibit an enhanced GC response following VLP immunization.
(A) Left plots, representative flow cytometry analysis of GL7+CD38 GC B cells (initially gated on B220+ cells) in the spleen of 12- to 14-wk-old Foxp3-WT and Foxp3-aPIK3CD mice 14 days after intraperitoneal immunization with VLP-ssRNA. Right graphs, frequencies and absolute numbers of GC B cells. (B) Left plots, representative flow cytometry analysis of VLP-specific B cells within GC in mice as described in A. Right graphs, frequency and absolute numbers of VLP-specific GC B cells. (C) Left plots, representative flow cytometry analysis of IgG2c+ VLP+ GC B cells. Right graphs, frequency and absolute numbers of IgG2c+ VLP+ GC B cells. (D) Frequency and absolute number of total CD138+ PCs in Foxp3-WT or Foxp3-aPIK3CD mice at day 14 after immunization with VLP-ssRNA. (E) Frequency and absolute number of VLP-specific PCs in Foxp3-WT or Foxp3-aPIK3CD. (F) Frequency and absolute numbers of IgG2c+ VLP+ PCs. Data are combined from two independent experiments (n = 6). Significance determined by unpaired Student’s t test. *, P < 0.05; **, P < 0.01; ***, P < 0.001; ****, P < 0.0001. Graphs depict mean.
Figure 8.
Figure 8.. Treg-specific aPIK3CD mice exhibit a skewed Tfh:Tfr ratio following VLP immunization.
(A) Left plots show representative flow cytometry analysis of PD1+CXCR5+ Tfh cells (gated on CD4+ cells) in the spleen of 12- to 14-wk-old Foxp3-WT and Foxp3-aPIK3CD mice at day 14 d after intraperitoneal immunization with VLP-ssRNA. Right graphs show frequency and absolute numbers of PD1+CXCR5+ Tfh cells. (B) Left plots show representative flow cytometry analysis of PD1+ICOS+ Tfh cells (gated on CD4+ cells) in the spleen of 12- to 14-wk-old Foxp3-WT and Foxp3-aPIK3CD mice at day 14 after immunization with VLP-ssRNA. Right graphs show frequency and absolute numbers of PD1+ICOS+ Tfh cells. (C) Left plots show representative flow cytometry analysis of Tfr cells gated on YFP+ cells within the PD1+CXCR5+ T cell population. Right graphs show ratio of Tfh (YFP-):Tfr (YFP+) cells. Data are combined from two independent experiments (n = 6). Significance determined by unpaired Student’s t test. **, P < 0.01; ***, P < 0.001. Graphs depict mean.

Update of

Similar articles

Cited by

References

    1. Hori S, Nomura T, and Sakaguchi S. 2003. Control of regulatory T cell development by the transcription factor Foxp3. Science 299: 1057–1061. - PubMed
    1. Fontenot JD, Gavin MA, and Rudensky AY. 2003. Foxp3 programs the development and function of CD4+CD25+ regulatory T cells. Nat Immunol 4: 330–336. - PubMed
    1. Huynh A, Zhang R, and Turka LA. 2014. Signals and pathways controlling regulatory T cells. Immunol Rev 258: 117–131. - PubMed
    1. Preite S, Gomez-Rodriguez J, Cannons JL, and Schwartzberg PL. 2019. T and B-cell signaling in activated PI3K delta syndrome: From immunodeficiency to autoimmunity. Immunol Rev 291: 154–173. - PubMed
    1. Fruman DA, Chiu H, Hopkins BD, Bagrodia S, Cantley LC, and Abraham RT. 2017. The PI3K Pathway in Human Disease. Cell 170: 605–635. - PMC - PubMed

Publication types

MeSH terms

Substances

Supplementary concepts