. 2024 Jul 3;262(2):e240024.
doi: 10.1530/JOE-24-0024. Print 2024 Aug 1.

ATP-binding cassette family C member 1 constrains metabolic responses to high-fat diet in male mice

Affiliations

ATP-binding cassette family C member 1 constrains metabolic responses to high-fat diet in male mice

Elisa Villalobos et al. J Endocrinol. .

Abstract

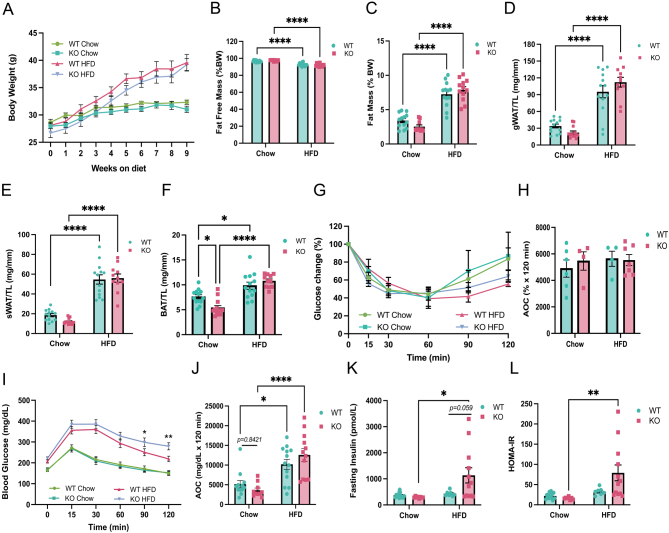
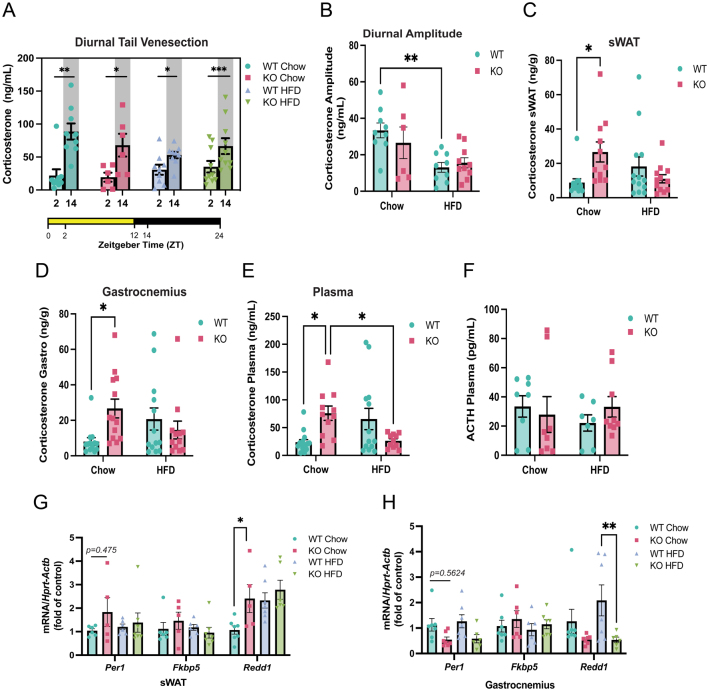
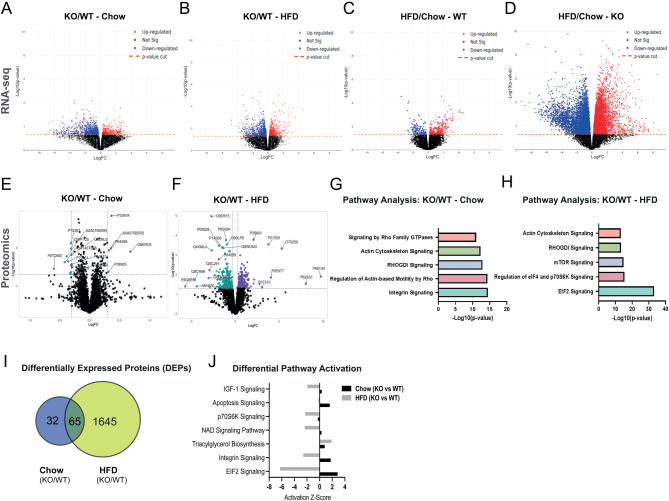
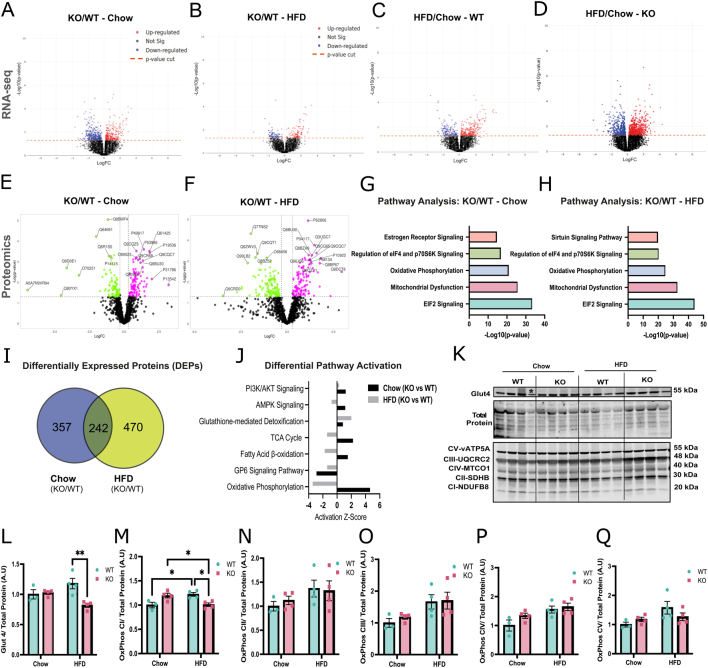
Glucocorticoids modulate glucose homeostasis, acting on metabolically active tissues such as liver, skeletal muscle, and adipose tissue. Intracellular regulation of glucocorticoid action in adipose tissue impacts metabolic responses to obesity. ATP-binding cassette family C member 1 (ABCC1) is a transmembrane glucocorticoid transporter known to limit the accumulation of exogenously administered corticosterone in adipose tissue. However, the role of ABCC1 in the regulation of endogenous glucocorticoid action and its impact on fuel metabolism has not been studied. Here, we investigate the impact of Abcc1 deficiency on glucocorticoid action and high-fat-diet (HFD)-induced obesity. In lean male mice, deficiency of Abcc1 increased endogenous corticosterone levels in skeletal muscle and adipose tissue but did not impact insulin sensitivity. In contrast, Abcc1-deficient male mice on HFD displayed impaired glucose and insulin tolerance, and fasting hyperinsulinaemia, without alterations in tissue corticosterone levels. Proteomics and bulk RNA sequencing revealed that Abcc1 deficiency amplified the transcriptional response to an obesogenic diet in adipose tissue but not in skeletal muscle. Moreover, Abcc1 deficiency impairs key signalling pathways related to glucose metabolism in both skeletal muscle and adipose tissue, in particular those related to OXPHOS machinery and Glut4. Together, our results highlight a role for ABCC1 in regulating glucose homeostasis, demonstrating diet-dependent effects that are not associated with altered tissue glucocorticoid concentrations.

Keywords: glucocorticoids; homeostasis; metabolism; obesity; steroids; transport.


Conflict of interest statement

All the authors declare no conflict of interest, financial or otherwise. Ruth Andrew is the Co-Editor-in-Chief of the Journal of Endocrinology. Ruth Andrew was not involved in the review or editorial process for this paper, on which she is listed as an author.

Figures

Figure 1
Figure 1
Comparison of metabolic profile between age-matched Abcc1-deficient mice (KO) and wild-type littermates (WT) mice shows amplified insulin resistance in Abcc1 KO on high-fat diet (HFD). Animals (12–13 per group) were fed either a chow diet or HFD feeding started at 8 to 10 weeks of age and continued for 9 weeks. (A) Body weight, measured weekly, in WT and KO male mice while receiving chow and HFD. Data were analysed by a mixed-effect model with Holm–Sidak’s multiple comparisons tests (time: P < 0.01, experimental group: P < 0.01, interaction: P < 0.01). (B) Percentage (%) of fat-free mass (diet: P < 0.01, genotype: P = 0.77, interaction: P = 0.06) and fat mass (diet: P < 0.01, genotype: P = 0.77, interaction: P = 0.06) (C), with respect to total body weight, at the end of the study. (D) Weight of gonadal white adipose tissue (gWAT), (E) subcutaneous white adipose tissue (sWAT), and (F) brown adipose tissue (BAT), normalised by the length of the tibia (TL) (diet: P < 0.01, genotype: P = 0.23, interaction: P < 0.01). Metabolic tests were performed after 7–8 weeks of chow or HFD, after 5 h of fast. (G) Intraperitoneal insulin tolerance test (IP-ITT) performed after 7 weeks of dietary intervention in WT and KO mice, results shown as glucose change (percentage) from baseline (time: P < 0.01, experimental group: P = 0.67, interaction: P = 0.10), and (H) quantification of area over the curve (AOC) (diet: P = 0.50, genotype: P = 0.69, interaction: P = 0.57), (n = 4–7 animals per group). (I) Intraperitoneal glucose tolerance test (IP-GTT) performed after 8 weeks of dietary intervention in WT and KO mice (time: P < 0.01, experimental group: P < 0.01, interaction: P < 0.01), and (J) quantification of area over the curve (AOC) (diet: P < 0.01, genotype: P = 0.73, interaction: P = 0.11) (n = 8–13 animals per group). (K) Fasting insulin levels in WT and KO mice after 7 weeks of dietary intervention (diet: P = 0.01, genotype: P = 0.09, interaction: P = 0.04). (L) Homeostatic model assessment for insulin resistance (HOMA-IR) (diet: P < 0.01, genotype: P = 0.11, interaction: P = 0.04). *P < 0.05, **P < 0.01, ***P < 0.001, ****P < 0.0001 by repeated measures ANOVA (A) and two-way ANOVA with Tukey’s multiple comparisons test. Data are expressed as mean ± s.e.m.
Figure 2
Figure 2
Deficiency of Abcc1 induces accumulation of corticosterone in plasma, subcutaneous adipose tissue, and gastrocnemius muscle in lean but not obese mice. Steroid levels were evaluated by LC-MS/MS in plasma and tissue samples of wild-type (WT) and Abcc1-deficient (KO) male mice at week 7 and at the end of the study (week 9). (A) Corticosterone levels in plasma of mice obtained by tail venesection. Samples were collected at week 7 of the study, at 2 and 14 h after light onset (Zeitgeber time). (B) Quantification of corticosterone diurnal amplitude in (A) (diet: P < 0.01, genotype: P = 0.62, interaction: P = 0.29), n = 6–10, animals per group. Levels of corticosterone in terminal samples of (C) subcutaneous white adipose tissue (diet: P= 0.47, genotype: P = 0.22, interaction: P < 0.01), (D) gastrocnemius muscle (diet: P = 0.96, genotype: P = 0.21, interaction: P = 0.02) and (E) plasma (diet: P = 0.75, genotype: P = 0.59, interaction: P < 0.01), n = 8–13, animals per group. (F) Plasma levels of adrenocorticotropic hormone (ACTH) (diet: P = 0.73, genotype: P = 0.75, interaction: P = 0.34), n = 7–8, animals per group. (G) Evaluation of glucocorticoid-responsive genes (Per1, Fkbp5 and Redd1) in subcutaneous white adipose tissue, and (H) gastrocnemius muscle by qRT-PCR (n = 6–7, animals per group). *P < 0.05, **P < 0.01. Data were analysed by two-way ANOVA with Tukey’s multiple comparisons test and expressed as mean ± s.e.m.
Figure 3
Figure 3
Transcriptomic and proteomic analyses of subcutaneous adipose tissue reveal an amplified impact of HFD in Abcc1-deficient mice. (A) Volcano plot showing the log10 transformed unadjusted P-values against log2 fold change of all the genes identified in sWAT between wild-type (WT) and Abcc1-deficient (KO) mice fed with chow diet or (B) HFD during 9 weeks, and between HFD and chow diet in (C) WT and (D) KO mice. (E) Volcano plot showing the differential expression analysis of proteins in sWAT between WT and KO mice fed with control diet (chow) or (F) HFD for 9 weeks. Proteins differentially expressed are shown in purple (upregulated) and green (downregulated). (G) Ingenuity pathway analysis (IPA) of differentially expressed proteins (DEPs) in sWAT of WT and KO mice fed chow diet and (H) HFD. The x-axis indicates −log10 of the P-value, and y-axis indicates the corresponding canonical pathways. (I) Venn diagram showing proteins included in the IPA analysis in J, with differential expression (FC + 2) in KO compared with WT in response to the diets. (J) Comparative analysis of differential activation of pathways identified in KO vs WT mice under chow and HFD conditions. The x-axis indicates Z-score explaining activation of the pathways on the y-axis. Both omics analyses were performed in four animals per experimental group.
Figure 4
Figure 4
Proteomic and pathway analyses of Abcc1-deficient mice in gastrocnemius muscle reveal impairment in oxidative phosphorylation in mice exposed to HFD. (A) Volcano plot showing log10 transformed unadjusted P-values against log2 fold change of all the genes identified in gastrocnemius muscle between WT and Abcc1 KO mice fed with chow diet or (B) HFD for 9 weeks, and between HFD and chow diet in (C) WT and (D) KO mice. (E) Volcano plot showing the differential expression analysis in gastrocnemius between WT and Abcc1 KO mice fed chow and (F) HFD during 9 weeks. Proteins differentially expressed are shown in fuchsia (upregulated) and green (downregulated). (G) Ingenuity pathway analysis (IPA) of differentially expressed proteins in gastrocnemius muscle of WT and Abcc1 KO mice fed with control (chow) diet or (H) HFD. The x-axis indicates −log10 of the P-value, and the y-axis indicates the corresponding canonical pathways. (I) Venn diagram showing proteins included in the IPA analysis in J, with differential expression (FC + 2) in KO compared with WT in response to the diets. (J) Comparative analysis of differential activation on pathways identified in KO versus WT mice under chow and HFD conditions. The x-axis indicates Z-score explaining the activation of the pathways in the y-axis. The omics analyses were performed in four animals per experimental group. (K) Western blot analysis (gastrocnemius) and (M–Q) densitometric quantification of (L) Glut4 and OXPHOS: complex I (M), complex II (N), complex III (O), complex IV (P), and complex V (Q). Data were normalised by the staining of total proteins (n = 3–4, animals per group). (*) Rout method (Q = 1%) was used to identify outliers. *P < 0.05, **P < 0.01. Data were evaluated by two-way ANOVA with Tukey’s multiple comparisons test and are expressed as mean ± s.e.m.

Similar articles

References

    1. Agudelo LZ, Ferreira DMS, Cervenka I, Bryzgalova G, Dadvar S, Jannig PR, Pettersson-Klein AT, Lakshmikanth T, Sustarsic EG, Porsmyr-Palmertz M, et al.2018Kynurenic acid and Gpr35 regulate adipose tissue energy homeostasis and inflammation. Cell Metabolism 27378–392.e5. (10.1016/j.cmet.2018.01.004) - DOI - PubMed
    1. Anderson AJ Andrew R Homer NZ Jones GC Smith K Livingstone DE Walker BR & Stimson RH. 2016Metformin increases cortisol regeneration by 11betaHSD1 in obese men with and without type 2 diabetes mellitus. Journal of Clinical Endocrinology and Metabolism 1013787–3793. (10.1210/jc.2016-2069) - DOI - PMC - PubMed
    1. Antonopoulos AS & Tousoulis D. 2017The molecular mechanisms of obesity paradox. Cardiovascular Research 1131074–1086. (10.1093/cvr/cvx106) - DOI - PubMed
    1. Bankier S Wang L Crawford A Morgan RA Ruusalepp A Andrew R Bjorkegren JLM Walker BR & Michoel T. 2023Plasma cortisol-linked gene networks in hepatic and adipose tissues implicate corticosteroid-binding globulin in modulating tissue glucocorticoid action and cardiovascular risk. Frontiers in Endocrinology 141186252. (10.3389/fendo.2023.1186252) - DOI - PMC - PubMed
    1. Bell RMB, Villalobos E, Nixon M, Miguelez-Crespo A, Murphy L, Fawkes A, Coutts A, Sharp MGF, Koerner MV, Allan E, et al.2021Carbonyl reductase 1 amplifies glucocorticoid action in adipose tissue and impairs glucose tolerance in lean mice. Molecular Metabolism 48101225. (10.1016/j.molmet.2021.101225) - DOI - PMC - PubMed

Publication types

Substances

LinkOut - more resources