. 2024 Jul 3;262(2):e230385.
doi: 10.1530/JOE-23-0385. Print 2024 Aug 1.

Differential regulation of STARD1, STARD4 and STARD6 in the human ovary

Affiliations

Differential regulation of STARD1, STARD4 and STARD6 in the human ovary

Nawal A Yahya et al. J Endocrinol. .

Abstract

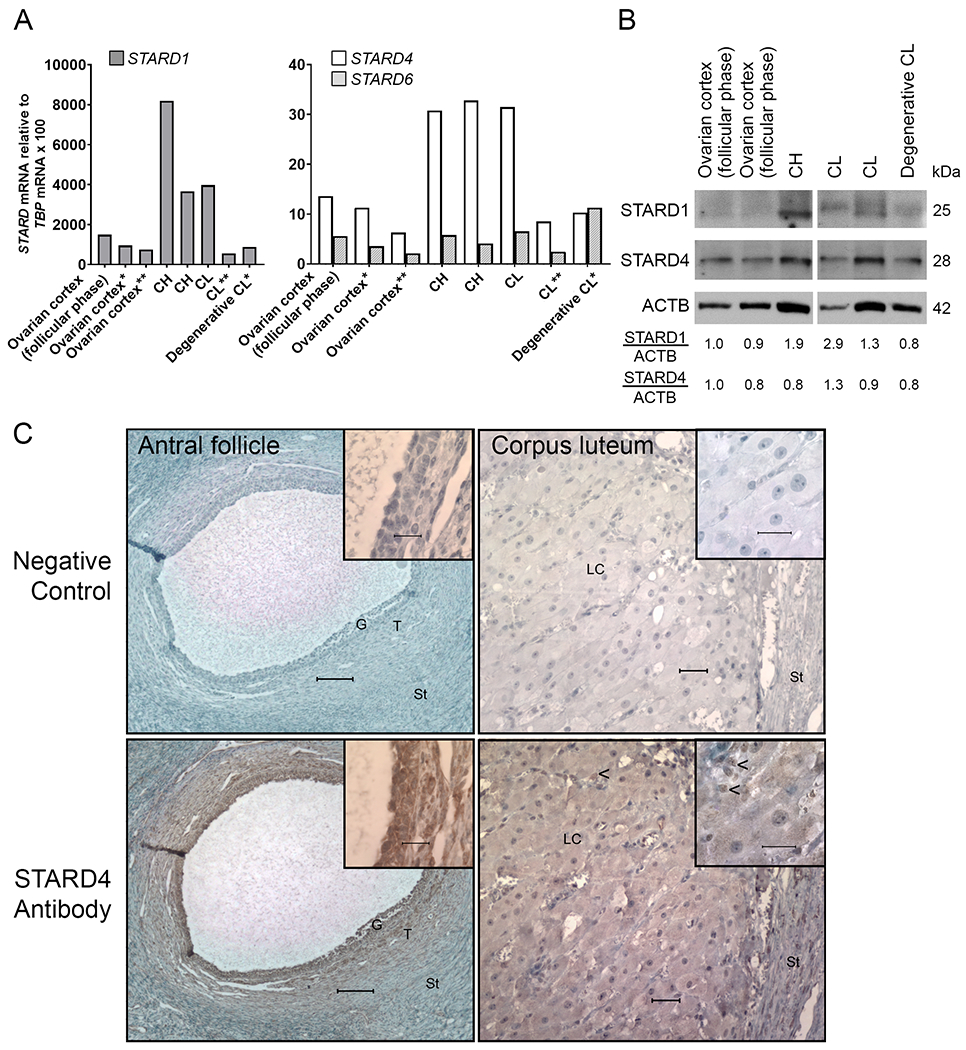
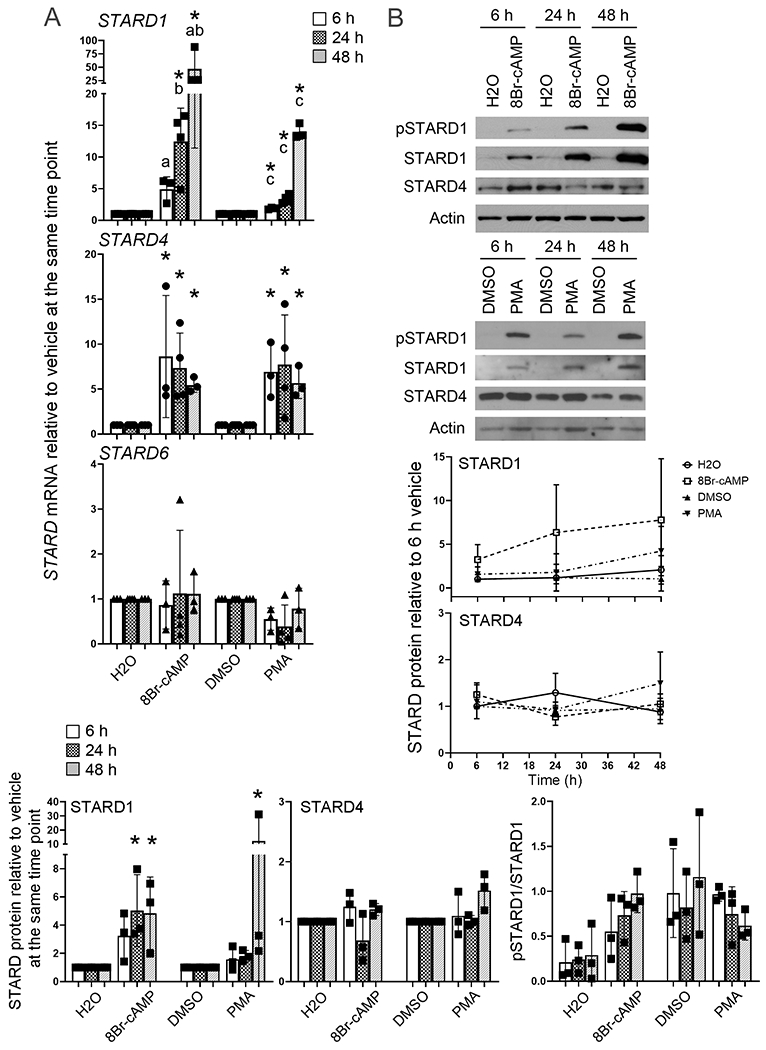
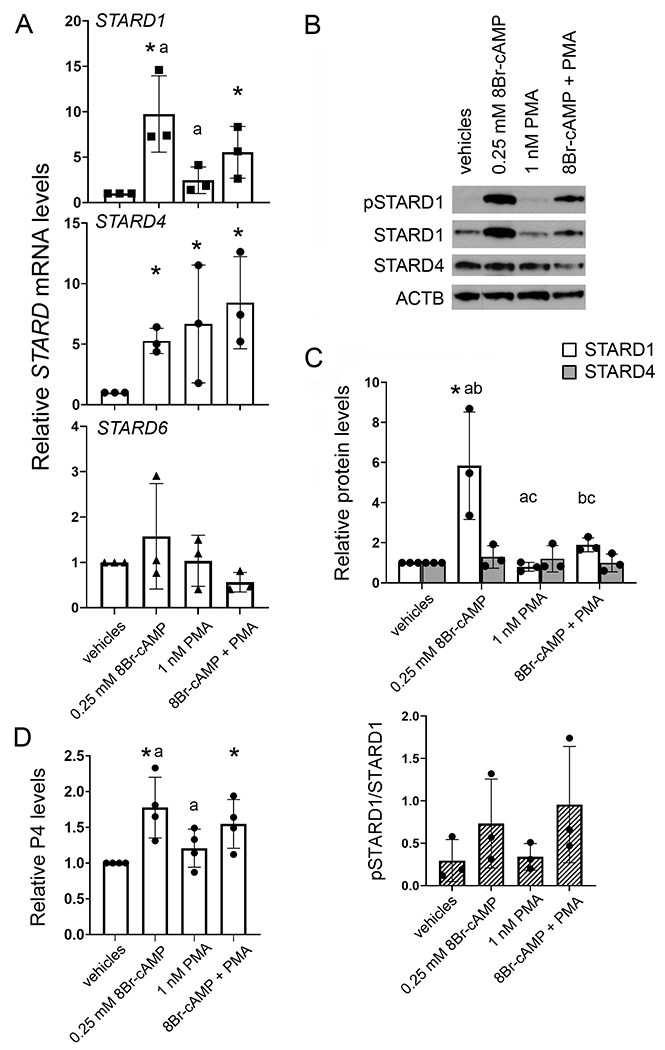
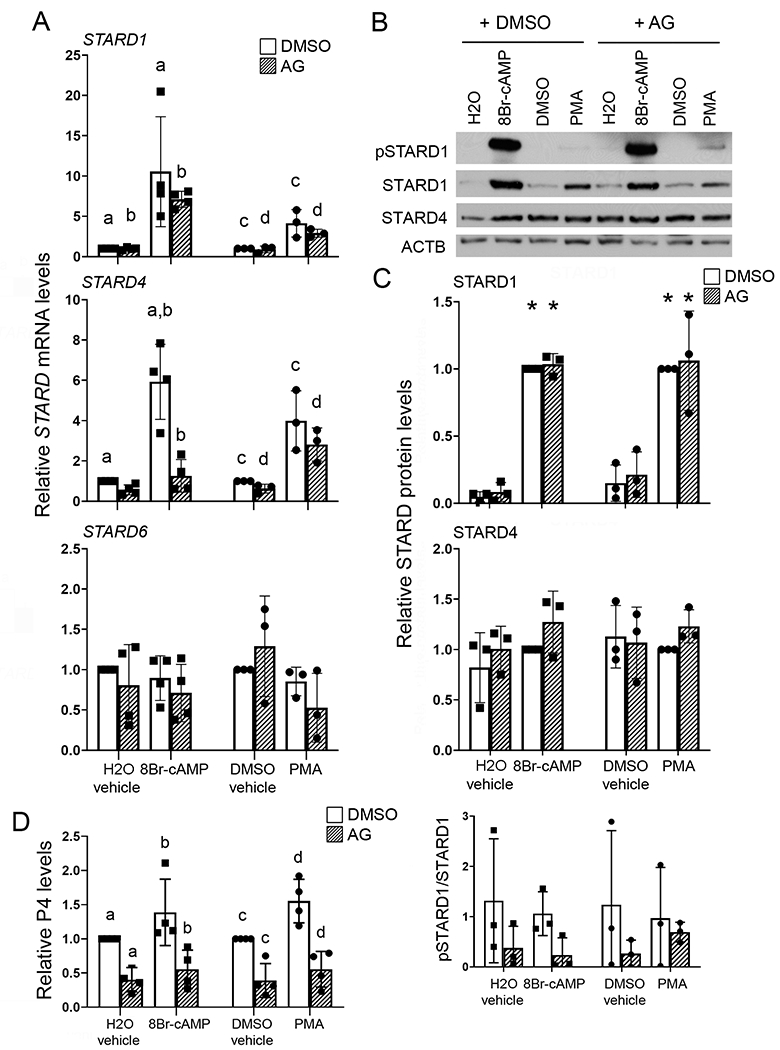
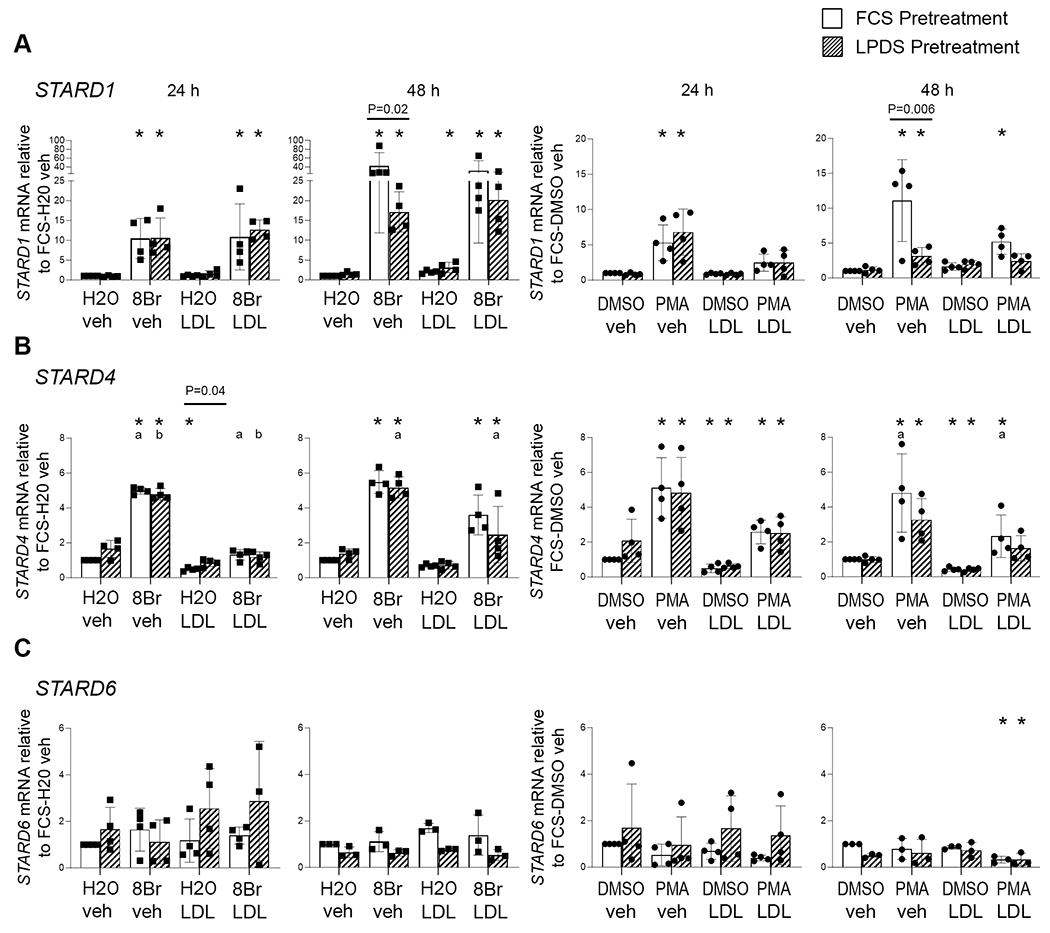
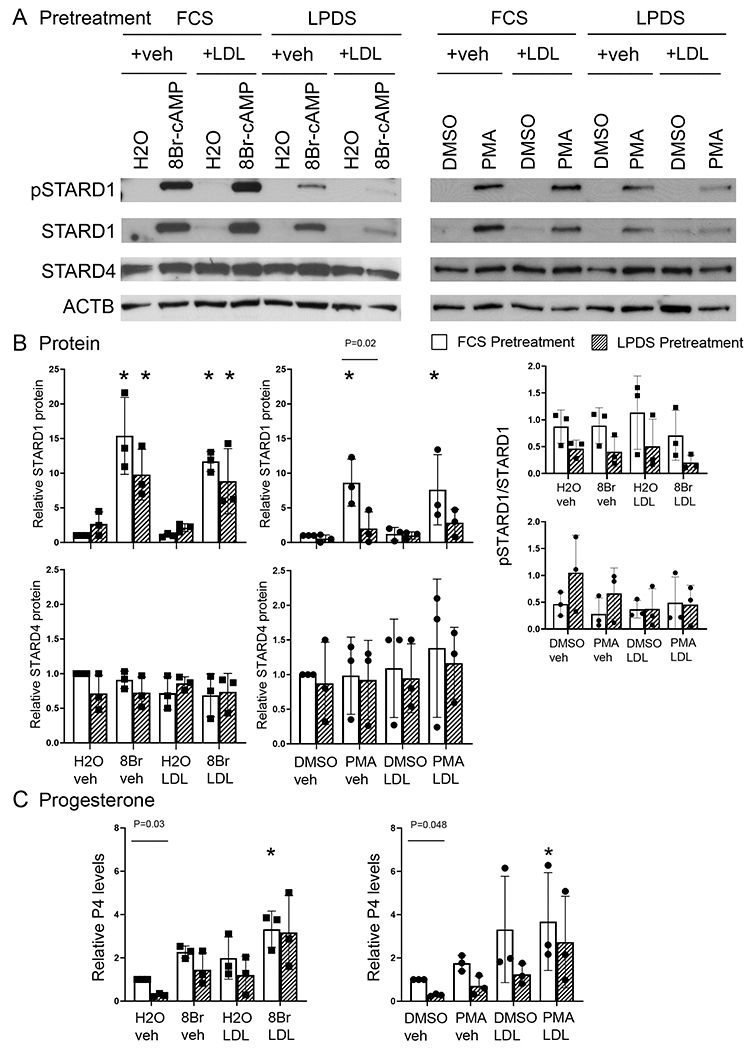
Cells actively engaged in de novo steroidogenesis rely on an expansive intracellular network to efficiently transport cholesterol. The final link in the transport chain is STARD1, which transfers cholesterol to the enzyme complex that initiates steroidogenesis. However, the regulation of ovarian STARD1 is not fully characterized, and even less is known about the upstream cytosolic cholesterol transporters STARD4 and STARD6. Here, we identified both STARD4 and STARD6 mRNAs in the human ovary but only detected STARD4 protein since the primary STARD6 transcript turned out to be a splice variant. Corpora lutea contained the highest levels of STARD4 and STARD1 mRNA and STARD1 protein, while STARD4 protein was uniformly distributed across ovarian tissues. Cyclic AMP analog (8Br-cAMP) and phorbol ester (PMA) individually increased STARD1 and STARD4 mRNA along with STARD1 protein and its phosphoform in cultured primary human luteinized granulosa cells (hGCs). STARD6 transcripts and STARD4 protein were unresponsive to these stimuli. Combining lower doses of PMA and 8Br-cAMP blunted the 8Br-cAMP stimulation of STARD1 protein. Increasing cholesterol levels by blocking its conversion to steroid with aminoglutethimide or by adding LDL reduced the STARD4 mRNA response to stimuli. Sterol depletion reduced the STARD1 mRNA and protein response to PMA. These data support a possible role for STARD4, but not STARD6, in supplying cholesterol for steroidogenesis in the ovary. We demonstrate for the first time how cAMP, PMA and sterol pathways separately and in combination differentially regulate STARD4, STARD6 and STARD1 mRNA levels, as well as STARD1 and STARD4 protein in human primary ovarian cells.

Keywords: START domain; cholesterol; human; luteinized granulosa; progesterone.


Conflict of interest statement

Declaration of interest

The authors have no conflicts of interest.

Figures

Figure 1
Figure 1
STARD in human ovarian tissues. (A) STARD1, STARD4 and STARD6 mRNA levels in different ovarian tissues were measured by quantitative PCR using the standard curve method and normalized for TBP mRNA. Each bar represents a single tissue sample. Tissues with the same number of asterisks (*, **) are from the same ovary. (B) STARD1 and STARD4 proteins and actin (ACTB, loading control) in human ovarian biopsies were evaluated by western blotting. Each row represents images from the same gel, membrane, film and exposure time. Membranes were stripped of antibodies prior to re-probing with a new antibody. Numbers under image are the densitometric quantification of each band normalized to that of actin and expressed relative to the first lane. (C) Immunohistochemical localization of STARD4 in human ovarian tissue sections. Tissues were probed in the absence (top) or presence (bottom) of anti-STARD4 antisera. STARD4-specific immunoreactive cells are indicated by brown staining. At left: small antral follicle from a follicular phase ovarian biopsy; scale bar=100 μm. At right: a corpus luteum; scale bar = 50 μm. Insets show higher magnifications of follicle wall or corpus luteum; scale bars = 25 μm. Arrowheads indicate nuclear staining. G, granulosa cell layer, T, theca cell layers, St, stroma, LC, luteal cells, CH, corpus hemorrhagicum, CL, corpus luteum.
Figure 2
Figure 2
The time-dependent effects of PKA and PKC activation on STARD mRNA, protein and phosphoprotein expression in hGCs. On the fourth day after culture in complete medium, cells were treated in serum-free medium with 1 mM 8Br-cAMP or its vehicle sterile water (H2O) or 20 nM PMA or its vehicle DMSO for 6, 24, and 48 h. (A) STARD1, STARD4 and STARD6 mRNA levels were quantified by real-time PCR, normalized to TBP mRNA and expressed relative to the respective vehicle control at the same time point. (B) Western blot of proteins from hGCs with or without stimulation. The top two images are examples of individual patient western blots (1 patient per blot). The middle two line graphs are STARD protein normalized for actin and then expressed relative to the respective 6 h vehicle. The lower row of graphs indicates the protein data normalized for actin and then expressed relative to its own vehicle at the same time point. The graph on the lower right is the optical density for pSTARD1 normalized to that of STARD1. For all bar graphs, bars = mean ± s.d.; n = 3 or 4 independent mRNA and 3 independent protein experiments. Squares, circles and triangles with bars mark individual data points. Line graphs show mean ± s.d.. Asterisk (*) indicates significant difference (P < 0.05) from the respective vehicle control at the same time point. Data marked by the same letter are significantly different from each other: a, P < 0.001; b, P < 0.05; c, P < 0.01. For line graphs, protein levels for each treatment were analyzed by time and showed no significant difference relative to the 6 h timepoint. pSTARD1/STARD1 did not show any statistical differences with treatment.
Figure 3
Figure 3
The effect of submaximal stimulation of PKA and PKC pathways on STARD mRNA and protein and progesterone levels in hGCs. On the fourth day after culture in complete medium, cells were treated in serum-free medium with vehicles (sterile water+DMSO) or 0.25 mM 8Br-cAMP, 1 nM PMA, or in combination for 24 h. (A) STARD mRNA levels determined by real-time PCR as described in Materials and methods and normalized to vehicles. (B) An example western blot showing the individual and combined effects of 8Br-cAMP and phorbol ester on pSTAR, STARD1 and STARD4 protein levels. (C) Upper graph shows densitometric quantification of protein from three western blots each with a different patient; optical densities were normalized to actin (ACTB) and expressed relative to the vehicles control. Lower graph shows the optical density for pSTARD1 normalized to that of STARD1 from the same experiments. (D) Progesterone (P4) levels in the media were measured and corrected for protein content per well and then normalized to the vehicles control. Bars and lines represent mean ± s.d.; squares, circles and triangles represent individual data points for n = 3 independent experiments for mRNA and protein data and n = 4 for progesterone. Asterisk (*) indicates significant difference (P < 0.05) from vehicles control. Bars with the same letter indicate that the treatments were significantly different (P < 0.05) from each other.
Figure 4
Figure 4
Selective effects of blocking 8Br-cAMP and PMA-stimulated cholesterol utilization for de novo steroidogenesis using aminoglutethimide (AG) on STARD mRNA, protein and progesterone levels in hGCs. On the fourth day after culture in complete medium, cells were treated in serum-free medium with vehicle (sterile water or DMSO), 1 mM 8Br-cAMP or 20 nM PMA with or without 100 μM aminoglutethimide for 24 h. (A) STARD mRNA levels determined by real-time PCR relative to respective vehicle control levels as described in Materials and methods. (B) Representative western blot of pSTAR, STARD1 and STARD4 protein levels. (C) Quantification of westerns. For the upper two graphs optical densities were normalized to actin (ACTB) and expressed relative to the 8Br-cAMP+DMSO or the PMA+DMSO groups. The lower graph represents the optical density of pSTARD1 relative to its respective STARD1. (D) P4 levels in the media of treated cells collected after 24 h verify that aminoglutethimide blocked steroid synthesis. Progesterone was corrected for protein and normalized to its respective double-vehicle control (H2O+DMSO or DMSO+DMSO). Bars and lines represent mean ± s.d.; square and circles mark individual data points for n = 3-4 individual experiments. Asterisk (*) indicates significant difference (P < 0.05) from respective H2O+DMSO vehicle or DMSO+DMSO vehicle control. Bars with the same letters are significantly different (P < 0.05) from each other.
Figure 5
Figure 5
The effect of preculture in FCS or lipoprotein-deficient FCS (LPDS) media on 1 mM 8Br-cAMP and 20 nM PMA stimulated STARD mRNA in hGCs with or without 50 μg/ml human low-density lipoprotein (LDL). After 4 days of preculture, cells were switched to serum-free medium and incubated for 24 or 48 h with stimulus or their respective vehicle (sterile water or DMSO) and LDL or its vehicle. Expression of (A) STARD1, (B) STARD4, and (C) STARD6 mRNA levels relative to their respective FCS double-vehicle controls quantified by real-time PCR as described in Materials and methods. Bars and lines are mean ± s,d.; squares and circles are individual data points from n = 3-4 independent experiments. Asterisk (*) indicates significant difference (P < 0.05) from the FCS double-vehicle control. Bars with the same letters reflect significant difference (P < 0.05) between groups. Horizontal lines above bars indicate significant difference between groups at the P-value shown.
Figure 6
Figure 6
The effect of preculture with FCS or LPDS on 1 mM 8Br-cAMP and 20 nM PMA stimulated STARD protein and progesterone levels with or without 50 μg/ml LDL in hGCs. (A) Representative westerns blots showing levels of pSTARD1, STARD1, STARD4, and actin (ACTB) after 48 h treatment. Left panel, treatment with water vehicle (H2O) and 8Br-cAMP with LDL (LDL) or LDL vehicle (veh). Right panel, treatment with DMSO vehicle and PMA with LDL or LDL vehicle. (B) Quantification of westerns from 3 independent experiments. Optical densities were normalized to actin and expressed relative to the respective FCS vehicle control. Graphs on the right side represent the optical density of pSTARD1 relative to its respective STARD1. (C) P4 levels in media of treated cells collected at 48 h, corrected for protein and normalized to the respective FCS vehicle control; n = 3. Bars and lines are mean ± s.d.; squares and circles mark individual data points. Asterisk (*) indicates significant difference (P < 0.05) from the appropriate FCS vehicle control for each treatment group. Horizontal lines above bars indicate a significant difference between groups at the P-value shown.

Similar articles

Cited by

References

    1. Arakane F, King SR, Du Y, Kallen CB, Walsh LP, Watari H, Stocco DM & Strauss JF III 1997. Phosphorylation of steroidogenic acute regulatory protein (StAR) modulates its steroidogenic activity. Journal of Biological Chemistry 272 32656–32662. - PubMed
    1. Bogan RL & Niswender GD 2007. Constitutive steroidogenesis in ovine large luteal cells may be mediated by tonically active protein kinase A. Biology of Reproduction 77 209–216. - PubMed
    1. Bose HS, Whittal RM, Ran Y, Bose M, Baker BY & Miller WL 2008. StAR-like activity and molten globule behavior of StARD6, a male germ-line protein. Biochemistry 47 2277–2288. - PubMed
    1. Calderon-Dominguez M, Gil G, Medina MA, Pandak WM & Rodriguez-Agudo D 2014. The StarD4 subfamily of steroidogenic acute regulatory-related lipid transfer (START) domain proteins: new players in cholesterol metabolism. International Journal of Biochemistry and Cell Biology 49 64–68. - PMC - PubMed
    1. Chin EC, Harris TE & Abayasekara DR 2004. Changes in cAMP-dependent protein kinase (PKA) and progesterone secretion in luteinizing human granulosa cells. Journal of Endocrinology 183 39–50. - PubMed

Publication types

LinkOut - more resources