

From Bulk to Single Molecules: Surface-Enhanced Raman Scattering of Cytochrome C Using Plasmonic DNA Origami Nanoantennas
- PMID: 38829305
- PMCID: PMC11177308
- DOI: 10.1021/acs.nanolett.4c00834
From Bulk to Single Molecules: Surface-Enhanced Raman Scattering of Cytochrome C Using Plasmonic DNA Origami Nanoantennas
Abstract
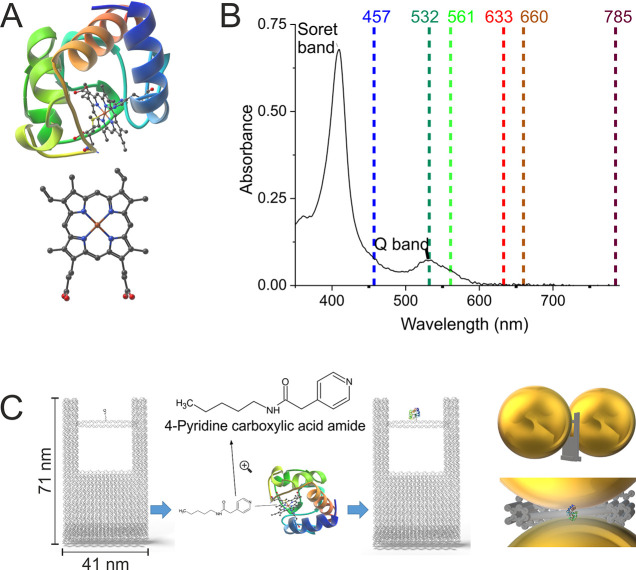
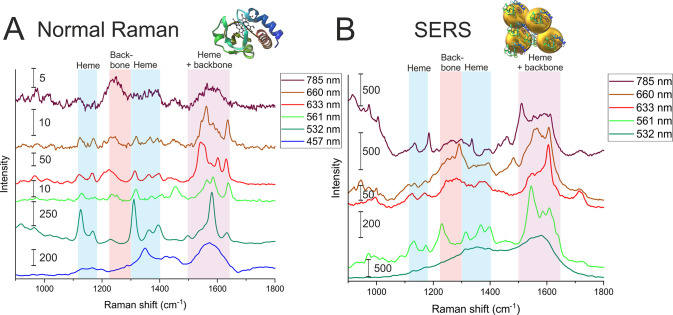
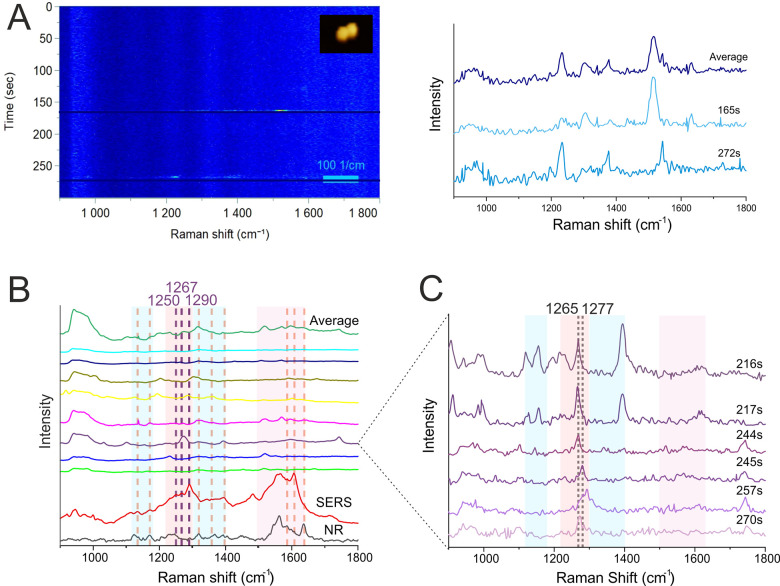
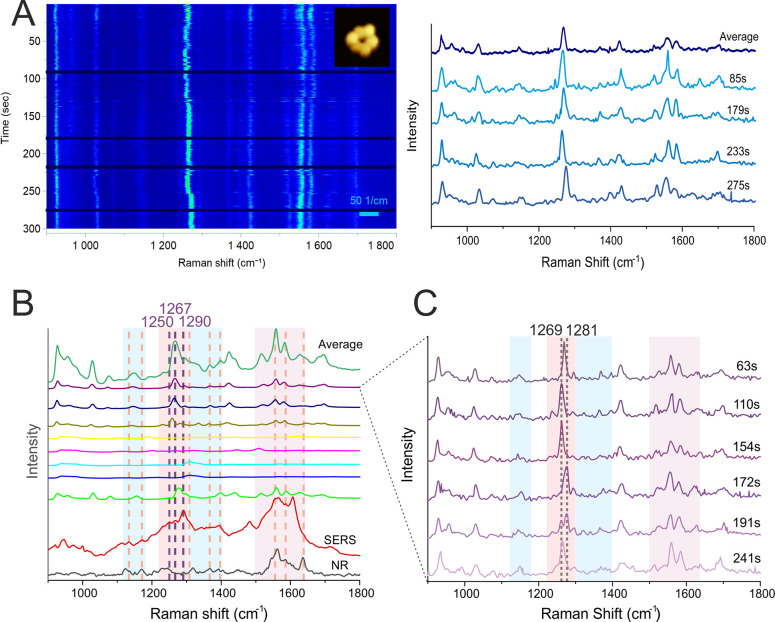
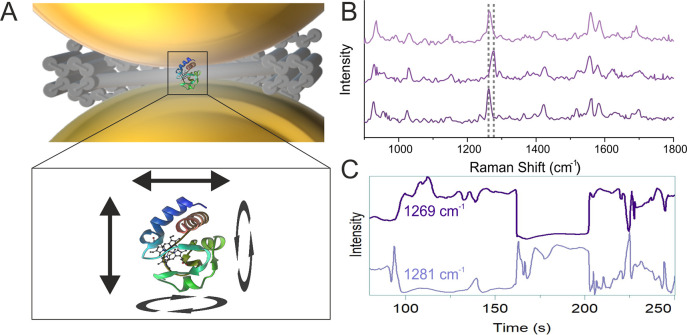
Cytochrome C, an evolutionarily conserved protein, plays pivotal roles in cellular respiration and apoptosis. Understanding its molecular intricacies is essential for both academic inquiry and potential biomedical applications. This study introduces an advanced single-molecule surface-enhanced Raman scattering (SM-SERS) system based on DNA origami nanoantennas (DONAs), optimized to provide unparalleled insights into protein structure and interactions. Our system effectively detects shifts in the Amide III band, thereby elucidating protein dynamics and conformational changes. Additionally, the system permits concurrent observations of oxidation processes and Amide bands, offering an integrated view of protein structural and chemical modifications. Notably, our approach diverges from traditional SM-SERS techniques by de-emphasizing resonance conditions for SERS excitation, aiming to mitigate challenges like peak oversaturation. Our findings underscore the capability of our DONAs to illuminate single-molecule behaviors, even within aggregate systems, providing clarity on molecular interactions and behaviors.
Keywords: Amide III; Cytochrome C; DNA origami; SERS; Single molecules.
Conflict of interest statement
The authors declare no competing financial interest.
Figures
Similar articles
-
Enhanced characterization of protein secondary structure transitions using Raman and SERS measurements combined with 2D correlation spectroscopy and principal component analysis.Spectrochim Acta A Mol Biomol Spectrosc. 2025 Dec 15;343:126607. doi: 10.1016/j.saa.2025.126607. Epub 2025 Jun 24. Spectrochim Acta A Mol Biomol Spectrosc. 2025. PMID: 40614472
-
The Effect of Nanoparticle Composition on the Surface-Enhanced Raman Scattering Performance of Plasmonic DNA Origami Nanoantennas.ACS Nano. 2023 Nov 14;17(21):21227-21239. doi: 10.1021/acsnano.3c05464. Epub 2023 Oct 17. ACS Nano. 2023. PMID: 37847540
-
Recent advances in the design of SERS substrates and sensing systems for (bio)sensing applications: Systems from single cell to single molecule detection.F1000Res. 2025 Jun 24;13:670. doi: 10.12688/f1000research.149263.3. eCollection 2024. F1000Res. 2025. PMID: 40255478 Free PMC article. Review.
-
Single-Molecule Surface-Enhanced Raman Scattering Measurements Enabled by Plasmonic DNA Origami Nanoantennas.J Vis Exp. 2023 Jul 21;(197). doi: 10.3791/65310. J Vis Exp. 2023. PMID: 37677030
-
Single-Molecule Detection of Optical Signals Using DNA-Based Plasmonic Nanostructures.Biosensors (Basel). 2025 Jun 20;15(7):398. doi: 10.3390/bios15070398. Biosensors (Basel). 2025. PMID: 40710048 Free PMC article. Review.
Cited by
-
Watching a Single Enzyme at Work Using Single-Molecule Surface-Enhanced Raman Scattering and DNA Origami-Based Plasmonic Antennas.ACS Nano. 2024 Jul 29;18(31):20191-200. doi: 10.1021/acsnano.4c03384. Online ahead of print. ACS Nano. 2024. PMID: 39074854 Free PMC article.
References
-
- Nicholls D. G.; Ferguson S. Bioenergetics: Fourth Edition. Bioenerg. Fourth Ed. 2013, 1–419. 10.1016/B978-0-12-388425-1.00027-0. - DOI
-
- Nicholls P. Cytochrome cA Multidisciplinary Approach Edited by R. A. Scott (University of Georgia) and A. G. Mauk (University of British Columbia). University Science Books: Sausalito, CA. 1996. vi + 738 Pp. $85.00. ISBN 0–935702–33–4. J. Am. Chem. Soc. 1996, 118 (39), 9459–9460. 10.1021/ja9655911. - DOI
-
- Yeo B. S.; Mädler S.; Schmid T.; Zhang W.; Zenobi R. Tip-Enhanced Raman Spectroscopy Can See More: The Case of Cytochrome C. J. Phys. Chem. C 2008, 112, 4867.10.1021/jp709799m. - DOI
Publication types
MeSH terms
Substances
LinkOut - more resources
Full Text Sources
Miscellaneous
