. 2024 Jul 1;221(7):e20232067.
doi: 10.1084/jem.20232067. Epub 2024 Jun 3.

Intestinal cDC1s provide cues required for CD4+ T cell-mediated resistance to Cryptosporidium

Affiliations

Intestinal cDC1s provide cues required for CD4+ T cell-mediated resistance to Cryptosporidium

Ian S Cohn et al. J Exp Med. .

Abstract

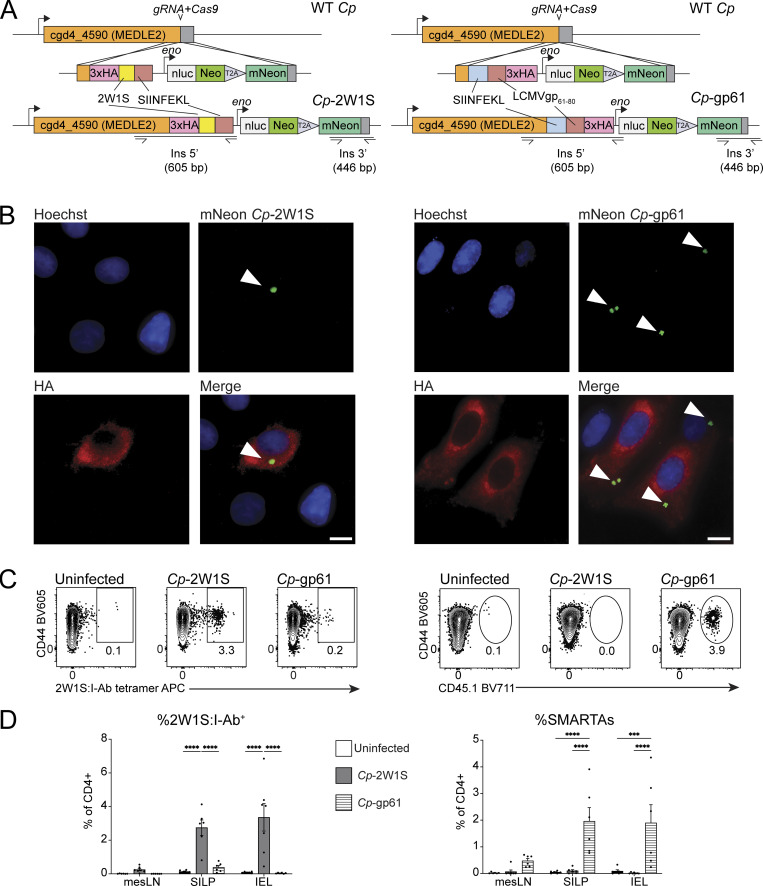
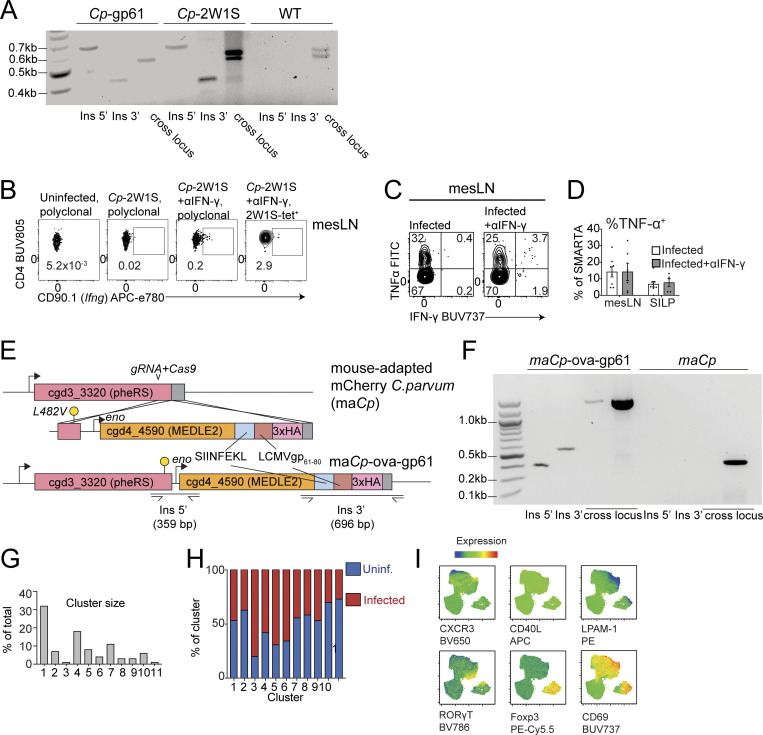
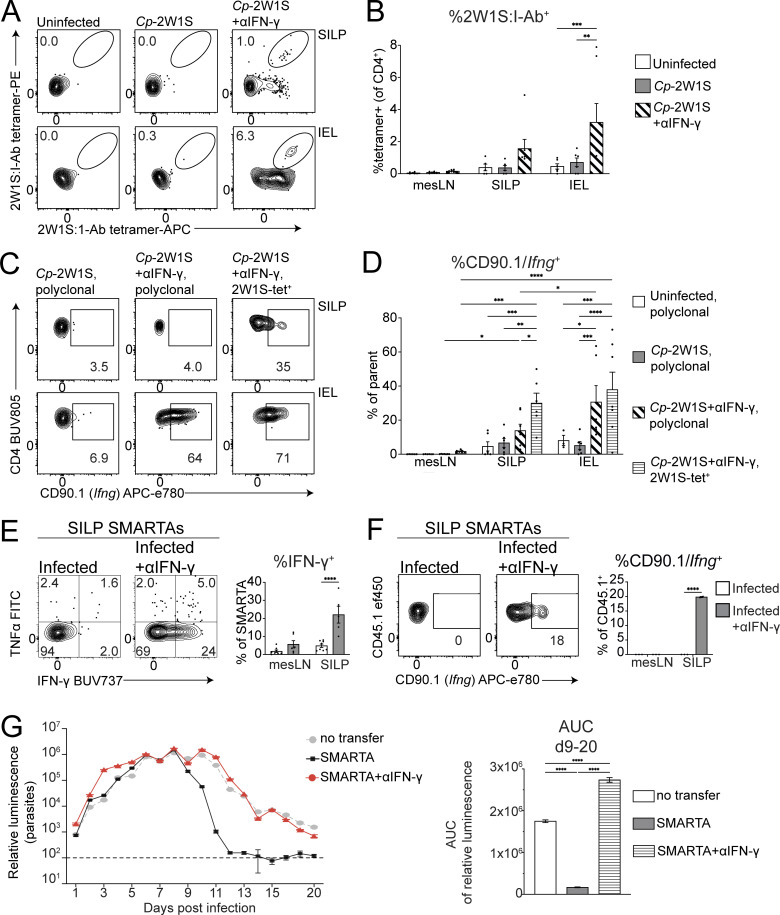
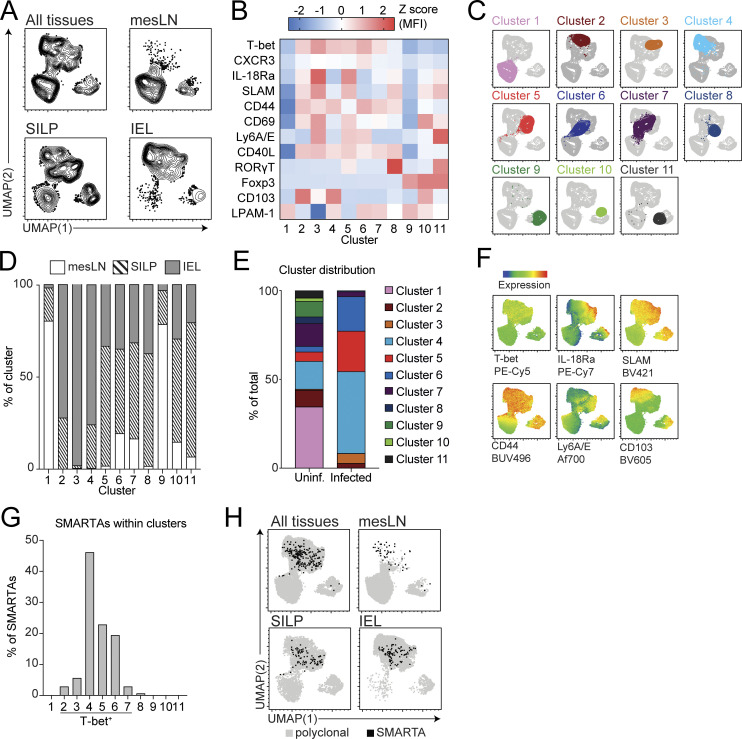
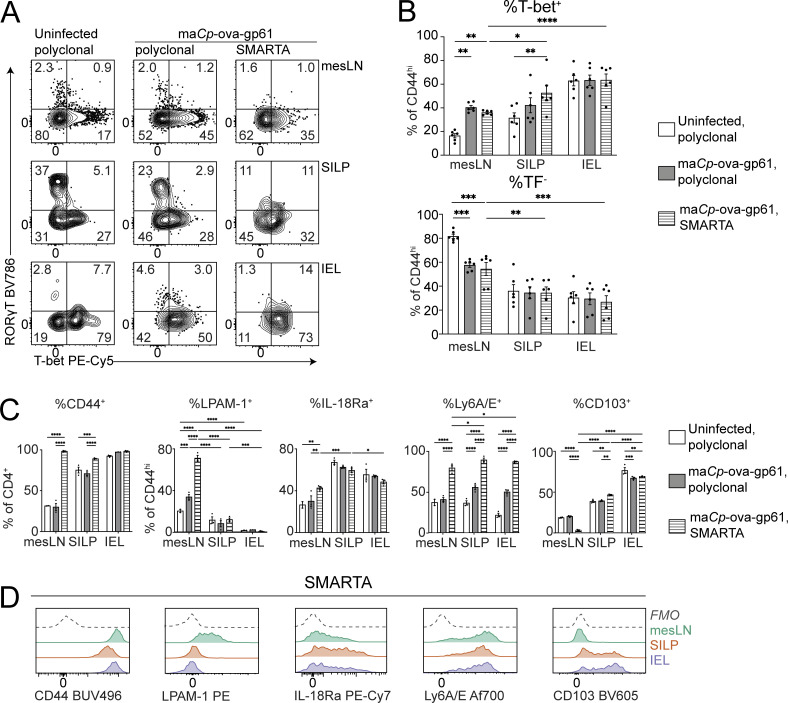
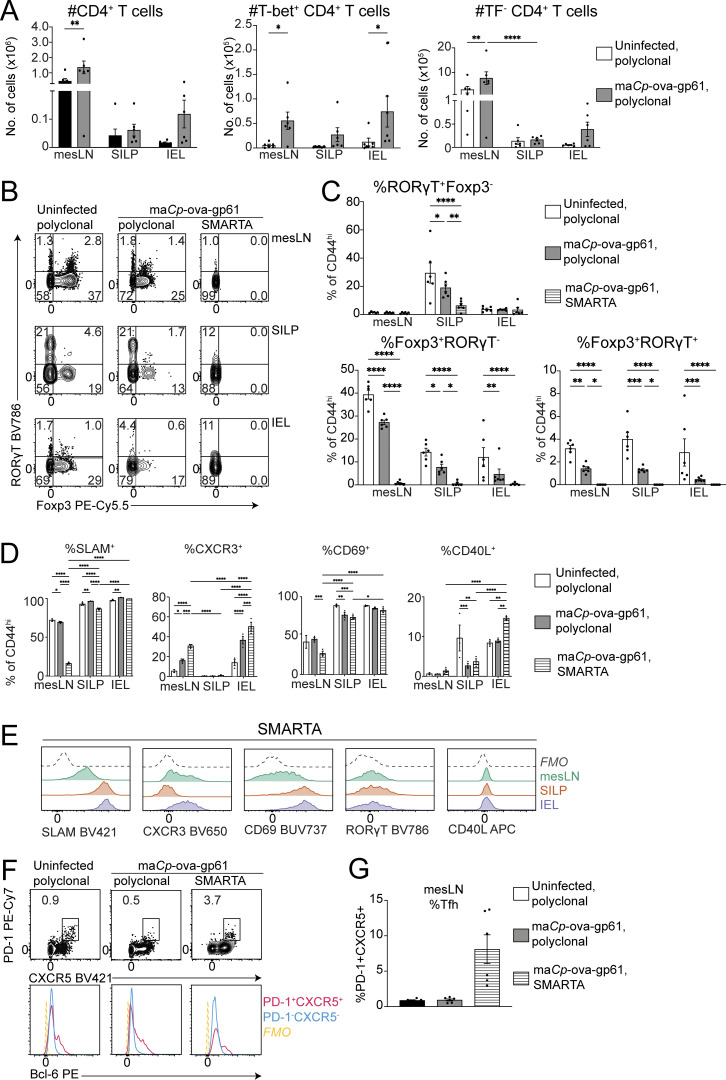
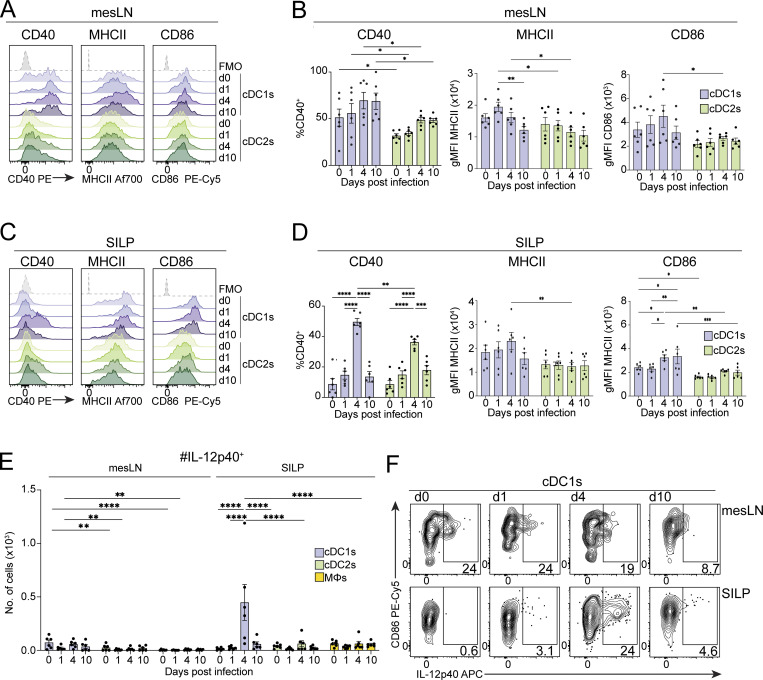
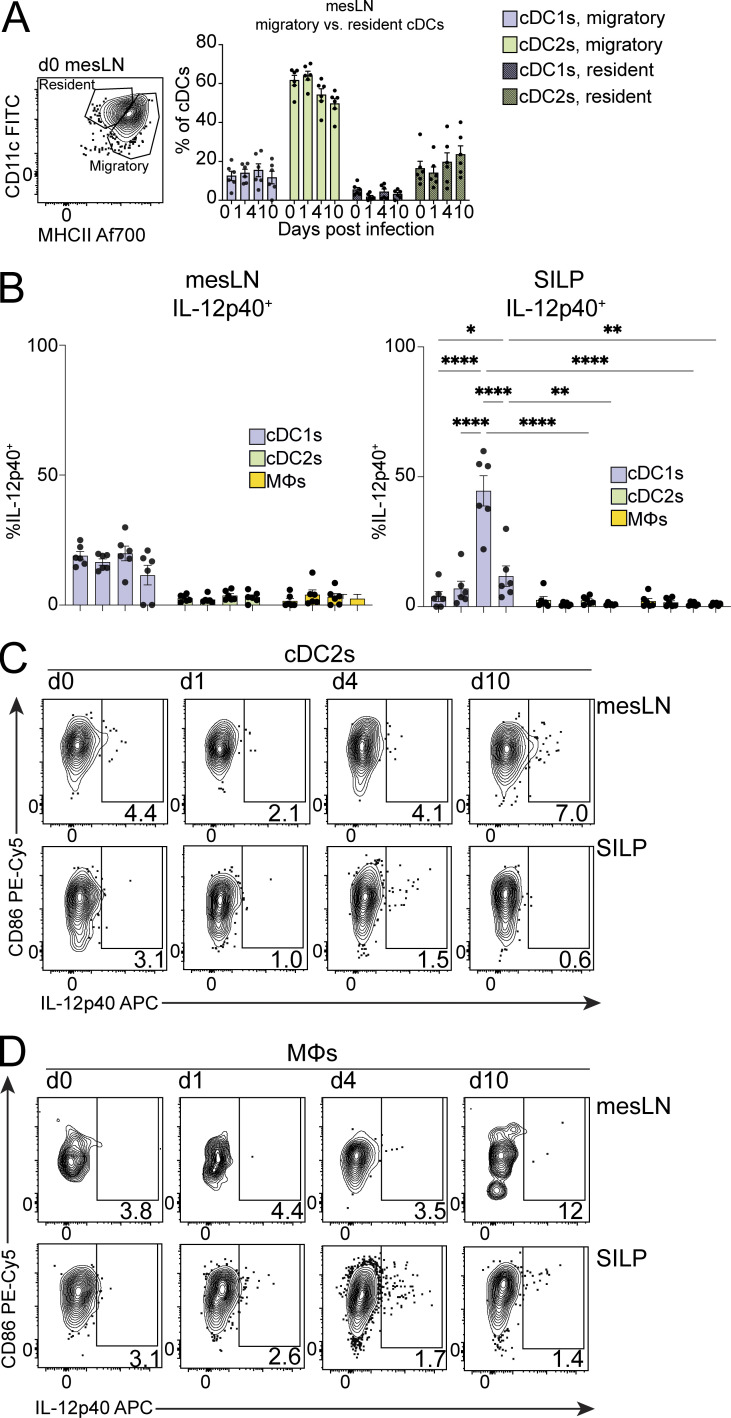
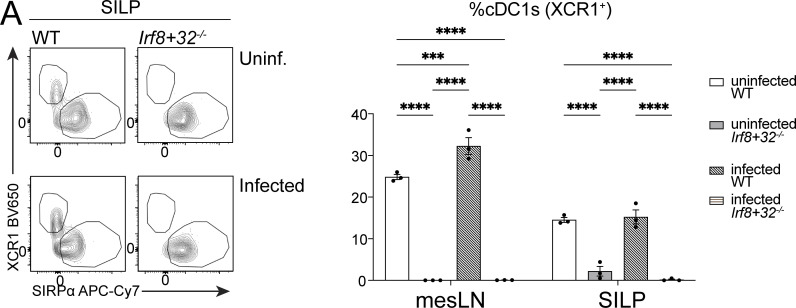
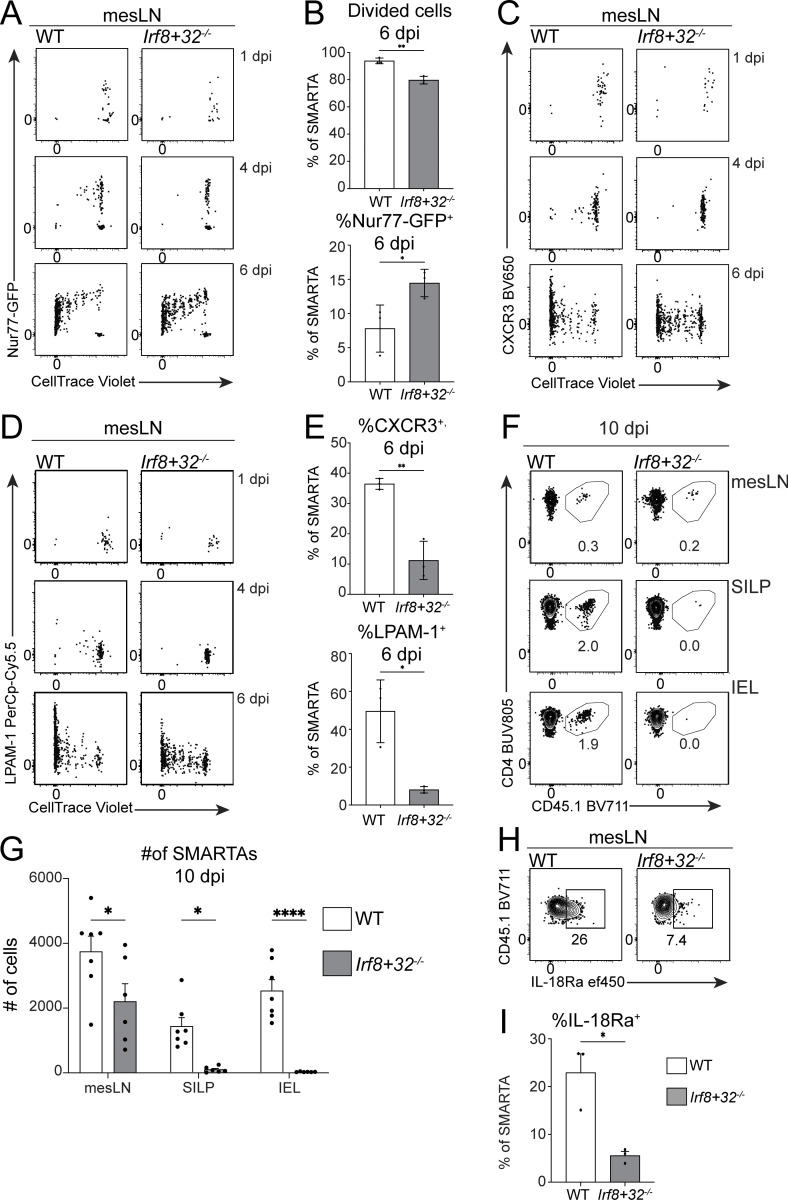
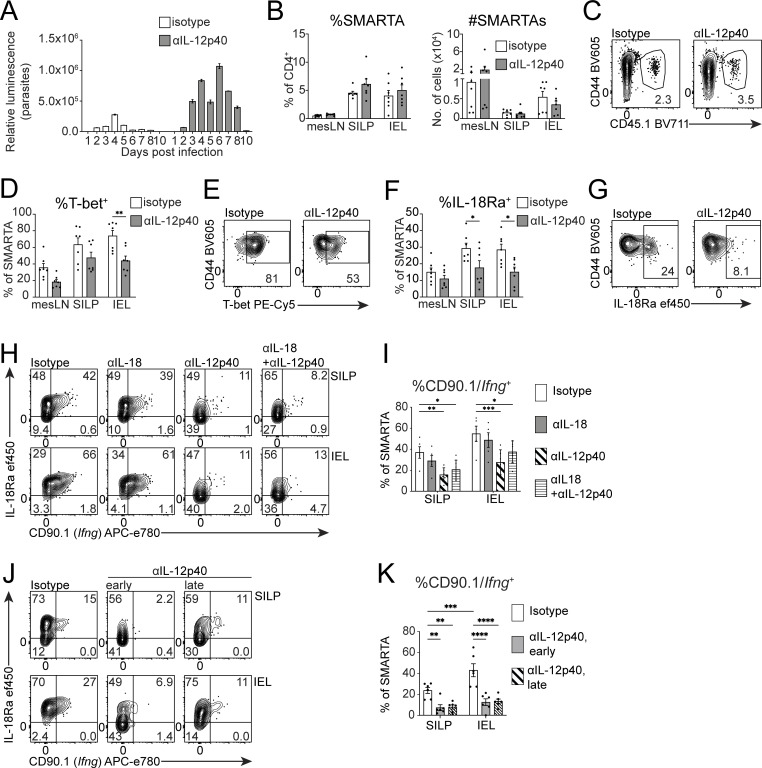
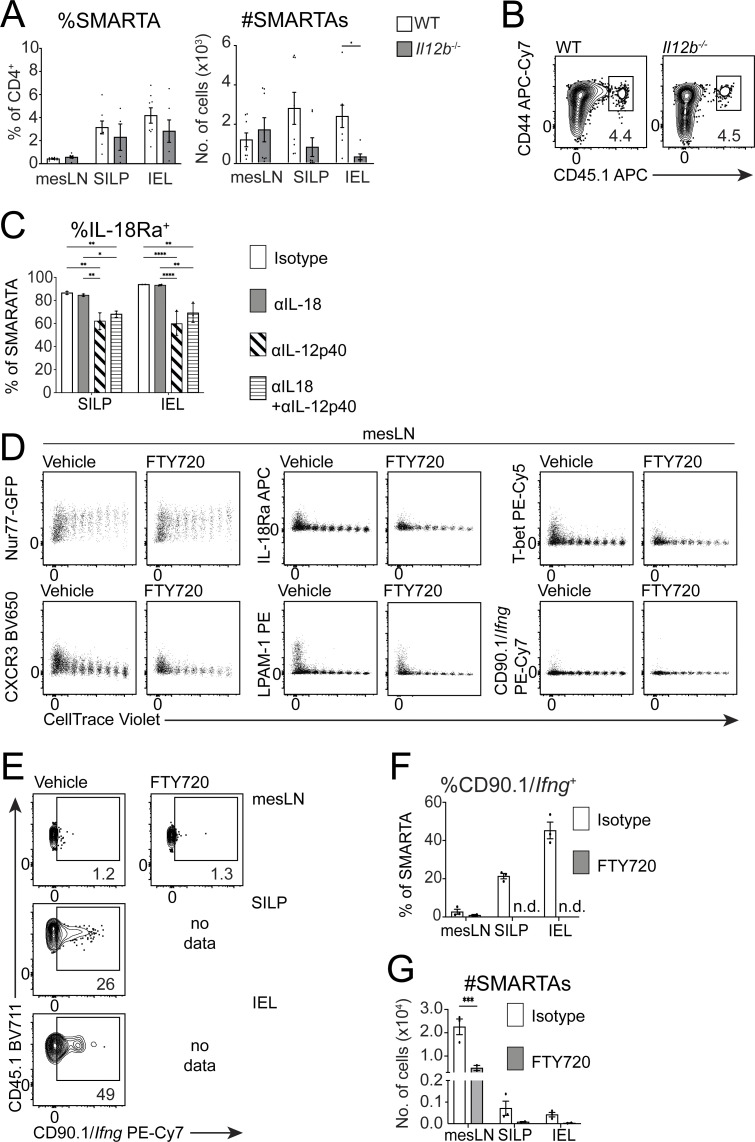
Cryptosporidium is an enteric pathogen and a prominent cause of diarrheal disease worldwide. Control of Cryptosporidium requires CD4+ T cells, but how protective CD4+ T cell responses are generated is poorly understood. Here, Cryptosporidium parasites that express MHCII-restricted model antigens were generated to understand the basis for CD4+ T cell priming and effector function. These studies revealed that parasite-specific CD4+ T cells are primed in the draining mesenteric lymph node but differentiate into Th1 cells in the gut to provide local parasite control. Although type 1 conventional dendritic cells (cDC1s) were dispensable for CD4+ T cell priming, they were required for CD4+ T cell gut homing and were a source of IL-12 at the site of infection that promoted local production of IFN-γ. Thus, cDC1s have distinct roles in shaping CD4+ T cell responses to an enteric infection: first, to promote gut homing from the mesLN, and second, to drive effector responses in the intestine.


Conflict of interest statement

Disclosures: J.A. Gullicksrud is currently affiliated with Cell Press, but all experiments performed by her for these studies were done before she worked there. Therefore, the authors declare no competing interests.

Figures

Figure 1.
Figure 1.
Engineering Cryptosporidium to express MHCII-restricted model antigens allows for identification of parasite-specific CD4+ T cells. (A) Genetic construct of transgenic Cp-2W1S (right) or Cp-gp61 (left) engineered to tag the C-terminus of MEDLE2 with 3xHA-2W1S-SIINFEKL or SIINFEKL-gp61-3xHA tags. The construct also included the neomycin (Neo) selection marker and the nluc reporter to monitor parasite burden, as well as cytoplasmic mNeon. (B) HCT-8 cells were infected for 24 h with 300,000 oocysts of mNeon green Cp-2W1S (left) or Cp-gp61 (right) and then stained for nuclear dye (Hoechst, blue) and HA (red). A white arrowhead points to the parasite within the cell. Scale bar: 10 μm. Representative of n = 2 independent experiments, n = 2 wells of HCT8s/group. (C) 1 day prior to infection, Ifng−/− mice received 2 × 10⁴ CD45.1+ SMARTA T cells and were left uninfected or infected with either 1 × 10⁴ Cp-2W1S or Cp-gp61 oocysts and ileal draining mesLN, SILP, or IEL were harvested at 10 dpi for flow cytometry. Representative flow plots show 2W1S:I-Ab+ or CD45.1+ SMARTA T cells in the SILP. Gated on Singlets, Live, CD19, NK1.1, CD90.2+, CD8a CD4+, CD44hi, 2W1S:I-Ab+, or CD45.1+. (D) Summary bar graphs from mesLN, SILP, and IEL of mice in C showing means with SEM of n = 3 mice/group from two independent experiments representative of four independent experiments. SMARTA T cells were CD45.1+CD44hi and 2W1S-tetramer+ were 2W1S:I-Ab+CD44hi. Statistical significance was determined in D by two-way ANOVA and multiple comparisons. ***P ≤ 0.001, ****P ≤ 0.0001.
Figure S1.
Figure S1.
Engineering Cryptosporidium to express MHCII-restricted model antigens allows for tracking of parasite-specific CD4+ T cells in WT and Ifng/ mice. (A) Integration PCR gel. PCR mapping using genomic DNA from WT and transgenic parasites (Cp-gp61 and Cp-2W1S) showing diagnostic amplicons of the insertion locus. Primer binding sites and expected amplicon sizes are indicated in Fig. 1 A on the genetic maps. Because there are multiple copies of MEDLE2 in the C. parvum genome, loss of the WT cross-locus band in transgenic parasites is not necessarily expected. (B) Representative flow plots showing CD90.1 expression in polyclonal CD4+ T cells (first two columns) or 2W1S:I-Ab tetramer+ cells (last column) in the mesLN of uninfected CD90.1/Ifng reporter mice (first column), infected reporter mice untreated (second column), or infected reporter mice treated with αIFN-γ (last two columns). Gating: Singlets, Live+, CD19, NK1.1, EpCAM, CD90.2+, CD8a, CD4+, 2W1S:I-Ab+. Flow plots are from one experiment representative of n = 2 independent experiments, n = 3 mice/group. Related to Fig. 2, A–D. (C and D) WT B6 mice received 2 × 10⁴ CD45.1+ SMARTA T cells 1 day prior to infection with 5 × 10⁴ maCp-ova-gp61 and were left untreated or treated with 1 mg/mouse of αIFN-γ 1 day prior to infection and 2, 5, and 8 dpi. At 10 dpi, mesLN and SILP were harvested for flow cytometry and cells were stimulated with exogenous gp61 peptide for 3 h followed by intracellular cytokine staining and flow cytometry. (C) Representative flow plots from the mesLN. (D) Summary showing the percentage of SMARTA cells from the SILP or mesLN staining TNFα+ after peptide stimulation. Gating: Singlets, Live+, CD19, NK1.1, EpCAM, CD90.2+, CD8a, CD4+, CD45.1+. Bar graphs show means and SEM from two pooled independent experiments, n = 3–4 mice/group. Statistical significance was determined by two-way ANOVA and multiple comparisons. (E) The genetic construct of transgenic maCp-ova-gp61 engineered to alter the pheRS gene L at position 482 to V to confer resistance to BRD7929. This construct included the full MEDLE2 gene tagged with SIINFEKL-gp61-3xHA. (F) Integration PCR gel. PCR mapping using genomic DNA from maCp and transgenic parasites (maCp-ova-gp61) showing diagnostic amplicons of the insertion locus. Primer binding sites and expected amplicon sizes are indicated in E on the genetic maps. (G) Percentage of total CD4+ T cells represented by each cluster from UMAP experiments described in Fig. 3. (H) Percentage of each cluster represented by CD4+ T cells from uninfected (blue) or infected (red) samples. (I) UMAP from Fig. 3 A colored by expression levels of each marker listed beneath each panel. For G–I, plots are from one independent experiment, n = 3 mice/group. Source data are available for this figure: SourceData FS1.
Figure 2.
Figure 2.
Cryptosporidium-specific CD4+ T cells produce IFN-γ locally to protect against infection. (A–D) IFN-γ-CD90.1 reporter mice were left untreated or treated with 1 mg/mouse of αIFN-γ 1 day prior to infection and 2, 5, and 8 dpi with 104 Cp-2W1S. mesLN, SILP, and IEL were harvested at 10 dpi for flow cytometry. (A) Representative flow plots from the SILP and IEL of CD4+ T cells stained with 2W1S:I-Ab tetramer in PE and APC showing detection of tetramer+ cells when mice are infected and treated with αIFN-γ. Gating: Singlets, Live+, CD19, NK1.1, EpCAM, CD90.2+, CD8a, CD4+. (B) Quantification/summary of A and tetramer (PE and APC double positive) staining from mesLN, SILP, and IEL. (C) Representative flow plots showing CD90.1 expression in polyclonal CD4+ T cells (first two columns) or 2W1S:I-Ab tetramer+ cells (last column) in SILP and IEL of infected mice untreated (first column) or treated with αIFN-γ (last two columns). Gating: Singlets, Live+, CD19, NK1.1, EpCAM, CD90.2+, CD8a, CD4+, 2W1S:I-Ab+. (D) Quantification/summary of C showing the percent of cells that were CD90.1+ from the following groups: polyclonal CD4+ T cells from uninfected mice (white), polyclonal CD4+ T cells from untreated mice infected with Cp-2W1S (gray), polyclonal CD4+ T cells from αIFN-γ–treated mice infected with Cp-2W1S (white with diagonal stripes), or 2W1S:I-Ab tetramer+ CD4+ T cells from αIFN-γ–treated mice infected with Cp-2W1S (white with horizontal stripes). Graphs in A–D are from n = 2 independent experiments, n = 3–4 mice/group, with data plotted as means with SEM. Statistical significance was determined by two-way ANOVA and multiple comparisons. *P ≤ 0.05, **P ≤ 0.01, ***P ≤ 0.001, ****P ≤ 0.0001. (E and F) WT B6 mice received 2 × 10⁴ CD90.1/Ifng reporter SMARTA T cells 1 day prior to infection with 5 × 10⁴ maCp-ova-gp61 and were left untreated or treated with 1 mg/mouse of αIFN-γ 1 day prior to infection and 2, 5, and 8 dpi. At 10 dpi, mesLN and SILP were harvested and cells were stimulated with exogenous gp61 peptide for 3 h followed by intracellular cytokine staining and flow cytometry. (E) Left: Representative flow plots and from the SILP showing IFN-γ and TNF-α expression in SMARTA T cells after peptide stimulation. Gating: Singlets, Live+, CD19, NK1.1, EpCAM, CD90.2+, CD8a, CD4+, CD45.1+. Right: Summary showing the percentage of SMARTA cells from the SILP or mesLN staining IFN-γ+ after peptide stimulation. (F) Left: Representative flow plots from the SILP showing expression of CD90.1 as a reporter of Ifng expression on SMARTA T cells after peptide stimulation. Gating: Singlets, Live+, CD19, NK1.1, EpCAM, CD90.2+, CD8a-, CD4+, CD45.1+. Right: Summary showing the percentage of SMARTA T cells from the SILP or mesLN staining for CD90.1+ after peptide stimulation. Bar graphs in E and F are from n = 2 independent experiments, n = 3–4 mice/group, with data plotted as means with SEM. Statistical significance was determined by two-way ANOVA and multiple comparisons. ****P ≤ 0.0001. (G) PBS or 106 SMARTA T cells were transferred into Ifng−/− mice 1 day prior to infection with 104 Cp-gp61 and feces was analyzed by nluc for parasite burden (relative luminescence) over time. For some mice receiving SMARTA T cells, mice also received 1 mg/mouse of αIFN-γ blocking antibody 1 day prior to infection and 2, 5, and 8 dpi. Area under the curve analysis was performed for each treatment for 9–20 dpi. Graphs in G shown are from one experiment, representative of two independent experiments, n = 3 mice/group, with data plotted as means with SEM. Statistical significance was determined by two-way ANOVA and multiple comparisons. ****P ≤ 0.0001.
Figure 3.
Figure 3.
Cryptosporidium-specific CD4+ T cells resemble polyclonal T-bet+ cells in the gut. (A–H) WT B6 mice received 2 × 10⁴ SMARTA T cells 1 day prior to infection with 5 × 10⁴ maCp-ova-gp61 oocysts, and mesLN, SILP, and IEL were harvested at 10 dpi for flow cytometry. (A) UMAP of mesLN, SILP, and IEL CD4+ T cells (Singlets, Live+, CD8aEpCAMNK1.1CD19CD4+TCRβ+) based on surface expression of the following markers: IL-18Ra, SLAM, CXCR3, T-bet, RORγT, Foxp3, CD40L, CD44, CD69, CD103, Ly6A/E, and LPAM-1. (B) X-Shift cluster analysis of concatenated CD4+ T cells from all tissues revealed 11 clusters. Heatmap of the Z-scores of surface marker geometric mean fluorescence intensity (MFI) by X-Shift cluster. (C) Overlays of each cluster onto the UMAP from A. (D) The percentage of cells in each cluster coming from mesLN, SILP, or IEL. (E) The percentage of total CD4+ T cells represented by each cluster in uninfected or infected mice. (F) UMAP from A colored by expression levels of each marker. (G) Percentage of SMARTA T cells that fell into each cluster, with the total across all clusters equaling 100%. (H) UMAP showing where SMARTA T cells fell in the UMAP (black dots). Data are from one independent experiment representative of two independent experiments, n = 3 mice/group.
Figure 4.
Figure 4.
Progressive Th1 skewing of Cryptosporidium-specific CD4+ T cells. (A and B) WT B6 mice received 2 × 10⁴ SMARTA T cells 1 day prior to infection with 5 × 10⁴ maCp-ova-gp61 oocysts, and mesLN, SILP, and IEL were harvested at 10 dpi for flow cytometry. (A) Representative flow plots of T-bet versus RORγΤ in polyclonal CD44hiFoxp3 CD4+ T cells from uninfected mice, polyclonal CD44hiFoxp3 CD4+ T cells from infected mice, or SMARTA T cells (polyclonal CD44hiFoxp3 CD45.1+) from infected mice organized by tissue (rows). Gating: Singlets, Live+, CD19, NK1.1, EpCAM, CD90.2+, CD8a, CD4+, CD44hi, CD45.1+. (B) Percentage of T-bet+, or percentage negative for all lineage-defining TFs (T-bet, RORγΤ, Foxp3, GATA3; TF) in polyclonal CD44hi CD4+ T cells from uninfected mice (white), polyclonal CD44hi CD4+ T cells from infected mice (gray), or CD44hi SMARTA T cells (horizontal lines). Bar graphs in A and B are from n = 2 independent experiments, n = 3 mice/group, with data plotted as means with SEM. Statistical significance was determined by two-way ANOVA and multiple comparisons. *P ≤ 0.05, **P ≤ 0.01, ***P ≤ 0.001, ****P ≤ 0.0001. (C) Percentage of cells positive for CD44, or of CD44hi cells positive for IL-18Ra, Ly6A/E, or CD103 of polyclonal CD4+ T cells from uninfected mice, infected mice, or SMARTA T cells colored as in B from mice in Fig. 3. Bar plots show means with SEM with n = 3 mice/group. (D) Histograms of protein expression by flow cytometry among SMARTA T cells from the mesLN (teal), SILP (orange), or IEL (purple). Gating: Singlets, Live+, CD8aEpCAMNK1.1CD19CD4+TCRβ+CD44hiCD45.1+. Graphs in C and D are from one independent experiment representative of two independent experiments, n = 3 mice/group, with data plotted as means with SEM. Statistical significance was determined by two-way ANOVA and multiple comparisons. *P ≤ 0.05, **P ≤ 0.01, ***P ≤ 0.001, ****P ≤ 0.0001.
Figure S2.
Figure S2.
Analysis of TF and surface marker expression in Cryptosporidium-specific CD4+ T cells reveals progressive Th1 skewing and activation from the mesLN to the gut. (A–C) WT B6 mice received 2 × 10⁴ SMARTA T cells 1 day prior to infection with 5 × 10⁴ maCp-ova-gp61 oocysts and mesLN, SILP, and IEL were harvested at 10 dpi for flow cytometry. (A) Numbers of total, T-bet+, or TF (T-betRORγTGATA3Foxp3) CD4+ T cells in uninfected or infected mice at 10 dpi with 5 × 10⁴ maCp-ova-gp61. (B) Representative flow plots of Foxp3 versus RORγT in polyclonal CD44hi CD4+ T cells from uninfected mice, polyclonal CD44hi CD4+ T cells CD4+ T cells from infected mice, or CD44hi SMARTA T cells (CD45.1+) from infected mice organized by tissue (rows). Gating: Singlets, Live+, CD19, NK1.1, EpCAM, CD90.2+, CD8a, CD4+, CD44hi, CD45.1+. (C) Percentage of RORγT+ or Foxp3+ in polyclonal CD4+ T cells from uninfected mice (white), polyclonal CD4+ T cells from infected mice (gray), or SMARTA T cells (horizontal lines). Data in A–C are from n = 2 independent experiments, n = 3 mice/group, with data plotted as means with SEM. Statistical significance was determined by two-way ANOVA and multiple comparisons. *P ≤ 0.05, **P ≤ 0.01, ****P ≤ 0.0001. (D) Percentage of cells positive for SLAM, CXCR3, CD69, or CD40L of polyclonal CD44hi CD4+ T cells from uninfected mice (white), infected mice (gray), or CD44hi SMARTA T cells (stripes). (E) Histograms of protein expression by flow cytometry among SMARTA T cells from the mesLN (teal), SILP (orange), or IEL (purple). Gating: Singlets, Live+, CD8aEpCAMNK1.1CD19CD4+TCRβ+ CD44hi, CD45.1+. Data in D and E are from one independent experiment representative of two independent experiments, n = 3 mice/group. Bar graphs are plotted as means with SEM. Statistical significance was determined by two-way ANOVA and multiple comparisons. *P ≤ 0.05, **P ≤ 0.01, ***P ≤ 0.001, ****P ≤ 0.0001. (F and G) Representative flow cytometry plots of polyclonal CD44hi CD4+ T cells or CD44hi SMARTA T cells staining for Tfh markers PD-1, CXCR5, and Bcl6 (F) with summary in G. Gating: Singlets, Live+, CD19, NK1.1, EpCAM, CD90.2+, CD8a-, CD4+, CD44hi, CD45.1+. For F and G, data shown are pooled bar graphs, n = 2 independent experiments, n = 3 mice/group, with data plotted as means with SEM, n = 3 mice/group. Statistical significance was determined by two-way ANOVA and multiple comparisons.
Figure 5.
Figure 5.
IL-12p40 is produced in the gut by activated cDC1s. (A–D) WT B6 mice were left uninfected or infected with 5 × 10⁵ maCp oocysts. At 0 (uninfected), 1, 4, and 10 dpi mesLN and SILP cells were isolated, plated with brefeldin A (BFA) for 6 h, and analyzed by flow cytometry for surface markers and IL-12p40 expression. Plotted are histograms from mesLN (A) or SILP (C), summary in B and D. gMFI, geometric mean fluorescence intensity. (E and F) Absolute number of IL-12p40+ cDC1s, cDC2s, or macrophages (MΦs) (E) with flow plots of cDC1s in the mesLN and SILP in F showing selective induction of IL-12p40 in cDC1s in the SILP of infected mice. Histograms and gMFI shown are from one experiment representative of four independent experiments, 3–4 mice/group. Graphs in B, D, and E are pooled from these two independent experiments representative of four independent experiments. Bar graphs show means with SEM. Gating: Singlets, Live+, CD3e, NK1.1, EpCAM, B220, CD19, CD90.2, CD64+ (MΦs) or CD64, MHCII+, CD11c+, CD26+, Ly6C, XCR1+ (cDC1s) or SIRPα+ (cDC2s). Gating is based on fluorescence minus one (FMO) taken from SILP for all colors except IL-12p40, for which positivity is based on samples from each tissue plated without BFA. Statistical significance was determined by two-way ANOVA and multiple comparisons. *P ≤ 0.05, **P ≤ 0.01, ***P ≤ 0.001, ****P ≤ 0.0001.
Figure S3.
Figure S3.
Infection by Cryptosporidium does not change the proportions of mesLN resident or migratory cDCs nor IL-12 production in cDC2s or MΦs. (A–D) WT B6 mice were left uninfected or infected with 5 × 10⁵ maCp oocysts. At 0 (uninfected), 1, 4, and 10 dpi, mesLN and SILP cells were isolated, plated with brefeldin A (BFA) for 6 h, and analyzed by flow cytometry for surface markers and IL-12p40 expression. (A) The percentage of migratory (MHCIIhi) or resident (MHCIIint) cDCs plotted as a percentage of total cDCs with representative flow gating on the left. (B) Percentage of cDC1s (purple), cDC2s (green), or MΦs (yellow) staining IL-12p40+ as a percentage of each population in the mesLN and SILP. (C) Representative flow plots showing IL-12p40 staining in cDC2s. (D) Representative flow plots showing IL-12p40 staining in MΦs. Gating: Singlets, Live+, CD3e, NK1.1, EpCAM, B220, CD19, CD90.2, CD64+ (MΦs) or CD64, MHCII+, CD11c+, CD26+, Ly6C, XCR1+ (cDC1s) or SIRPα+ (cDC2s). Gating is based on FMOs taken from SILP for all colors except IL-12p40, for which positivity is based on samples from each tissue plated without BFA. Data are pooled from two independent experiments, n = 3 mice/group. Bar graphs show mean with SEM. Statistical significance was determined by two-way ANOVA and multiple comparisons. *P ≤ 0.05, **P ≤ 0.01, ****P ≤ 0.0001.
Figure S4.
Figure S4.
Irf8+32−/− mice specifically lack cDC1s during Cryptosporidium infection. (A) WT or Irf8+32−/− mice were left uninfected or infected with 5 × 10⁴ maCp oocysts. At 3 dpi, mice were sacrificed and percentage of cDC1s and cDC2s were quantified to confirm that cDC1s remained deficient in Irf8+32−/− mice. Gating: Singlets, Live+, CD3e, NK1.1, EpCAM, B220, CD19, CD90.2, CD64, MHCII-hi, CD11c+, CD26+, Ly6C, XCR1+ (cDC1s), or SIRPα+ (cDC2s). Shown is one independent experiment representative of two independent experiments, n = 3 mice/group. Bar graphs are plotted as mean with SEM. Statistical significance was determined by two-way ANOVA and multiple comparisons. ***P ≤ 0.001, ****P ≤ 0.0001.
Figure 6.
Figure 6.
cDC1s are required for optimal expansion, chemokine/cytokine receptor expression, and gut homing of Cryptosporidium-specific CD4+ T cells. (A–E) 1 day prior to infection with 5 × 10⁴ maCp-ova-gp61 oocysts, 1 × 10⁶ CD45.1+ Nur77-GFP reporter SMARTA T cells were labeled with CTV and transferred into WT B6 mice or age/sex-matched Irf8+32−/− mice. Mice were sacrificed at 1, 4, and 6 dpi and priming of SMARTA T cells was interrogated using flow cytometry. (A and B) Representative flow plots from the mesLN of infected mice at 1, 4, and 6 dpi pre-gated on SMARTA T cells showing Nur77-GFP expression compared to cell division, with summary in B showing means with SEM. (C–E) Representative flow plots from mesLN SMARTAs showing CTV versus CXCR3 (C) and LPAM-1 (D) with summary in E. Gating for SMARTAs in A–E: Singlets, Live+, NK1.1, CD19, EpCAM, CD90.2+, CD8a, CD4+, TCR Vβ8.3+, CD45.1+. For A–E, data is from one experiment representative of two independent experiments, n = 3 mice/group, bar graphs are plotted as mean with SEM. Statistical significance was determined by t test. *P ≤ 0.05, **P ≤ 0.01. (F–I) 1 day prior to infection with 5 × 10⁴ maCp-ova-gp61 oocysts, 2 × 10⁴ CD45.1+ SMARTA T cells were transferred into WT B6 mice or age/sex-matched Irf8+32−/− mice. At 10 dpi, mesLN, SILP, and IEL were isolated and analyzed by flow cytometry. (F) Representative flow plots showing the presence or absence of SMARTA T cells in the mesLN (top), SILP (middle), or IEL (bottom). Flow plots are from one experiment representative of four independent experiments. (G) Summary of F showing means with SEM. For F and G, data are from two independent experiments representative of four independent experiments, n = 3–4 mice/group. Bar graphs show mean with SEM. Statistical significance was determined by two-way ANOVA and multiple comparisons. *P ≤ 0.05, ****P ≤ 0.0001. (H and I) Percentage of mesLN SMARTA T cells staining positive for IL-18Ra with representative flow plots in H and summary in I. Gating for SMARTAs in G–I: Singlets, Live+, NK1.1, CD19, EpCAM, CD90.2+, CD8a, CD4+, CD44-hi, CD45.1+. For H and I, data are from one experiment representative of two independent experiments, n = 3 mice/group. Bar graphs show mean with SEM. Statistical significance was determined by two-way ANOVA and multiple comparisons. *P ≤ 0.05.
Figure 7.
Figure 7.
IL-12p40 is not required for gut homing but is required for gut CD4+ T cell effector functions in Cryptosporidium-specific CD4+ T cells. (A–G) 1 day prior to infection with 5 × 10⁴ maCp-ova-gp61 oocysts, 2 × 10⁴ CD45.1+ SMARTA T cells were transferred into WT B6 mice that were treated with isotype control (rat IgG2a) or αIL-12p40 (1 mg/mouse on d−1 and 2, 5, 8 dpi). At 10 dpi, mesLN, SILP, and IEL were isolated and analyzed by flow cytometry. (A) Infection was monitored by nluc of feces. (B and C) Percentage of SMARTA T cells among CD4+ T cells and absolute numbers of SMARTA T cells from each treatment (B) with representative flow plots from the SILP in C. (D and E) Percentage of SMARTA T cells staining T-bet+ (D) with representative flow plots from the SILP in E. (F and G) Percentage of SMARTA T cells staining for IL-18Ra (F) with representative flow plots from the SILP in G. Data in A–G is from two independent experiments, n = 3–4 mice/group, shown as means with SEM. Statistical significance was determined by two-way ANOVA and multiple comparisons. *P ≤ 0.05, **P ≤ 0.01, ***P ≤ 0.001. (H and I) 1 day prior to infection with 104 Cp-gp61, 5 × 10⁴ CD45.1+ SMARTA T cells that expressed CD90.1 as a reporter for Ifng expression were transferred into Ifng−/− mice that were treated with isotype control (rat IgG2a), αIL-12p40, αIL-18, or αIL12p40+αIL-18 (1 mg/mouse on d−1 and 2, 5, 8 dpi). Mice were also treated with 1 mg/mouse αIFN-γ on 3 and 7 dpi. At 10 dpi, mesLN, SILP, and IEL were isolated and analyzed by flow cytometry and cells were stained for CD90.1 to assess in vivo IFN-γ production. Data shown in H and I is from two independent experiments, n = 3 mice/group, shown as means with SEM. Statistical significance was determined by two-way ANOVA and multiple comparisons. *P ≤ 0.05, **P ≤ 0.01, ***P ≤ 0.001. (J and K) 1 day prior to infection with 104 Cp-gp61, 5 × 10⁴ CD45.1+ SMARTA T cells that expressed CD90.1 as a reporter for Ifng expression were transferred into Ifng−/− mice that were treated with isotype control (rat IgG2a) at d−1, d+2, d+5, d+8; αIL-12p40 d−1, d+2, d+5, d+8 (early), or isotype control at d−1, d+2, followed by αIL12p40 at d+6, d+8 (late). Mice were also treated with 1 mg/mouse αIFN-γ on 3 and 7 dpi. At 10 dpi, mesLN, SILP, and IEL were isolated and analyzed by flow cytometry, and cells were stained for CD90.1 to assess in vivo IFN-γ production. Gating for SMARTAs in B–K: Singlets, Live+, NK1.1, CD19, EpCAM, CD90.2+, CD8a, CD4+, CD44-hi, and CD45.1+. Data shown in J–K are from two independent experiments, n = 3 mice/group, shown as means with SEM. Statistical significance was determined by two-way ANOVA and multiple comparisons. **P ≤ 0.01, ***P ≤ 0.001, ****P ≤ 0.0001.
Figure S5.
Figure S5.
Gut IL-12p40 is required for optimal Ifng expression in Cryptosporidium-specific CD4+ T cells. (A and B) 1 day prior to infection with 5 × 10⁴ maCp-ova-gp61 oocysts, 2 × 10⁴ CD45.1+ SMARTA T cells were transferred into WT or Il12b−/− mice. At 10 dpi, mesLN, SILP, and IEL were isolated and analyzed by flow cytometry. Percentage of SMARTA T cells among CD4+ T cells and absolute numbers of SMARTA T cells from each genotype (A) with representative flow plots from the SILP in B. Gating: Singlets, Live+, NK1.1, CD19, EpCAM, CD90.2+, CD8a, CD4+, CD44hi, CD45.1+. Bar graphs in A and B are from n = 2 independent experiments, n = 3–4 mice/group, with data plotted as means with SEM. Statistical significance was determined by two-way ANOVA and multiple comparisons. *P ≤ 0.05. (C) 1 day prior to infection with 104 Cp-gp61, 5 × 10⁴ CD45.1+ SMARTA T cells that expressed CD90.1 as a reporter for Ifng expression were transferred into Ifng−/− mice that were treated with isotype control (rat IgG2a), αIL-12p40, αIL-18, or αIL12p40+αIL-18 (1 mg/mouse on d−1 and 2, 5, 8 dpi). Mice were also treated with 1 mg/mouse αIFN-γ on 3 and 7 dpi. At 10 dpi, mesLN, SILP, and IEL were isolated and analyzed by flow cytometry. Shown is the percentage of SMARTA T cells staining for IL-18Ra in each treatment condition. Gating: Singlets, Live+, NK1.1, CD19, EpCAM, CD90.2+, CD8a, CD4+, CD44hi, CD45.1+, IL-18Ra+. Bar graphs in C are from n = 2 independent experiments, n = 3–4 mice/group, with data plotted as means with SEM. Statistical significance was determined by two-way ANOVA and multiple comparisons. P ≤ 0.05, **P ≤ 0.01, ****P ≤ 0.0001. (D–G) 1 day prior to infection with 104 Cp-gp61, 5 × 10⁴ CD45.1+ SMARTA T cells that expressed CD90.1 as a reporter for Ifng expression were transferred into Ifng−/− mice. Mice were treated with vehicle control or 5 mg/kg/day of FTY720 on days 2–5 after infection with sacrifice on d6. SMARTA T cells were analyzed for expression of CD90.1 as a reporter of Ifng. Shown is one experiment representative of two independent experiments. Gating: Singlets, Live+, NK1.1, CD19, EpCAM, CD90.2+, CD8a, CD4+, CD44hi, CD45.1+, CD90.1+ (for D). n.d. = no data as no SMARTA T cells were found in the gut. Data shown in E–G is from one independent experiment representative of n = 2 independent experiments, n = 3 mice/group. Plotted are the means with SEM. Statistical significance was determined by two-way ANOVA and multiple comparisons. ***P ≤ 0.001.

Update of

Similar articles

Cited by

References

    1. Ahmadi, F., Junghus F., Ashworth C., Lappalainen A., Mörbe U., Kotarsky K., and Agace W.W.. 2023. cDC1-derived IL-27 regulates small intestinal CD4+ T cell homeostasis in mice. J. Exp. Med. 220:e20221090. 10.1084/jem.20221090 - DOI - PMC - PubMed
    1. Akagbosu, B., Tayyebi Z., Shibu G., Paucar Iza Y.A., Deep D., Parisotto Y.F., Fisher L., Pasolli H.A., Thevin V., Elmentaite R., et al. . 2022. Novel antigen-presenting cell imparts Treg-dependent tolerance to gut microbiota. Nature. 610:752–760. 10.1038/s41586-022-05309-5 - DOI - PMC - PubMed
    1. Bilate, A.M., London M., Castro T.B.R., Mesin L., Bortolatto J., Kongthong S., Harnagel A., Victora G.D., and Mucida D.. 2020. T cell receptor is required for differentiation, but not maintenance, of intestinal CD4+ intraepithelial lymphocytes. Immunity. 53:1001–1014.e20. 10.1016/j.immuni.2020.09.003 - DOI - PMC - PubMed
    1. Borad, A., and Ward H.. 2010. Human immune responses in cryptosporidiosis. Future Microbiol. 5:507–519. 10.2217/fmb.09.128 - DOI - PMC - PubMed
    1. Bouzid, M., Hunter P.R., Chalmers R.M., and Tyler K.M.. 2013. Cryptosporidium pathogenicity and virulence. Clin. Microbiol. Rev. 26:115–134. 10.1128/CMR.00076-12 - DOI - PMC - PubMed

MeSH terms