

Cognitive integrity in Non-Demented Individuals with Alzheimer's Neuropathology is associated with preservation and remodeling of dendritic spines
- PMID: 38829680
- PMCID: PMC11247701
- DOI: 10.1002/alz.13900
Cognitive integrity in Non-Demented Individuals with Alzheimer's Neuropathology is associated with preservation and remodeling of dendritic spines
Abstract
Introduction: Individuals referred to as Non-Demented with Alzheimer's Neuropathology (NDAN) exhibit cognitive resilience despite presenting Alzheimer's disease (AD) histopathological signs. Investigating the mechanisms behind this resilience may unveil crucial insights into AD resistance.
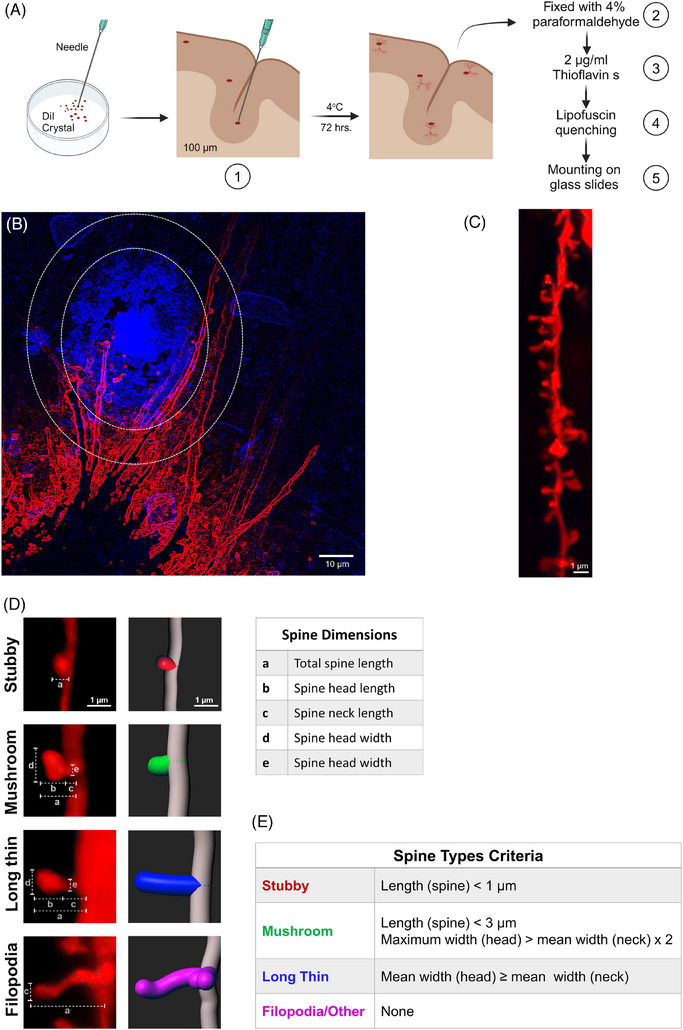
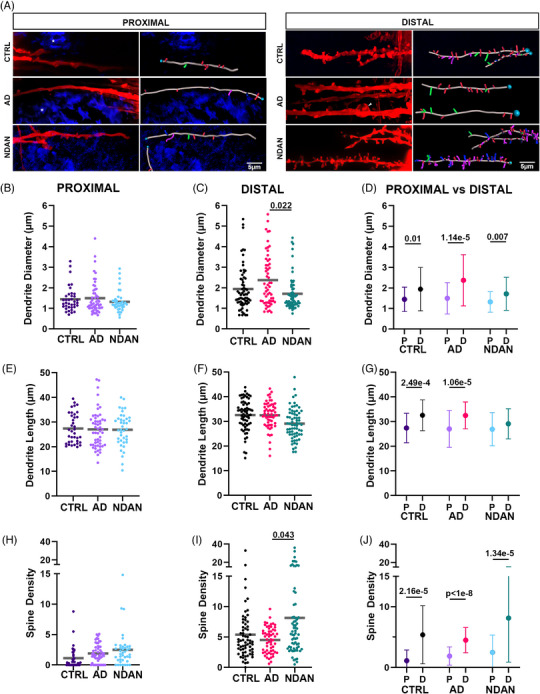
Methods: DiI labeling technique was used to analyze dendritic spine morphology in control (CTRL), AD, and NDAN post mortem frontal cortex, particularly focusing on spine types near and far from amyloid beta (Aβ) plaques.
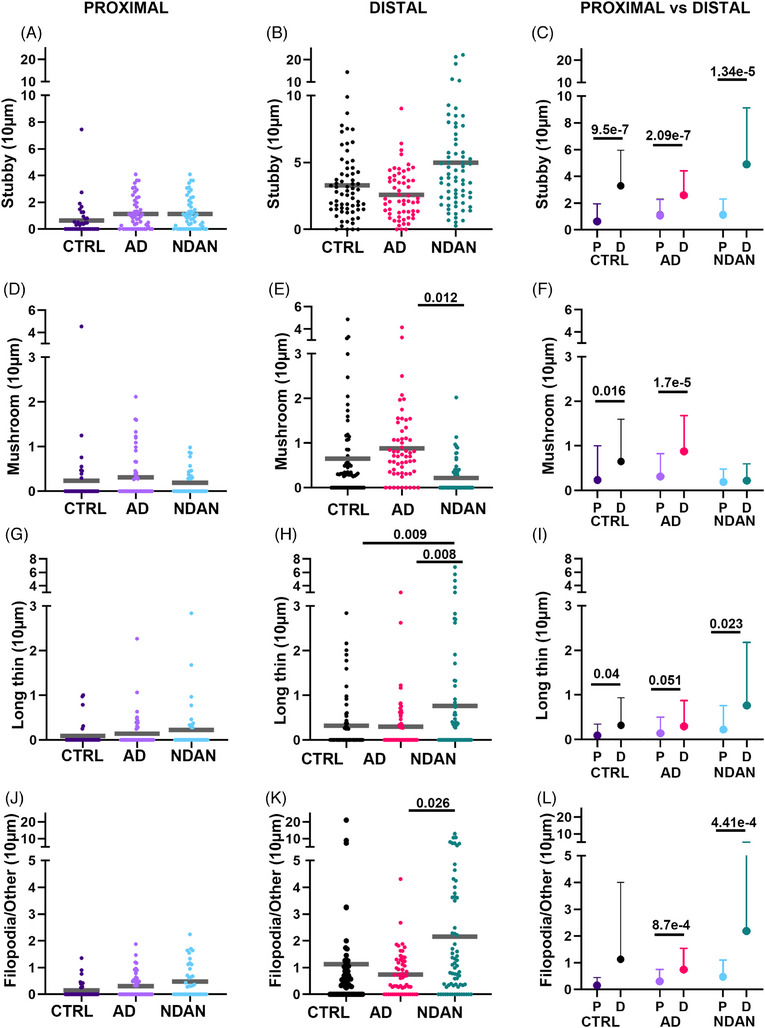
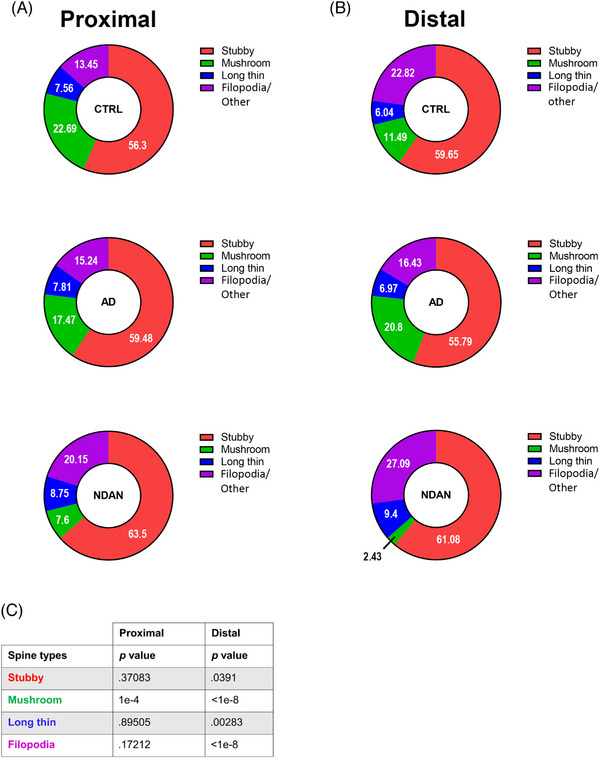
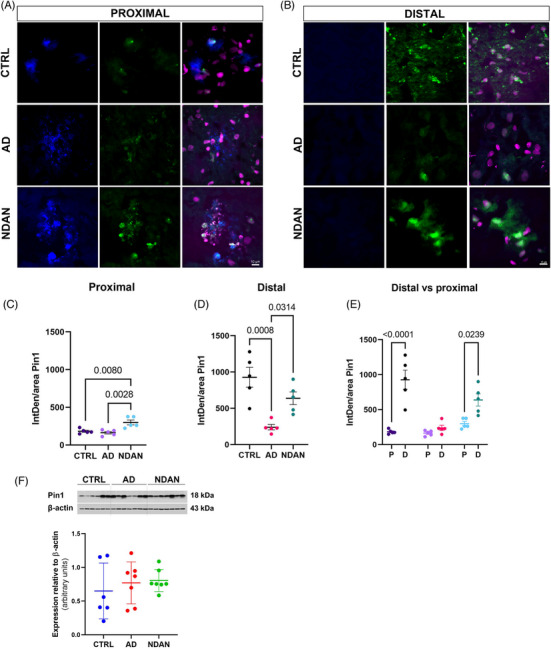
Results: NDAN subjects displayed a higher spine density in regions distant from Aβ plaques versus AD patients. In distal areas from the plaques, NDAN individuals exhibited more immature spines, while AD patients had a prevalence of mature spines. Additionally, our examination of levels of Peptidyl-prolyl cis-trans isomerase NIMA-interacting 1 (Pin1), a protein associated with synaptic plasticity and AD, showed significantly lower expression in AD versus NDAN and CTRL.
Discussion: These results suggest that NDAN individuals undergo synaptic remodeling, potentially facilitated by Pin1, serving as a compensatory mechanism to preserve cognitive function despite AD pathology.
Highlights: Spine density is reduced near Aβ plaques compared to the distal area in CTRL, AD, and NDAN dendrites. NDAN shows higher spine density than AD in areas far from Aβ plaques. Far from Aβ plaques, NDAN has a higher density of immature spines, AD a higher density of mature spines. AD individuals show significantly lower levels of Pin1 compared to NDAN and CTRL.
Keywords: Alzheimer's disease; Non‐Demented with Alzheimer's Neuropathology; Pin1; amyloid beta; cognitive resilience; dendritic spines; neurodegeneration; synaptic plasticity.
© 2024 The Authors. Alzheimer's & Dementia published by Wiley Periodicals LLC on behalf of Alzheimer's Association.
Conflict of interest statement
The authors declare no conflicts of interest. Author disclosures are available in the Supporting information.
Figures
Similar articles
-
Functional Integrity of Synapses in the Central Nervous System of Cognitively Intact Individuals with High Alzheimer's Disease Neuropathology Is Associated with Absence of Synaptic Tau Oligomers.J Alzheimers Dis. 2020;78(4):1661-1678. doi: 10.3233/JAD-200716. J Alzheimers Dis. 2020. PMID: 33185603 Free PMC article.
-
TREM2-induced activation of microglia contributes to synaptic integrity in cognitively intact aged individuals with Alzheimer's neuropathology.Brain Pathol. 2023 Jan;33(1):e13108. doi: 10.1111/bpa.13108. Epub 2022 Jul 11. Brain Pathol. 2023. PMID: 35816404 Free PMC article.
-
Potential Mechanisms Underlying Resistance to Dementia in Non-Demented Individuals with Alzheimer's Disease Neuropathology.J Alzheimers Dis. 2022;87(1):51-81. doi: 10.3233/JAD-210607. J Alzheimers Dis. 2022. PMID: 35275527 Free PMC article. Review.
-
Absence of amyloid β oligomers at the postsynapse and regulated synaptic Zn2+ in cognitively intact aged individuals with Alzheimer's disease neuropathology.Mol Neurodegener. 2012 May 28;7:23. doi: 10.1186/1750-1326-7-23. Mol Neurodegener. 2012. PMID: 22640423 Free PMC article.
-
Spines, plasticity, and cognition in Alzheimer's model mice.Neural Plast. 2012;2012:319836. doi: 10.1155/2012/319836. Epub 2011 Nov 28. Neural Plast. 2012. PMID: 22203915 Free PMC article. Review.
Cited by
-
Synapse vulnerability and resilience across the clinical spectrum of dementias.Nat Rev Neurol. 2025 Jul;21(7):353-369. doi: 10.1038/s41582-025-01094-7. Epub 2025 May 22. Nat Rev Neurol. 2025. PMID: 40404832 Review.
-
Olive Oil Industry By-Products as a Novel Source of Biophenols with a Promising Role in Alzheimer Disease Prevention.Molecules. 2024 Oct 12;29(20):4841. doi: 10.3390/molecules29204841. Molecules. 2024. PMID: 39459209 Free PMC article. Review.
-
Brief sleep disruption alters synaptic structures among hippocampal and neocortical somatostatin-expressing interneurons.bioRxiv [Preprint]. 2025 Feb 5:2024.07.22.604591. doi: 10.1101/2024.07.22.604591. bioRxiv. 2025. Update in: Sleep. 2025 Jun 13;48(6):zsaf064. doi: 10.1093/sleep/zsaf064. PMID: 39211205 Free PMC article. Updated. Preprint.
-
Brief sleep disruption alters synaptic structures among hippocampal and neocortical somatostatin-expressing interneurons.Sleep. 2025 Jun 13;48(6):zsaf064. doi: 10.1093/sleep/zsaf064. Sleep. 2025. PMID: 40096531
References
Publication types
MeSH terms
Grants and funding
LinkOut - more resources
Full Text Sources
Medical
Miscellaneous
