Meta-Analysis
. 2024 Sep 27;75(18):5655-5666.
doi: 10.1093/jxb/erae259.

Green light is similarly effective in promoting plant biomass as red/blue light: a meta-analysis

Affiliations
Meta-Analysis

Green light is similarly effective in promoting plant biomass as red/blue light: a meta-analysis

Yunke Chen et al. J Exp Bot. .

Abstract

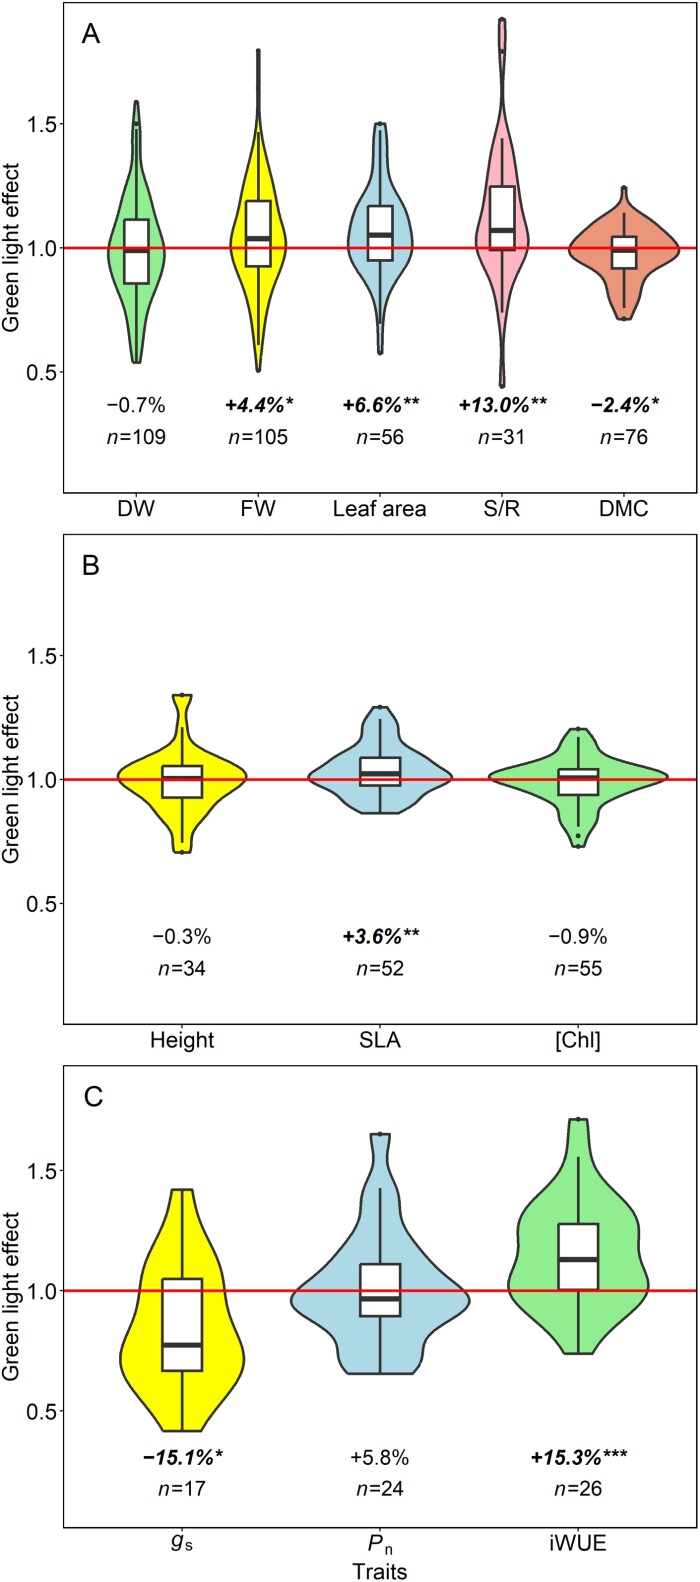
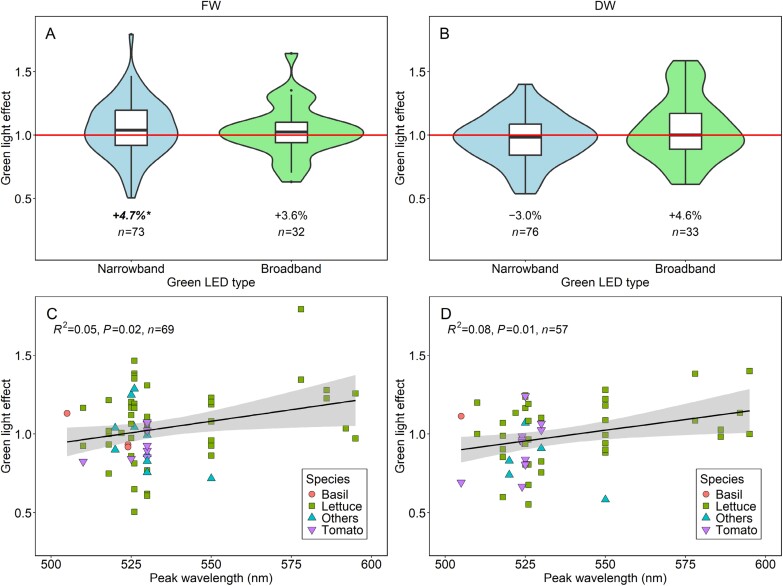
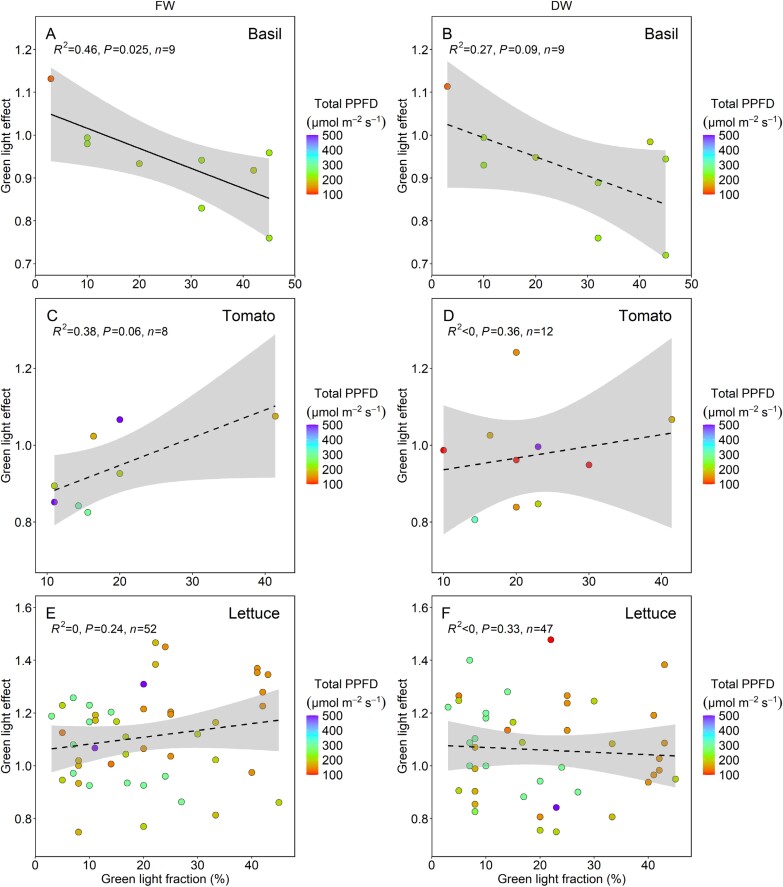
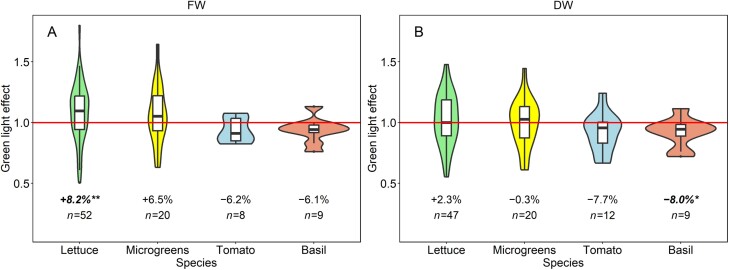
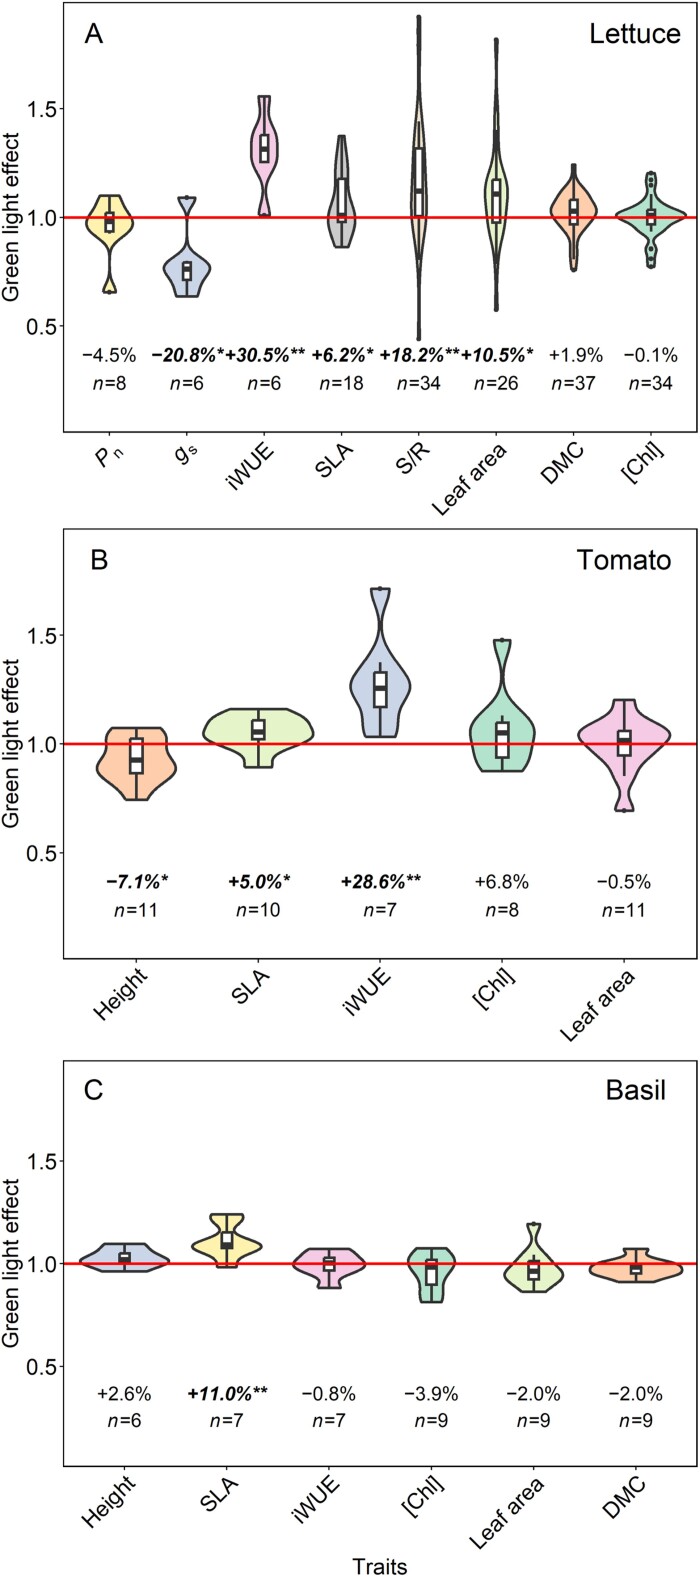
Whether green light promotes or represses plant growth is an unresolved but important question, warranting a global meta-analysis of published data. We collected 136 datasets from 48 publications on 17 crop species, and calculated the green light effect for a range of plant traits. For each trait the effect was calculated as the ratio between the trait value attained under a red/blue background light plus green, divided by the value attained under the background light only, both having the same light intensity. Generally, green light strongly increased intrinsic water use efficiency (15%), the shoot-to-root ratio (13%), and decreased stomatal conductance (-15%). Moreover, green light increased fresh weight to a small extent (4%), but not plant dry weight, resulting in a reduced dry matter content (-2%). Hence, green light is similarly effective at increasing biomass as red and blue light. Green light also showed to increase leaf area (7%) and specific leaf area (4%; i.e. thinner leaves). Furthermore, effects of green light were species-dependent, with positive effects on biomass for lettuce and microgreens, and negative effects in basil and tomato. Our data suggest that future research should focus on the role of green light in modulating water loss, its putative role as a shade signal, and the causes for its species-specific effects on crop biomass.

Keywords: Green light; LED; intrinsic water use efficiency; meta-analysis; plant growth; quantitative analysis; shoot–root ratio; stomatal conductance.


Conflict of interest statement

The authors declare no conflicts of interest.

Figures

Fig. 1.
Fig. 1.
Green light effects on traits related to biomass (A), light interception (B), and photosynthetic gas exchange (C). The green light effect was calculated as the value of a trait in plants grown under RGB, divided by the value obtained under RB. Percentages represent green light effects, and ‘+’ and ‘−’ refer to increase and decrease of mean trait values, respectively. Bold italic values indicate significant effects: *, **, and *** represent significance at P=0.05, 0.01, and 0.001, respectively. n refers to the number of datasets per trait. For violin plots, shapes around each boxplot indicate the probability density of the data; components of each boxplot from top to bottom are the maximum value, the third quartile, the median, the second quartile, and the minimum values. The red horizontal line indicates a green light effect of 1.00, i.e. no effect. Abbreviations: B, blue light; [Chl], chlorophyll content; DMC, dry matter content; DW, dry weight; FW, fresh weight; G, green light; gs, stomatal conductance; iWUE, intrinsic water use efficiency; Pn, net photosynthesis rate; R, red light; SLA, specific leaf area; S/R, shoot-to-root ratio based on DW.
Fig. 2.
Fig. 2.
Green light effects on fresh (A, C) and dry weight (B, D) comparing narrowband and broadband green LEDs (A, B) and green light effects on plant biomass in different species as a function of peak wavelength of narrowband green LEDs (C, D). The green light effect was calculated as the value of a trait in plants grown under RGB, divided by the value obtained under RB. Percentages represent the overall effects induced by green light, and ‘+’ and ‘−’ refer to increase and decrease of mean trait values, respectively. Bold italic values indicate significant values: * represents a significant effect at P=0.05. n refers to the number of datasets. For violin plots, shapes around each boxplot indicate the probability density of the data; components of each boxplot from top to bottom are the maximum value, the third quartile, the median, the second quartile, and the minimum values. The red horizontal line indicates a green light effect of 1.00, i.e. no effect. For scatter plots, R2, P, and n represent the squared correlation coefficient of the regression, the P-value for the linear regression, and the number of datapoints. The black lines and grey shaded area are regression lines and 95% confidence intervals, respectively. Abbreviations: B, blue light; DW, dry weight; FW, fresh weight; G, green light; R, red light.
Fig. 3.
Fig. 3.
Green light effects on fresh weight (A, C, E) and dry weight (B, D, F) in different species as a function of green light fraction in the spectrum in basil (A, B), tomato (C, D), and lettuce (E, F). The green light effect was calculated as the value of a trait in plants grown under RGB, divided by the value obtained under RB. Different colors of symbols indicate total PPFD. R2, P, and n represent the squared correlation coefficient of the regression, the P-value for the linear regression, and the number of datapoints. The black line, black dashed lines, and grey shaded area are regression lines with and without significant P-values and 95% confidential intervals, respectively. Abbreviations: B, blue light; DW, dry weight; FW, fresh weight; G, green light; PPFD: photosynthetic photon flux density; R, red light.
Fig. 4.
Fig. 4.
Green light effects on fresh weight (A) and dry weight (B) across several horticultural crops. The green light effect was calculated as the value of a trait in plants grown under RGB, divided by the value obtained under RB. Percentages represent the overall effects induced by green light, and ‘+’ and ‘−’ refer to increase and decrease of mean trait values, respectively. Bold italic values indicate significant values: * and ** represent significant effects at P=0.05 and 0.01, respectively. n refers to the number of datasets. For violin plots, shapes around each boxplot indicate the probability density of the data; components of each boxplot from top to bottom are the maximum value, the third quartile, the median, the second quartile, and the minimum values. The red horizontal line indicates a green light effect of 1.00, i.e. no effect. Abbreviations: B, blue light; DW, dry weight; FW, fresh weight; G, green light; R, red light.
Fig. 5.
Fig. 5.
Green light effects on traits underlying growth in lettuce (A), tomato (B), and basil (C). The green light effect was calculated as the value of a trait in plants grown under RGB, divided by the value obtained under RB. Percentages represent the overall effects induced by green light, and ‘+’ and ‘−’ refer to increase and decrease of mean trait values, respectively. Bold italic values indicate significant values: * and ** represent significant effects at P=0.05 and 0.01, respectively. n refers to the number of datasets. For violin plots, shapes around each boxplot indicate the probability density of the data; components of each boxplot from top to bottom are the maximum value, the third quartile, median, the second quartile, and the minimum values. The red horizontal line indicates a green light effect of 1.00, i.e. no negative effect. Abbreviations: B, blue light; [Chl], chlorophyll content; DMC, dry matter content; DW, dry weight; FW, fresh weight; G, green light; gs, stomatal conductance; iWUE, intrinsic water use efficiency; Pn, net photosynthesis rate; R, red light; SLA, specific leaf area; S/R, shoot-to-root ratio based on DW.

Similar articles

Cited by

References

    1. Bantis F, Smirnakou S, Ouzounis T, Koukounaras A, Ntagkas N, Radoglou K.. 2018. Current status and recent achievements in the field of horticulture with the use of light-emitting diodes (LEDs). Scientia Horticulturae 235, 437–451.
    1. Battle MW, Vegliani F, Jones MA.. 2020. Shades of green: untying the knots of green photoperception. Journal of Experimental Botany 71, 5764–5770. - PMC - PubMed
    1. Bian Z, Cheng R, Yang Q, Wang J, Lu C.. 2016. Continuous light from red, blue, and green light-emitting diodes reduces nitrate content and enhances phytochemical concentrations and antioxidant capacity in lettuce. Journal of the American Society for Horticultural Science 141, 186–195.
    1. Bian Z, Wang Y, Zhang X, Grundy S, Hardy K, Yang Q, Lu C.. 2021. A transcriptome analysis revealing the new insight of green light on tomato plant growth and drought stress tolerance. Frontiers in Plant Science 12, 649283. - PMC - PubMed
    1. Bian Z, Zhang X, Wang Y, Lu C.. 2019. Improving drought tolerance by altering the photosynthetic rate and stomatal aperture via green light in tomato (Solanum lycopersicum L.) seedlings under drought conditions. Environmental and Experimental Botany 167, 103844.

Publication types

LinkOut - more resources