. 2024 Jun 3;20(6):e1012265.
doi: 10.1371/journal.ppat.1012265. eCollection 2024 Jun.

Elucidating the spatio-temporal dynamics of the Plasmodium falciparum basal complex

Affiliations

Elucidating the spatio-temporal dynamics of the Plasmodium falciparum basal complex

Alexander A Morano et al. PLoS Pathog. .

Abstract

Asexual replication of Plasmodium falciparum occurs via schizogony, wherein 16-36 daughter cells are produced within the parasite during one semi-synchronized cytokinetic event. Schizogony requires a divergent contractile ring structure known as the basal complex. Our lab has previously identified PfMyoJ (PF3D7_1229800) and PfSLACR (PF3D7_0214700) as basal complex proteins recruited midway through segmentation. Using ultrastructure expansion microscopy, we localized both proteins to a novel basal complex subcompartment. While both colocalize with the basal complex protein PfCINCH upon recruitment, they form a separate, more basal subcompartment termed the posterior cup during contraction. We also show that PfSLACR is recruited to the basal complex prior to PfMyoJ, and that both proteins are removed unevenly as segmentation concludes. Using live-cell microscopy, we show that actin dynamics are dispensable for basal complex formation, expansion, and contraction. We then show that EF-hand containing P. falciparum Centrin 2 partially localizes to this posterior cup of the basal complex and that it is essential for growth and replication, with variable defects in basal complex contraction and synchrony. Finally, we demonstrate that free intracellular calcium is necessary but not sufficient for basal complex contraction in P. falciparum. Thus, we demonstrate dynamic spatial compartmentalization of the Plasmodium falciparum basal complex, identify an additional basal complex protein, and begin to elucidate the unique mechanism of contraction utilized by P. falciparum, opening the door for further exploration of Apicomplexan cellular division.


Conflict of interest statement

The authors have declared that no competing interests exist.

Figures
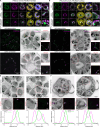
Fig 1
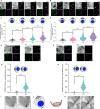
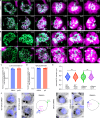
Fig 1. PfMyoJ and PFSLACR localize to a separate BC subcompartment basal to PfCINCH.
A) Immunofluorescence of PfMyoJ and PfCINCH at mid-segmentation, active contraction, and completed contraction (Compound 1-stalled) with inner membrane complex marker PfGAP45. White boxes on merge panel indicate the 3x-zoomed region shown in the rightmost panel. B) Same as A) but with PfSLACR instead of PfMyoJ. C) U-ExM of PfMyoJ and PfCINCH during mid-segmentation and active contraction; images are of the same cell with (right) and without (left) NHS Ester (grey). Red boxes on the NHS Ester-merged image indicate the 1.5x-zoomed region to the right of each panel. D) Same as C) but with PfSLACR instead of PfMyoJ. E) Multiple U-ExM slices of E64-stalled schizont showing PfMyoJ and PfCINCH in the basal complex. Red boxes indicate the 1.5x-zoomed region below each slice. White lines drawn across the basal complex in the PfMyoJ and PfCINCH-only panels correspond to plotted fluorescence intensity traces below. F) Same as E) but with PfSLACR instead of PfMyoJ. Scale bar = 1 μm, except for the non-insets of C)-F), where scale bar = 5 μm and the zoom panels of A) and B) where scale bar = 500 nm.
Fig 2
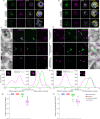
Fig 2. PfMyoJ and PfSLACR initially nearly colocalize with PfCINCH but localize to a more basal BC subcompartment in later segmentation.
A) U-ExM localization of PfMyoJ and PfCINCH at four time points defined by BC appearance: mid-segmentation (TP1, ~46 HPI), active contraction (TP2, ~47 HPI), complete contraction (TP3, ~48 HPI), and post-egress (TP4, >48 HPI and E64-stalled). B) Same as A) but with PfSLACR instead of PfMyoJ. C) Quantification of expanded distance between PfMyoJ and PfCINCH fluorescence intensity peaks. n = 40 BC rings, 250–300 measurements/time point. Graphical representations of each time point are presented above the data. D) Same as C) but with PfSLACR instead of PfMyoJ. n = 40 BC rings, 250–300 measurements/time point. E) U-ExM localization of PfMyoJ and PfCINCH in sideways-oriented rings for TP1 and 4. F) Same as D) but with PfSLACR instead of PfMyoJ. G) Quantification of expanded distance between PfMyoJ and PfCINCH fluorescence intensity peaks on sideways-oriented rings. n = 50–60 BC rings, 110–125 measurements/time point. Graphical representations of TP1/4 are presented above the data. H) Same as G) but with PfSLACR instead of PfMyoJ. n = 50–60 BC rings, 110–125 measurements/time point. I) U-ExM localization of PfMyoJ and PfCINCH in an E64-stalled post-egress merozoite with NHS ester intensity beneath the main BC ring. J) Schematic depiction of BC subcompartments in mature merozoites. K) Same as I) but with PfSLACR and PfCINCH. Magenta arrow in NHS-only panels indicates PfCINCH ring, green arrow indicates dot-like density beneath main ring corresponding to PfSLACR K) or PfMyoJ I). The data in C), D), G), and H) were analyzed with an unpaired two-tailed student’s t-test and are displayed as violin plots. **** = p<0.0001. All scale bars = 1 μm.
Fig 3
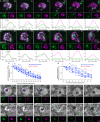
Fig 3. PfMyoJ and PfSLACR are partially removed from the basal complex at the end of segmentation.
A) Immunofluorescence of PfMyoJ and PfCINCH during active contraction, completed contraction, and post-egress time points with inner membrane complex marker PfGAP45. B) Same as A) but with PfSLACR instead of PfMyoJ. C) U-ExM slices of late segmentation PfMyoJ-smV5; PfCINCH-smMyc parasites showing various non-basal complex PfMyoJ localization phenotypes. D) Same as C) but with PfSLACR instead of PfMyoJ. E) Graphs of fluorescence intensity for PfCINCH and PfMyoJ in adjacent merozoites, one PfMyoJ-negative (left) one PfMyoJ-positive (right). Images of BCs are in the top left of the graph with white lines indicating the fluorescence intensity trace. F) Same as E) but with PfSLACR instead of PfMyoJ. G) Quantification of PfMyoJ-positive merozoites in E64-stalled PfMyoJ-PfCINCH dual tagged parasites. n = 8–12 schizonts per time point, 25–35 merozoites per schizont. H) Same as G) but with PfSLACR-PfCINCH dual tagged parasites. n = 8–12 schizonts per time point, 25–35 merozoites per schizont. For G) and H), individual values are shown along with the mean. All scale bars = 1 μm.
Fig 4
Fig 4. PfMyoJ and PfSLACR are removed from the basal complex to the residual body.
A) Selected time points from Video 1 of live cell imaging of PfMyoJ-mNeonGreen (mNG); PfCINCH-mScarlet (mSc) parasites starting immediately pre-egress. Below images of each time point are graphs of fluorescence intensity for PfMyoJ and PfCINCH in a selected merozoite, with white lines indicating the fluorescence intensity trace and the maximum fluorescence at each time point for each channel normalized to the maximum fluorescence at the beginning of imaging. B) Same as A) but images are from Video 2 with PfSLACR-mNeonGreen. C) Plot comparing changes in relative fluorescence intensity of selected individual merozoites (in the PfMyoJ channel) of schizont represented in A) to changes in the entire schizont. D) Same as C), but with PfSLACR; graph made from data taken from schizont in B). E) Selected time points of live cell imaging of PfMyoJ-mNG; PfCINCH-mSc parasites starting immediately pre-egress. Red dotted line delineates boundary of residual body in post-egress parasite. F) Same but with PfSLACR instead of PfMyoJ. All time displayed as hours:minutes, all scale bars = 1 μm.
Fig 5
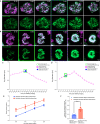
Fig 5. PfSLACR is recruited to the basal complex before PfMyoJ.
A) Selected time points from Video 3 of live cell imaging of PfMyoJ-mNG; PfCINCH-mSc parasites. Green box = first observation of continuous PfMyoJ ring. Blue dashed box = BC diameter is greatest. B) Same as A) but with PfSLACR-mNG; PfCINCH-mSc parasites. Images from Video 4. C) Graph of mean BC diameter of PfMyoJ-mNG; PfCINCH-mSc parasites over time; pink line = measurements for schizont in A). Green box = first observation of continuous PfMyoJ ring. Blue squares = mean BCDs of additional schizonts at the first observation of continuous PfMyoJ ring. D) Same as C) but with PfSLACR-mNG; PfCINCH-mSc parasites; pink line = measurements for schizont in B). E) Graph comparing fraction of schizonts per field positive for PfSLACR (red) or PfMyoJ (blue) depending on strain. n = 6 fields/strain; 30–50 parasites/field. F) Graph comparing fraction of schizonts per field positive for PfSLACR (red) or PfMyoJ (blue) depending on line at the first time point (just after 44 HPI; t = 0:00). Time represented as hours:minutes. All scale bars = 1 μm. For C), D), E), and F), data are represented as mean ± SD. The data in F) were analyzed with an unpaired two-tailed student’s t-test and represented as mean ± SD. **** = p<0.0001.
Fig 6
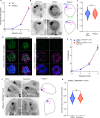
Fig 6. Knockout of PfMyoJ and/or PfMORN1 does not inhibit basal complex contraction.
A) Flow cytometry-based replication curve comparing ΔPfMyoJ parasites to parental 3D7-DiCre line. B) Projections of 10–20 U-ExM slices comparing basal complex width in individual post-egress merozoites between ΔPfMyoJ and parental 3D7-DiCre parasites using AF405 NHS-Ester. A diagram illustrating basal complex orientation within the merozoite is adjacent to the ΔPfMyoJ images. C) Quantification of expanded basal complex diameter in ΔPfMyoJ and parental 3D7 parasites. n = 8–10 parasites, 240–260 basal complexes/condition. D) Immunofluorescence of PfMORN1-smV5 in ΔPfMyoJ background along with IMC marker PfGAP45 in DMSO (left) and rapamycin (right) treated parasites in mid- (left columns) and late (right columns) segmentation. E) Flow cytometry-based replication curve comparing replication rates of ΔPfMyoJ; PfMORN1loxP-smV5 parasites when treated with DMSO and rapamycin. F) Projections of 10–20 U-ExM slices comparing basal complex diameter in individual post-egress DMSO and rapamycin treated ΔPfMyoJ; PfMORN1loxP-smV5 merozoites using AF405 NHS-Ester. A diagram illustrating basal complex orientation within the merozoite is adjacent to the rapamycin images. G) Quantification of expanded basal complex diameter in DMSO and rapamycin treated ΔPfMyoJ; PfMORN1loxP-smV5 merozoites. n = 5–7 parasites, 130–160 basal complexes/condition. The data in C) and G) were analyzed with an unpaired one-tailed student’s t-test and are displayed as violin plots. ns = p>0.05. All scale bars = 1 μm.
Fig 7
Fig 7. Chemical disruption of actin dynamics does not impact basal complex contraction.
A) Selected time points of live cell imaging of PfCINCH-mNG; PfIMC1c-mCherry (mCh) parasites treated with DMSO (from Video 5, top row) or 2 μM cytoD (from Video 6, bottom row). B) Same as A), but with 1 μM jasplakinolide (DMSO images from Video 7, jas images from Video 8). C) Fraction of egressing parasites per field with fully contracted basal complexes (BCs that contracted to the point that their diameter could not be measured) between DMSO and 2 μM cytoD-treated parasites. n = 6 fields/condition, 30–50 parasites/field. D) Fraction of egressing parasites per field with fully contracted basal complexes between DMSO and 1 μM jasplakinolide-treated parasites. n = 12 fields/condition, 40–60 parasites/field. E) Quantification of expanded basal complex diameter between 3D7-DiCre and ΔPfMyoJ DMSO/cytoD-treated parasites. n = 6–8 parasites; 150–250 measurements/condition. F) U-ExM slices of post-egress (E64 stalled) 3D7-DiCre and ΔPfMyoJ parasites treated with DMSO or 2 μM cytoD at 44 HPI and E64 at 46 HPI. A diagram illustrating basal complex orientation within the merozoite is adjacent to the U-ExM images. Time depicted as hours:minutes. The data in C) and D) are displayed as mean ± SD with individual values overlayed. The data in E) were analyzed with separate unpaired one-tailed student’s t-tests and are displayed as violin plots. ns = p>0.05. All scale bars = 1 μm.
Fig 8
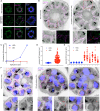
Fig 8. PfCen2 localizes to the basal complex and is essential for completing BC contraction.
A) Immunofluorescence of episomally-expressed 2HA-PfCen2 and smV5-PfCen2 in mid-segmentation and post-egress (E64-stalled) parasites, with basal complex marker PfMORN1. B) U-ExM of episomally-expressed smV5-Cen2 and IMC-associated alveolin protein PfIMC1g in mid-segmentation and completed contraction (C1-stalled) parasites. Red boxes indicate the 1.5x-zoomed region below each panel; red arrows point to basal cup localization of smV5-PfCen2. C) Flow cytometry-based replication curve comparing PfCen2Tet parasites in the presence (PfCen2-sufficient) and absence (PfCen2-deficient) of ATc. D) Quantification of expanded basal complex diameter between E64-stalled PfCen2-sufficient and -deficient PfCen2Tet parasites. n = 6–10 parasites; 180–210 measurements/condition. E) Comparison of expanded basal complex diameters measured in 5 schizonts, demonstrating significant variance in PfCen2-deficient BCDs. F) U-ExM slices of post-egress (E64 stalled) PfCen2-sufficient and -deficient PfCen2Tet parasites. Adjacent images in PfCen2-deficient condition show different slices of the same schizont. Red boxes indicate the 1.5x-zoomed region below each panel; red arrows point to enlarged basal complexes in two different areas of the schizont. All scale bars = 1 μm except the non-zoomed U-ExM panels in F) where scale bar = 5 μm.
Fig 9
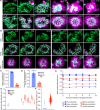
Fig 9. Calcium signaling is required, but not solely responsible for BC contraction.
A) Selected time points of live cell imaging of PfCINCH-mNG; PfIMC1c-mCherry (mCh) parasites treated with DMSO (from Video 9, top row) or 30 μM BAPTA-AM (from Video 10, bottom row). B) Selected time points of live cell imaging of PfCINCH-mNG; PfIMC1c-mCherry (mCh) parasites starting at different stages of schizogony: pre-contraction (top row), early-contraction (middle row), and late-contraction (bottom row). Left panel shows parasites treated with DMSO, right panel shows parasites treated with 5 μM A23187. C) Fraction of parasites per field that egressed during imaging. D) Fraction of non-egressing parasites that had fully contracted basal complexes (BCs that contracted to the point that their diameter could not be measured) at the end point of imaging between DMSO and 30 μM BAPTA-AM-treated parasites. The data in C) and D) are displayed as mean ± SD with individual values overlayed. E) Plot of measured basal complex diameter (BCD) at the end point of imaging for all non-egressing parasites in a DMSO treated field and 10 selected non-egressing parasites in a BAPTA-AM treated field. Each violin = measurements from one parasite. F) Plot of measured BCDs from all non-egressing parasites in each DMSO-treated field and 10 selected non-egressing parasites from each BAPTA-AM treated field. For C-F, n = 10 fields/condition, 50–70 parasites/field. G) Graph of measured BCD for parasites in B) over the course of imaging. Conditions are matched by color, stage of segmentation is matched by symbol. Time depicted as hours:minutes. All scale bars = 1 μm.

Similar articles

References

    1. World Health Organization. World Malaria Report 2021. 2021.
    1. Alonso P, Noor AM. The global fight against malaria is at crossroads. Lancet. 2017;390(10112):2532–4. doi: 10.1016/S0140-6736(17)33080-5 - DOI - PubMed
    1. Amos B, Aurrecoechea C, Barba M, Barreto A, Basenko EY, Bazant W, et al.. VEuPathDB: the eukaryotic pathogen, vector and host bioinformatics resource center. Nucleic Acids Res. 2022;50(D1):D898–D911. doi: 10.1093/nar/gkab929 - DOI - PMC - PubMed
    1. Aurrecoechea C, Brestelli J, Brunk BP, Dommer J, Fischer S, Gajria B, et al.. PlasmoDB: a functional genomic database for malaria parasites. Nucleic Acids Res. 2009;37(Database issue):D539–43. doi: 10.1093/nar/gkn814 - DOI - PMC - PubMed
    1. Francia ME, Striepen B. Cell division in apicomplexan parasites. Nat Rev Microbiol. 2014;12(2):125–36. doi: 10.1038/nrmicro3184 - DOI - PubMed

MeSH terms

Substances