

Avian influenza viruses in New Zealand wild birds, with an emphasis on subtypes H5 and H7: Their distinctive epidemiology and genomic properties
- PMID: 38829903
- PMCID: PMC11146706
- DOI: 10.1371/journal.pone.0303756
Avian influenza viruses in New Zealand wild birds, with an emphasis on subtypes H5 and H7: Their distinctive epidemiology and genomic properties
Abstract
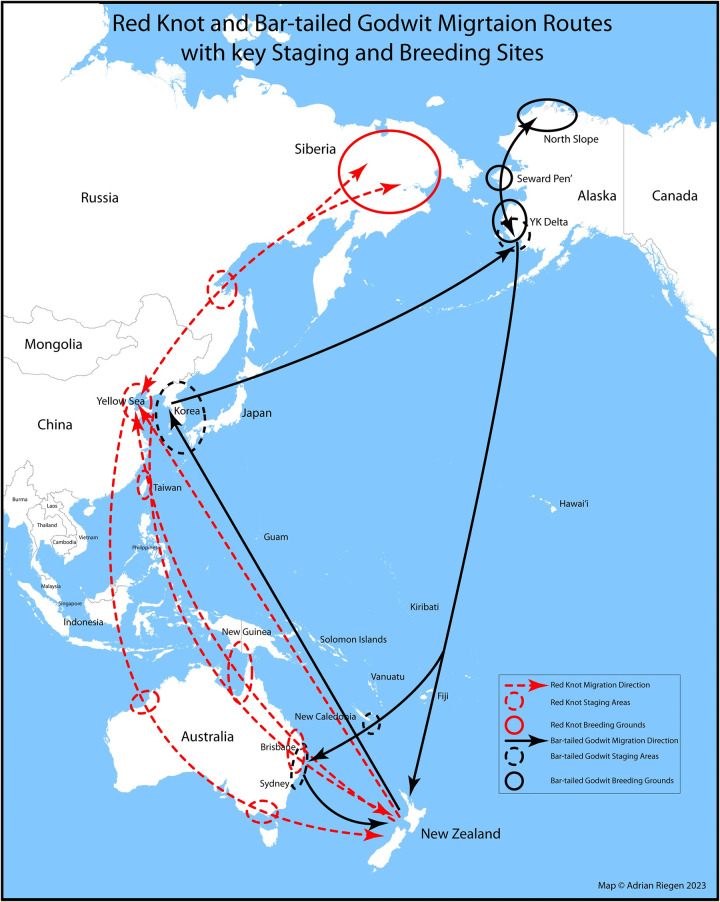
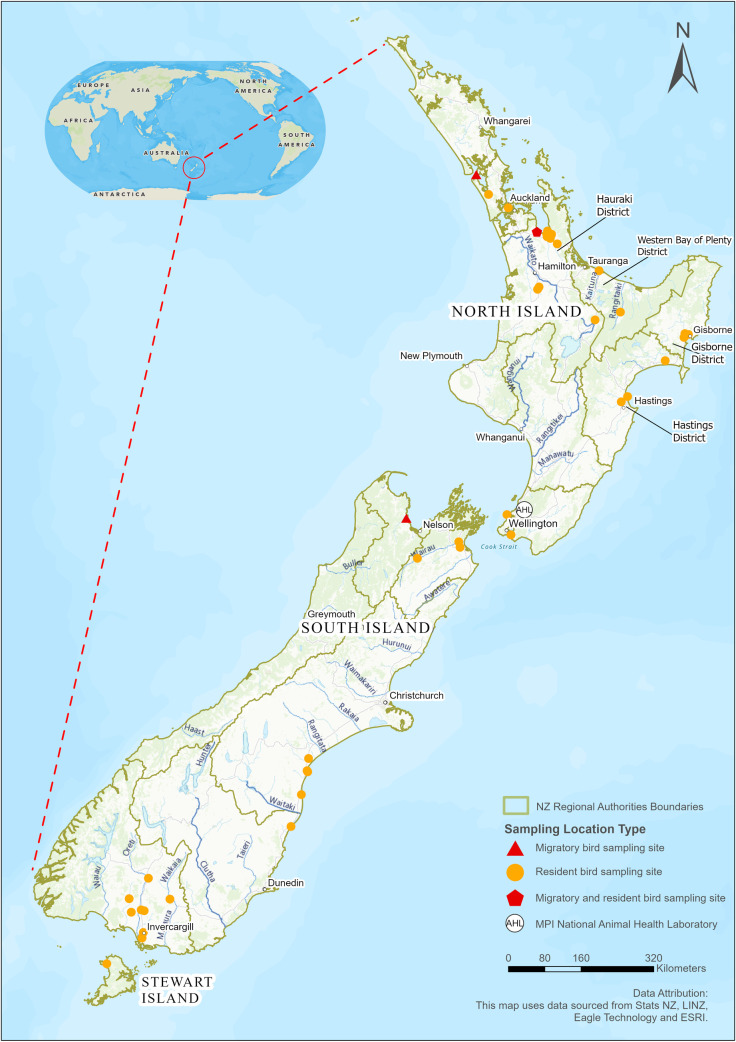
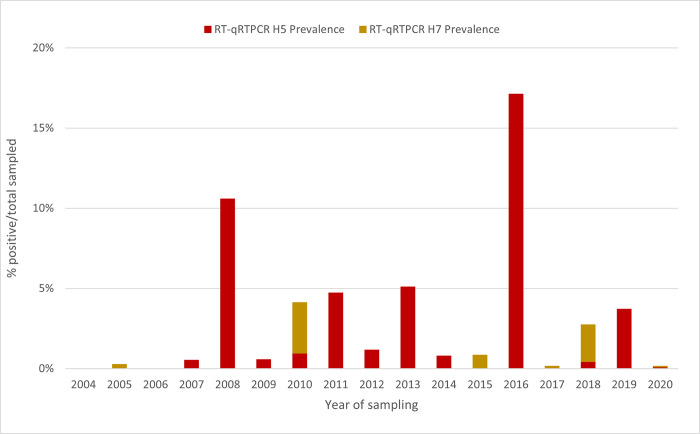
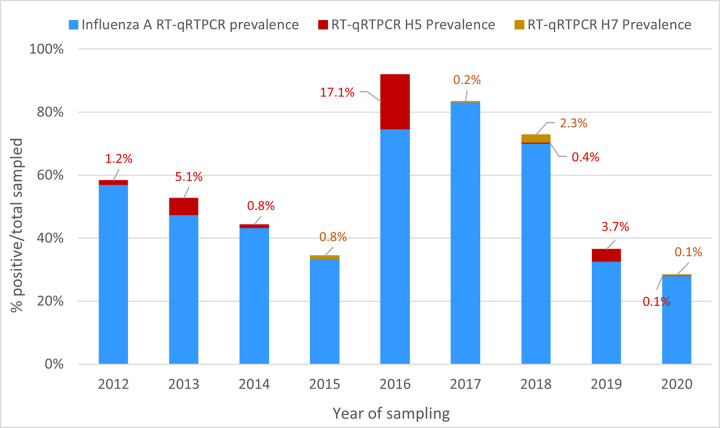
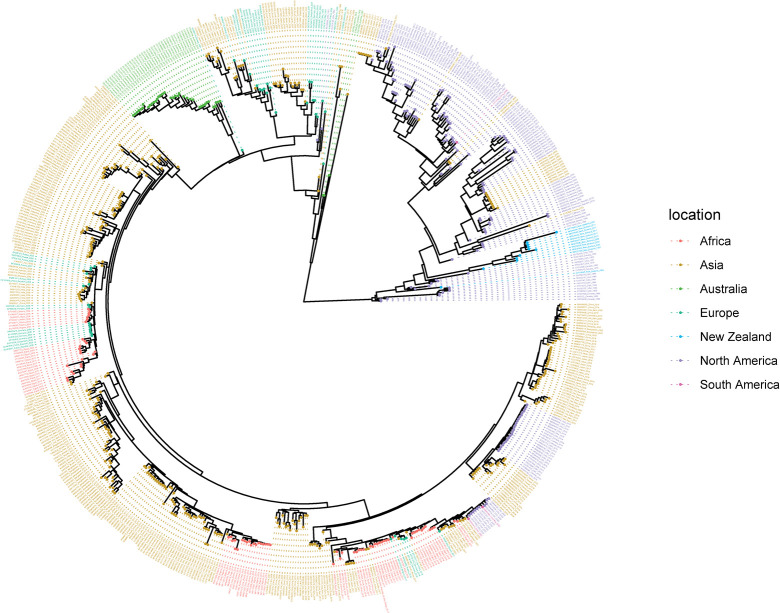
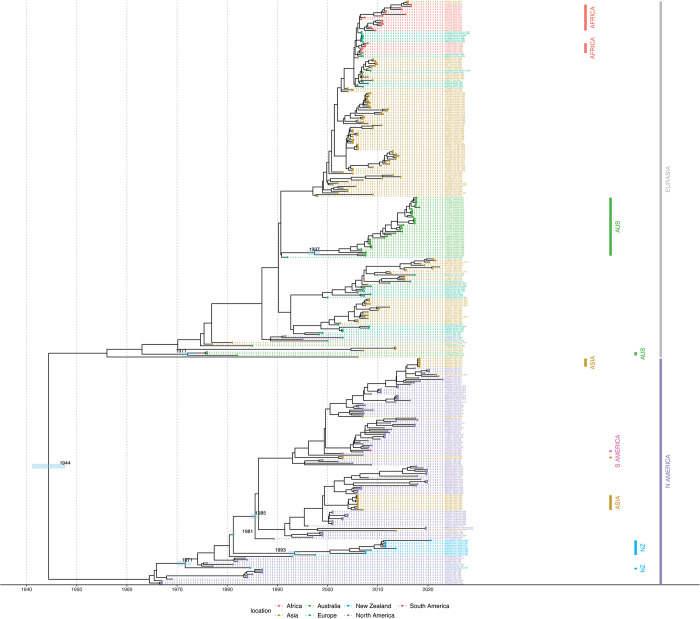
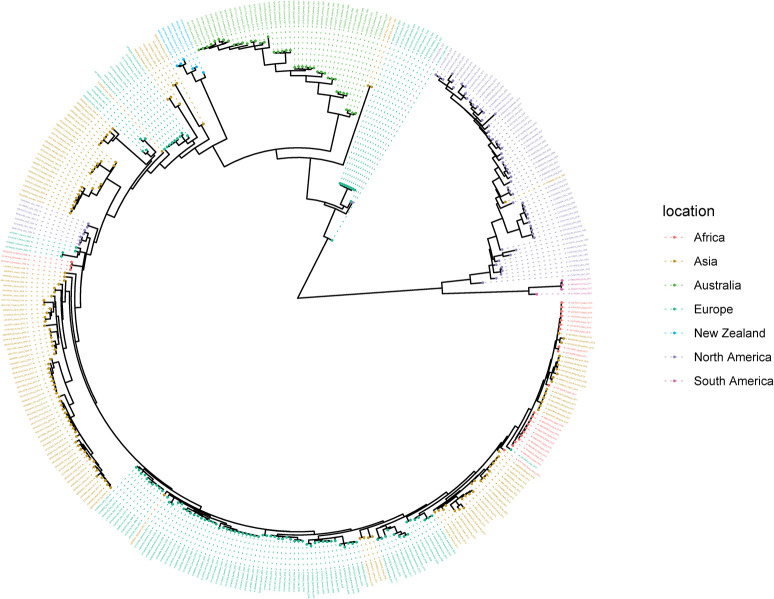
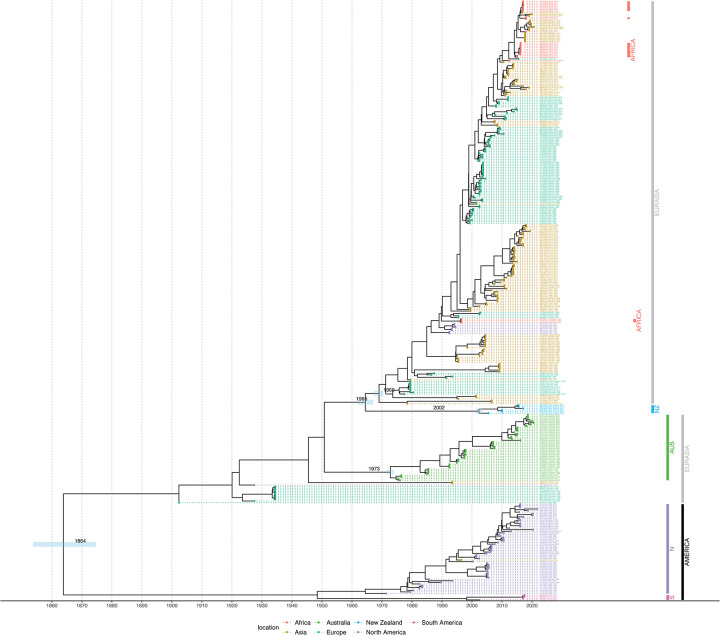
The rapid spread of highly pathogenic avian influenza (HPAI) A (H5N1) viruses in Southeast Asia in 2004 prompted the New Zealand Ministry for Primary Industries to expand its avian influenza surveillance in wild birds. A total of 18,693 birds were sampled between 2004 and 2020, including migratory shorebirds (in 2004-2009), other coastal species (in 2009-2010), and resident waterfowl (in 2004-2020). No avian influenza viruses (AIVs) were isolated from cloacal or oropharyngeal samples from migratory shorebirds or resident coastal species. Two samples from red knots (Calidris canutus) tested positive by influenza A RT-qPCR, but virus could not be isolated and no further characterization could be undertaken. In contrast, 6179 samples from 15,740 mallards (Anas platyrhynchos) tested positive by influenza A RT-qPCR. Of these, 344 were positive for H5 and 51 for H7. All H5 and H7 viruses detected were of low pathogenicity confirmed by a lack of multiple basic amino acids at the hemagglutinin (HA) cleavage site. Twenty H5 viruses (six different neuraminidase [NA] subtypes) and 10 H7 viruses (two different NA subtypes) were propagated and characterized genetically. From H5- or H7-negative samples that tested positive by influenza A RT-qPCR, 326 AIVs were isolated, representing 41 HA/NA combinations. The most frequently isolated subtypes were H4N6, H3N8, H3N2, and H10N3. Multivariable logistic regression analysis of the relations between the location and year of sampling, and presence of AIV in individual waterfowl showed that the AIV risk at a given location varied from year to year. The H5 and H7 isolates both formed monophyletic HA groups. The H5 viruses were most closely related to North American lineages, whereas the H7 viruses formed a sister cluster relationship with wild bird viruses of the Eurasian and Australian lineages. Bayesian analysis indicates that the H5 and H7 viruses have circulated in resident mallards in New Zealand for some time. Correspondingly, we found limited evidence of influenza viruses in the major migratory bird populations visiting New Zealand. Findings suggest a low probability of introduction of HPAI viruses via long-distance bird migration and a unique epidemiology of AIV in New Zealand.
Copyright: © 2024 Stanislawek et al. This is an open access article distributed under the terms of the Creative Commons Attribution License, which permits unrestricted use, distribution, and reproduction in any medium, provided the original author and source are credited.
Conflict of interest statement
The authors have declared that no competing interests exist.
Figures
Similar articles
-
Genetic and antigenic characterization of H5 and H7 avian influenza viruses isolated from migratory waterfowl in Mongolia from 2017 to 2019.Virus Genes. 2020 Aug;56(4):472-479. doi: 10.1007/s11262-020-01764-2. Epub 2020 May 19. Virus Genes. 2020. PMID: 32430568 Free PMC article.
-
Isolation and Genetic Characterization of Avian Influenza Viruses Isolated from Wild Birds in the Azov-Black Sea Region of Ukraine (2001-2012).Avian Dis. 2016 May;60(1 Suppl):365-77. doi: 10.1637/11114-050115-Reg. Avian Dis. 2016. PMID: 27309081
-
Epidemiology and molecular characterization of avian influenza A viruses H5N1 and H3N8 subtypes in poultry farms and live bird markets in Bangladesh.Sci Rep. 2023 May 16;13(1):7912. doi: 10.1038/s41598-023-33814-8. Sci Rep. 2023. PMID: 37193732 Free PMC article.
-
The genetics of highly pathogenic avian influenza viruses of subtype H5 in Germany, 2006-2020.Transbound Emerg Dis. 2021 May;68(3):1136-1150. doi: 10.1111/tbed.13843. Epub 2020 Sep 29. Transbound Emerg Dis. 2021. PMID: 32964686 Review.
-
Highly Pathogenic Avian Influenza Viruses at the Wild-Domestic Bird Interface in Europe: Future Directions for Research and Surveillance.Viruses. 2021 Jan 30;13(2):212. doi: 10.3390/v13020212. Viruses. 2021. PMID: 33573231 Free PMC article. Review.
Cited by
-
Avian Influenza Virus Surveillance Across New Zealand and Its Subantarctic Islands Detects H1N9 in Migratory Shorebirds, but Not 2.3.4.4b HPAI H5N1.Influenza Other Respir Viruses. 2025 Apr;19(4):e70099. doi: 10.1111/irv.70099. Influenza Other Respir Viruses. 2025. PMID: 40148670 Free PMC article.
-
High pathogenicity avian influenza (HPAI) H5N1 virus detected in brown Skua using portable laboratory while at sea in Antarctica.Microbiol Resour Announc. 2025 May 8;14(5):e0004125. doi: 10.1128/mra.00041-25. Epub 2025 Apr 17. Microbiol Resour Announc. 2025. PMID: 40243310 Free PMC article.
-
Avian Influenza: Lessons from Past Outbreaks and an Inventory of Data Sources, Mathematical and AI Models, and Early Warning Systems for Forecasting and Hotspot Detection to Tackle Ongoing Outbreaks.Healthcare (Basel). 2024 Oct 1;12(19):1959. doi: 10.3390/healthcare12191959. Healthcare (Basel). 2024. PMID: 39408139 Free PMC article. Review.
-
High pathogenicity avian influenza (HPAI) H7N6 virus detected in New Zealand poultry.Microbiol Resour Announc. 2025 Jun 12;14(6):e0008825. doi: 10.1128/mra.00088-25. Epub 2025 Apr 29. Microbiol Resour Announc. 2025. PMID: 40298424 Free PMC article.
References
-
- Williams M, Gummer H, Powlesand R, Robertson H, Taylor G. Migrations and movements of birds to New Zealand and surroundings seas. Wellington, New Zealand: Department of Conservation; 2006. Available from: https://www.doc.govt.nz/documents/science-and-technical/sap232.pdf
-
- Melville DS, Battley OF. Shorebirds in New Zealand. Stilt. 2006; 50:269–277. Available from: https://www.doc.govt.nz/documents/science-and-technical/sfc261a.pdf
-
- Riegen AC, Sagar PM. Distribution and numbers of waders in New Zealand, 2005–2019. Notornis. 2020;67(4):591–634.
-
- Gill RE Jr, Piersma T, Hufford G, Servranckx R, Riegen A. Crossing the ultimate ecological barrier: evidence for an 11000-km-long nonstop flight from Alaska to New Zealand and eastern Australia by Bar-tailed Godwits. Condor. 2005;107(1): 1–20. doi: 10.1093/condor/107.1.1 - DOI
MeSH terms
Substances
LinkOut - more resources
Full Text Sources
Medical
