. 2024 Jun 3;20(6):e1012185.
doi: 10.1371/journal.pcbi.1012185. eCollection 2024 Jun.

Data-driven learning of structure augments quantitative prediction of biological responses

Affiliations

Data-driven learning of structure augments quantitative prediction of biological responses

Yuanchi Ha et al. PLoS Comput Biol. .

Abstract

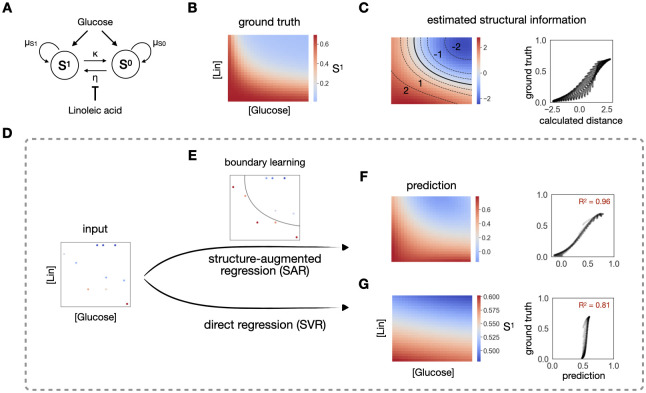
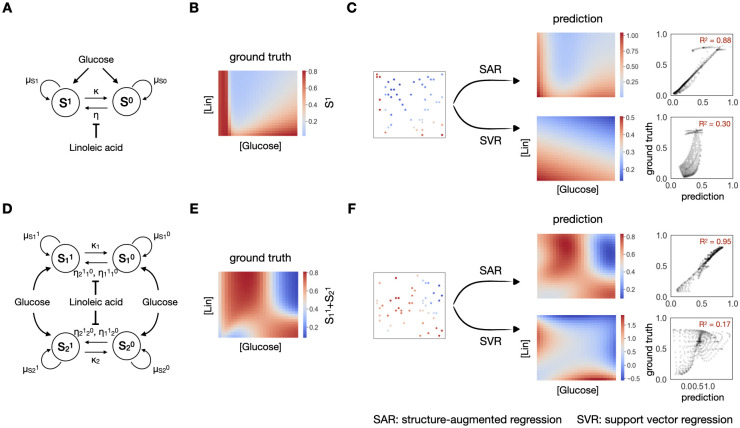
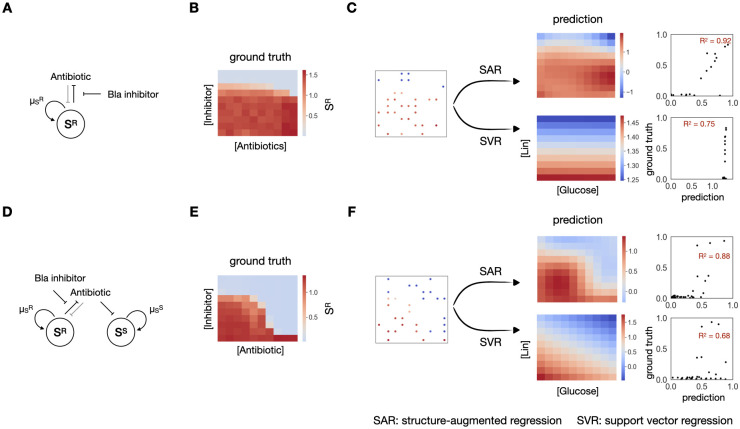
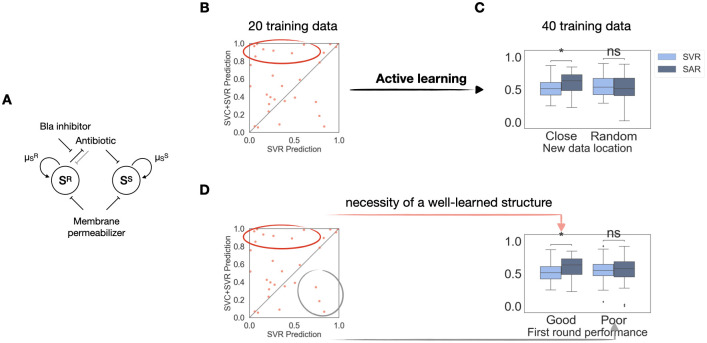
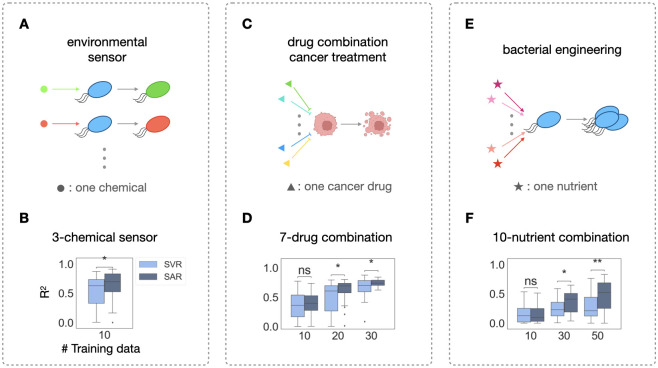
Multi-factor screenings are commonly used in diverse applications in medicine and bioengineering, including optimizing combination drug treatments and microbiome engineering. Despite the advances in high-throughput technologies, large-scale experiments typically remain prohibitively expensive. Here we introduce a machine learning platform, structure-augmented regression (SAR), that exploits the intrinsic structure of each biological system to learn a high-accuracy model with minimal data requirement. Under different environmental perturbations, each biological system exhibits a unique, structured phenotypic response. This structure can be learned based on limited data and once learned, can constrain subsequent quantitative predictions. We demonstrate that SAR requires significantly fewer data comparing to other existing machine-learning methods to achieve a high prediction accuracy, first on simulated data, then on experimental data of various systems and input dimensions. We then show how a learned structure can guide effective design of new experiments. Our approach has implications for predictive control of biological systems and an integration of machine learning prediction and experimental design.


Conflict of interest statement

The authors have declared that no competing interests exist.

Figures

Fig 1
Fig 1. Structure contains rich information for regression.
A. A simple community of a plasmid-carrying population (S1) and a plasmid-free population (S0). S0 acquires the plasmid through conjugation at rate η, becoming S1. S1 reverts to S0 through plasmid loss at rate κ. The conjugation efficiency η is modulated by an inhibitor, linoleic acid (Lin). The growth rates of both populations are modulated by a common nutrient, glucose. B. Heatmap of the final density of S1 under different concentrations of linoleic acid and glucose. It shows a structured monotonically decreasing response from bottom left to top right on the full simulated landscape. C. Demonstration of the rich structural information. The left-hand side is a heatmap of estimated structural information of S1, calculated as the distance between each point and the boundary, across the landscape. The boundary is denoted by the solid black line. Multiple contour lines of the same distance, denoted as dash lines, are highlighted on top of the heatmap. From bottom to top, these calculated distances are -2, -1, -0.5, 0.5, 1 and 2. The contours of -2, -1, 1 and 2 are labeled on the heatmap. The right-hand side is the scatterplot of the calculated distance and the ground truth over the whole landscape, which serves as a more direct comparison between the estimated structural information and the ground truth. D. Comparison of the two regression methods. The left-most panel shows a training set of 10 data points, sampled from the high-resolution growth truth (A). The top flow shows the scheme of the regression constrained by a learned structure (SAR). This strategy first learns the boundary between high and low S1 using a classification method (E). The subsequent regression is constrained by assuming that equal distance from the boundary should have approximately equal output value, in addition to considering the input combinations. This structure-augmented prediction gives an R2 of 0.96 (F). Direct regression (bottom row), which directly maps inputs to the output, gives an R2 of 0.81 (G).
Fig 2
Fig 2. Better performance on simulation data of higher complexity.
A. Another community with one species transferring one plasmid, under modulation of a nutrient, glucose and an inhibitor, linoleic acid (Lin). B. Simulated response of final S1 density in response to changing [glucose] and [Lin]. It shows a sharper transition at bottom left on the full simulated landscape. C. Prediction of the landscape using 50 data points with SAR (top) or SVR (bottom). SAR could capture the sharp transition, shown on the predicted heatmap and reach a R2 of 0.88, while SVR alone fails to do so, reaching a R2 of 0.30. D. A community with two species transferring one plasmid, resulting in four populations, with two carrying and two not carrying the plasmid. E. Simulated response of final S11+S21 density in response to changing [glucose] and [Lin]. It shows a complicated landscape with two boundaries. F. Prediction of the landscape using 50 data points with SAR (top) or SVR (bottom). SAR could capture both boundaries, shown on the predicted heatmap and reach a R2 of 0.95, while SVR alone fails to do so, reaching a R2 of 0.17.
Fig 3
Fig 3. Structural-augmented regression outperforms on 2D experimental data.
A. A β-lactam resistant E. coli community, under modulation of an antibiotics and a Bla inhibitor. B. Experimental results of final SR density in response to changing antibiotics and inhibitor concentrations. The response exhibits a sharp transition as the concentration of the inhibitor changes. C. Prediction of the landscape using 30 data points with SAR (top) or SVR (bottom). SAR could capture the sharp transition, shown on the predicted heatmap and reach a R2 of 0.92, while SVR alone fails to do so, reaching a R2 of 0.75. D. A mixed community consisting of approximately equal fractions of the resistant SR and the sensitive SS populations, under modulation of an antibiotics and a Bla inhibitor. E. Experimental results of final SR density in response to changing antibiotics and inhibitor concentrations. The response exhibits a slightly more complex landscape. F. Prediction of the landscape using 30 data points with SAR (top) or SVR (bottom). SAR could capture the complex landscape better, shown on the predicted heatmap and reach a R2 of 0.88, than SVR alone, which reaches a R2 of 0.68.
Fig 4
Fig 4. Learned structure actively guides further experiments.
A. A mixed E. coli community consisting of approximately equal fractions of the resistant SR and the sensitive SS populations, under modulation of three drugs: a β-lactam antibiotic, a Bla inhibitor and a membrane permeabilizer. B. R2 comparison after the first round of learning. Each dot represents performance of the two methods on one specific training set. The x-axis is the R2 value of the simple regression prediction; the y-axis is the R2 value of the SAR prediction. Majority of the scatter points aggregates above the diagonal line, showing that SAR outperforms the simple regression. C. Active learning needs to take advantage of the learned structure to work. Naive active learning, sampling 20 new points without taking advantage of the learned structure, does not outperform simple regression, as shown by the pair of bar plots on the right. While sampling 20 new points around the best learned boundary, indicated by the dots in the red circle, significantly improves the prediction accuracy. D. A well-learned structure is necessary to assist active learning. When the sampled data are based on the worst learned structures in the second round of data generation, indicated by the dots in the grey circle, SAR does not improve the prediction accuracy. p-value annotation legend: ns: 0.05 < p < = 1.0; *: 0.01 < p < = 0.05; **: 0.001 < p < = 0.01; ***: 0.0001 < p < = 0.001; ****: p< = 0.0001.
Fig 5
Fig 5. Structural-augmented regression for higher-dimensional data prediction.
A. A 3-chemical E. coli sensor. Each chemical induces the bacteria to emit one type of fluorescence. For the ML pipelines, the input of each instance is the concentration combination of all the chemicals and the output is the fluorescence intensity. B. Statistical comparisons of regression and SAR. Given 16 different combinations in total, 10 different results are used to train both methods, with the rest of the data being the testing set. C. A 7-drug combination cancer treatment. Each input is the dose combination of all the drugs and the output is the final cell density (created with BioRender.com). D. Statistical comparisons of regression and SAR. Given 50 different combinations in total, 10, 20 and 30 different results are used to train both methods, with the rest of the data being the testing set. E. A 10-nutrient combination bacterial growth investigation. Each input is the concentration combination of all the nutrients and the output is the final cell density. F. Statistical comparisons of regression and structure-augmented regression. Given 64 different combinations in total, 10, 30 and 50 different results are used to train both methods, with the rest of the data as the testing set. p-value annotation legend: ns: 0.5< p < = 1.0; *: 0.01 < p < = 0.05; **: 0.001 < p < = 0.01; ***: 0.0001 < p < = 0.001.

Similar articles

Cited by

References

    1. Burman E, Bengtsson-Palme J. Microbial community interactions are sensitive to small changes in temperature. Frontiers in Microbiology. 2021. May 21;12. doi: 10.3389/fmicb.2021.672910 - DOI - PMC - PubMed
    1. Smith TP, Mombrikotb S, Ransome E, Kontopoulos D, Pawar S, Bell T. Latent functional diversity may accelerate microbial community responses to temperature fluctuations. eLife. 2022. Nov 29;11. doi: 10.7554/eLife.80867 - DOI - PMC - PubMed
    1. Miksch S, Meiners M, Meyerdierks A, Probandt D, Wegener G, Titschack J, et al.. Bacterial communities in temperate and polar coastal sands are seasonally stable. ISME Communications. 2021. Jun 28;1(1). doi: 10.1038/s43705-021-00028-w - DOI - PMC - PubMed
    1. Kent R, Dixon N. Systematic evaluation of genetic and environmental factors affecting performance of translational riboswitches. ACS Synthetic Biology. 2019. Mar 21;8(4):884–901. doi: 10.1021/acssynbio.9b00017 - DOI - PMC - PubMed
    1. Estrela S, Sanchez-Gorostiaga A, Vila JCC, Sanchez A. Nutrient dominance governs the Assembly of microbial communities in mixed nutrient environments. 2020. Aug 7; doi: 10.1101/2020.08.06.239897 - DOI - PMC - PubMed