. 2024 Sep 1;201(1):48-60.
doi: 10.1093/toxsci/kfae073.

Developmental PFOS exposure alters lung inflammation and barrier integrity in juvenile mice

Affiliations

Developmental PFOS exposure alters lung inflammation and barrier integrity in juvenile mice

Joseph H Lucas et al. Toxicol Sci. .

Abstract

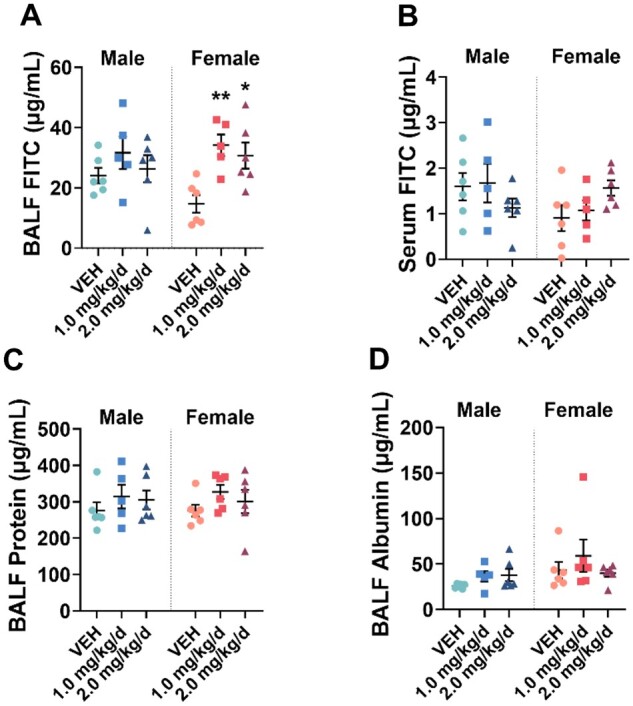
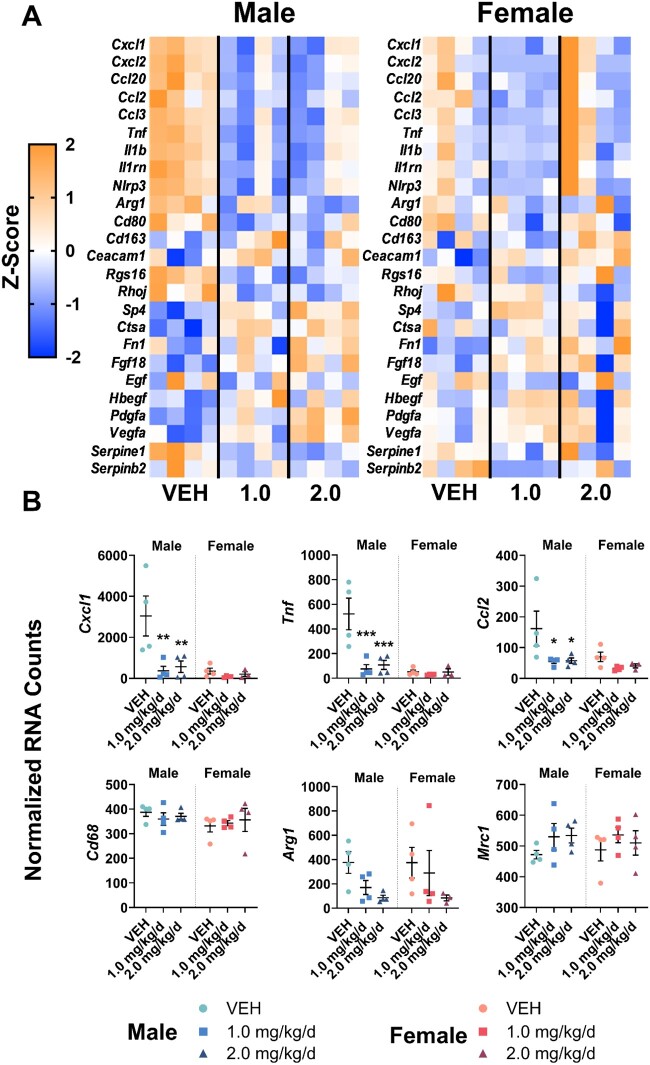
Emerging epidemiological evidence indicates perfluorooctane sulfonic acid (PFOS) is increasingly associated with asthma and respiratory viral infections. Animal studies suggest PFOS disrupts lung development and immuno-inflammatory responses, but little is known about the potential consequences on respiratory health and disease risk. Importantly, PFOS exposure during the critical stages of lung development may increase disease risk later in life. Thus, we hypothesized that developmental PFOS exposure will affect lung inflammation and alveolar/airway development in a sex-dependent manner. To address this knowledge gap, timed pregnant Balb/cJ dams were orally dosed with a PFOS (1.0 or 2.0 mg/kg/d) injected mealworm or a vehicle control daily from gestational day (GD) 0.5 to postnatal day (PND) 21, and offspring were sacrificed at PND 22-23. PFOS-exposed male offspring displayed increased alveolar septa thickness. Occludin was also downregulated in the lungs after PFOS exposure in mice, indicative of barrier dysfunction. BALF macrophages were significantly elevated at 2.0 mg/kg/d PFOS in both sexes compared with vehicles, whereas BALF cytokines (TNF-α, IL-6, KC, MIP-1α, MIP-1β, and MCP-1) were suppressed in PFOS-exposed male offspring compared with vehicle controls. Multiplex nucleic acid hybridization assay showed male-specific downregulation of cytokine gene expression in PFOS-exposed mice compared with vehicle mice. Overall, these results demonstrate PFOS exposure exhibits male-specific adverse effects on lung development and inflammation in juvenile offspring, possibly predisposing them to later-in-life respiratory disease. Further research is required to elucidate the mechanisms underlying the sex-differentiated pulmonary toxicity of PFOS.

Keywords: PFOS; inflammation; pulmonary epithelial barrier; tight junctions.


Conflict of interest statement

The authors declare that they have no known competing financial interests or personal relationships that could have appeared to influence the work reported in this study.

Figures

Fig. 1.
Fig. 1.
Internal PFOS dosimetry and developmental outcomes. (A) Timed pregnant Balb/c dams were exposed from GD 0.5 to PND 21 and the offspring were sacrificed at PND 22-23. The serum and lungs were collected for PFOS quantification by LC-MS. PFOS concentrations were measured in (B) juvenile offspring and dam’s serum, and (C) offspring’s lungs by LC-MS. (D) Serum and lung PFOS levels were plotted for both sexes. (E) Litter size, (F) sex ratio of the offspring, and the (G) weight of the offspring at PND 21. Data are represented as mean±SEM. n = 7 to 8 dams, n = 6 to 8/sex/exposure group. ***P < 0.001 compared with vehicle control.
Fig. 2.
Fig. 2.
Effects of developmental PFOS on pulmonary barrier function. Outside-in permeability was assessed by instilling 4-kDa FITC dextran intratracheally 1 h prior to sacrifice. Fluorescence was measured in the (A) BALF and (B) serum of mice. (C) Protein and (D) mouse albumin were measured in the BALF. Data are presented as mean±SEM, n = 5 to 6/sex/exposure group. *P <0.05, **P <0.01 compared with respective male/female controls.
Fig. 3.
Fig. 3.
Alveolar septa thickness after PFOS exposure. H&E staining of the lungs was conducted. Representative scans (4×) of the whole lung section are shown. Measurement of mean linear intercept (Lm) and alveolar septa thickness (Lmw) were measured in 20× images in ImageJ. Black arrows indicate areas of increased alveolar septa and airway wall thickness. Scale bar = 100 μm. Data are shown as mean±SEM, n = 3 to 5/sex/treatment group. *P < 0.05 compared to VEH.
Fig. 4.
Fig. 4.
Developmental PFOS exposure downregulates junction proteins in the lung. Relative fold changes of occludin and E-cadherin protein levels in (A) male and (B) female mice. Representative blots for the target proteins are shown. Data are shown as mean fold change±SEM, n = 6 to 8/sex/exposure group. *P < 0.05, **P < 0.01 compared with VEH.
Fig. 5.
Fig. 5.
Developmental PFOS did not affect E-cadherin expression in the lungs of mice. The percent positive area of E-cadherin is shown in the alveoli and airways. Representative images are shown. Black arrows indicate E-cadherin stain. Scale bar = 100 μm. Data are shown as mean±SEM, n = 3 to 5/sex/exposure group.
Fig. 6.
Fig. 6.
PFOS reduced occludin expression in the lungs of male mice. The percent positive area of occludin is shown in the alveoli and airways. Representative images are shown. Black arrows indicate occludin staining. Scale bar = 100 μm. Data are shown as mean±SEM, n = 3 to 5/sex/exposure group. *P < 0.05 compared with VEH.
Fig. 7.
Fig. 7.
PFOS elevated macrophage cell counts in the BALF. Total cell counts (A, D), and differential cell counts by Diff-Quik in (B) male and (E) female mice. Differential cell percentages are shown for (C) males and (F) females. Data are shown as mean±SEM, n = 5 to 6/sex/exposure group. *P < 0.05, **P < 0.01, ***P < 0.001 compared with VEH. One outlier (one data point) was removed from panel (E).
Fig. 8.
Fig. 8.
The effects of developmental PFOS exposure on macrophage polarization. The cells positive for CD68 and ARG1 in FFPE lung sections are shown. Black arrows indicate a positive stain. Scale bar = 100 μm. Data are shown as mean±SEM, n = 3 to 5/sex/exposure group.
Fig. 9.
Fig. 9.
Proinflammatory cytokines are downregulated in PFOS-exposed male mice. Differential RNA expression in (A) male and female mice represented as Z-scores relative to respective sex control. (B) Selected gene changes are shown in male and female mice. Data are shown as normalized RNA counts. n = 3 to 4/sex/exposure group. VEH = vehicle control, 1.0 = 1.0 mg/kg/d PFOS, 2.0 = 2.0 mg/kg/d PFOS. *P < 0.05, **P < 0.01, ***P < 0.001 compared with control. One outlier (4 data points) was removed from panel (B).

References

    1. Centers for Disease Control (CDC). 2018. Biomonitoring data tables for environmental chemicals. Atlanta (GA): U.S. Department of Health and Human Services, Public Health Service.
    1. Aghapour M, Raee P, Moghaddam SJ, Hiemstra PS, Heijink IH.. 2018. Airway epithelial barrier dysfunction in chronic obstructive pulmonary disease: role of cigarette smoke exposure. Am J Respir Cell Mol Biol. 58(2):157–169. - PubMed
    1. Anderson JM, Van Itallie CM.. 2009. Physiology and function of the tight junction. Cold Spring Harb Perspect Biol. 1(2):a002584. - PMC - PubMed
    1. Apelberg BJ, Witter FR, Herbstman JB, Calafat AM, Halden RU, Needham LL, Goldman LR.. 2007. Cord serum concentrations of perfluorooctane sulfonate (PFOS) and perfluorooctanoate (PFOA) in relation to weight and size at birth. Environ Health Perspect. 115(11):1670–1676. - PMC - PubMed
    1. Agency for Toxic Substances and Disease Registry (ATSDR). 2018. Toxicological profile for Perfluoroalkyls. Atlanta (GA): U.S. Department of Health and Human Services, Public Health Service. - DOI