. 2024 Aug 13;8(15):3972-3984.
doi: 10.1182/bloodadvances.2023012409.

Inference of genomic lesions from single-cell RNA-seq in myeloma improves functional intraclonal and interclonal analysis

Affiliations

Inference of genomic lesions from single-cell RNA-seq in myeloma improves functional intraclonal and interclonal analysis

Francesca Lazzaroni et al. Blood Adv. .

Abstract

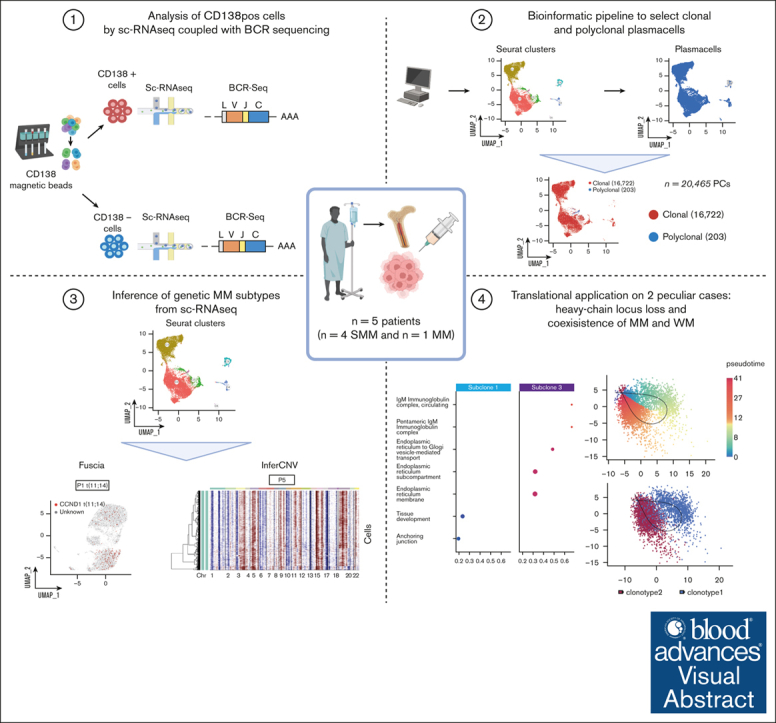
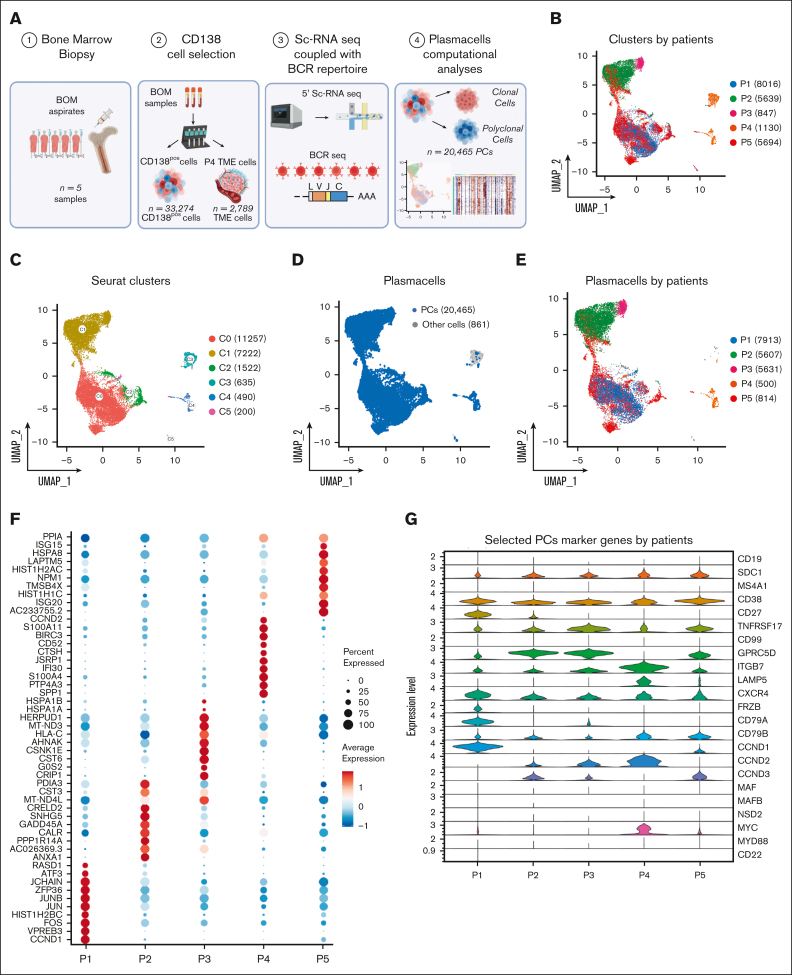
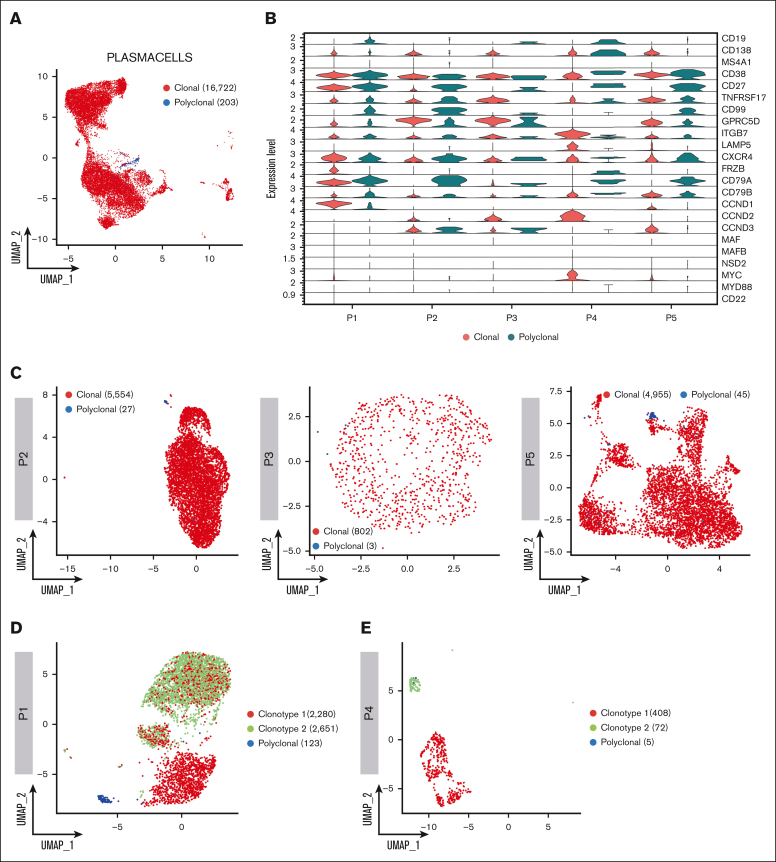
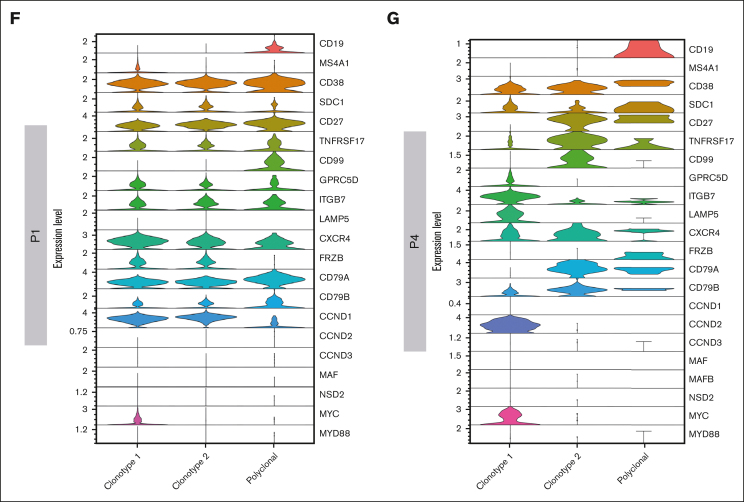
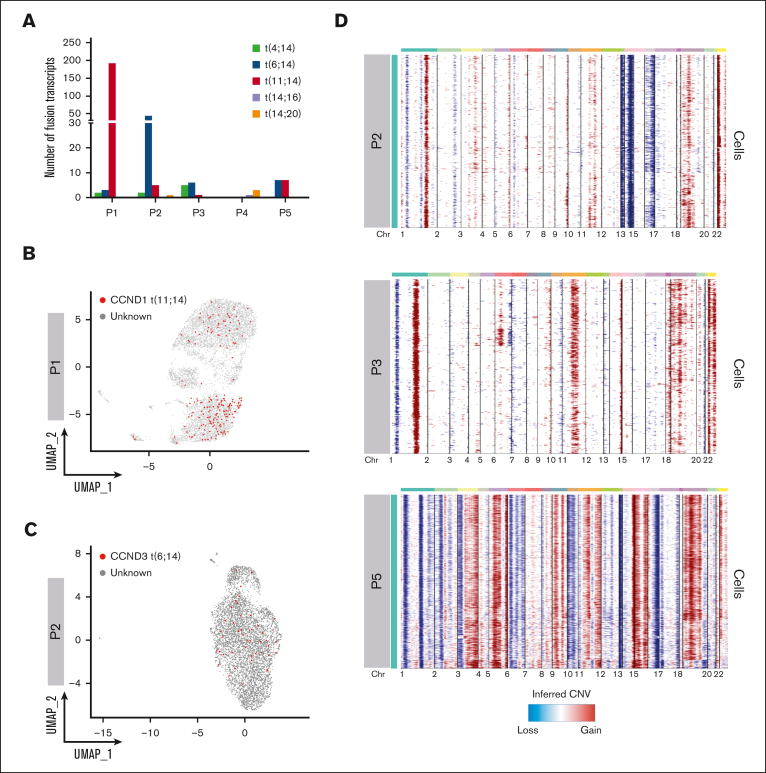
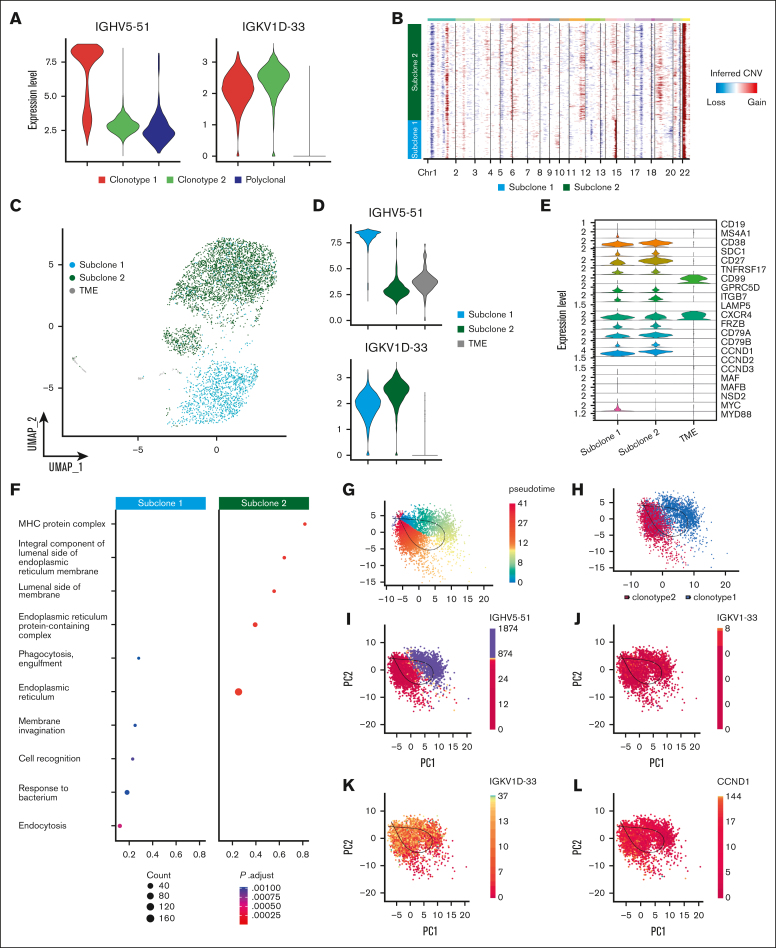
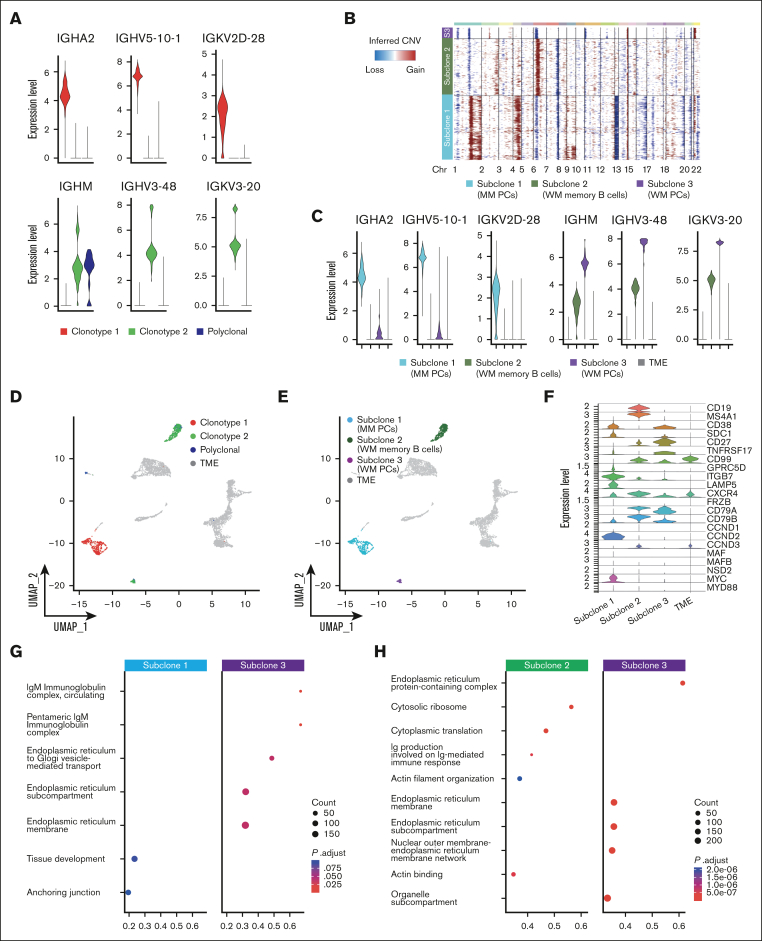
Smoldering multiple myeloma (SMM) is an asymptomatic plasma cell (PC) neoplasm that may evolve with variable frequency into multiple myeloma (MM). SMM is initiated by chromosomal translocations involving the immunoglobulin heavy-chain locus or by hyperdiploidy and evolves through acquisition of additional genetic lesions. In this scenario, we aimed at establishing a reliable analysis pipeline to infer genomic lesions from transcriptomic analysis, by combining single-cell RNA sequencing (scRNA-seq) with B-cell receptor sequencing and copy number abnormality (CNA) analysis to identify clonal PCs at the genetic level along their specific transcriptional landscape. We profiled 20 465 bone marrow PCs derived from 5 patients with SMM/MM and unbiasedly identified clonal and polyclonal PCs. Hyperdiploidy, t(11;14), and t(6;14) were identified at the scRNA level by analysis of chimeric reads. Subclone functional analysis was improved by combining transcriptome with CNA analysis. As examples, we illustrate the different functional properties of a light-chain escape subclone in SMM and of different B-cell and PC subclones in a patient affected by Wäldenstrom macroglobulinemia and SMM. Overall, our data provide a proof of principle for inference of clinically relevant genotypic data from scRNA-seq, which in turn will refine functional annotation of the clonal architecture of PC dyscrasias.


Conflict of interest statement

Conflict-of-interest disclosure: N.B. received honoraria from Amgen, GlaxoSmithKline (GSK), Janssen, Jazz, Pfizer, and Takeda. M.C.D.V. served on advisory board for Takeda; and speakers bureau for Janssen and GSK. F.P. received honoraria during the last 2 years for lectures from Novartis, Bristol Myers Squibb, AbbVie, GSK, Janssen, and AOP Orphan; and advisory boards fees from Novartis, Bristol Myers Squibb/Celgene, GSK, AbbVie, AOP Orphan, Janssen, Karyopharm, Kyowa Kirin and MEI, Sumitomo, and Kartos. The remaining authors declare no competing financial interests.

Figures

None
Graphical abstract
Figure 1.
Figure 1.
The landscape of SMM and MM PCs at single-cell resolution. (A) Overview of cohort of SMM and MM patients and experimental setup of the study, including CD138 sorting of PCs, 5' scRNA-seq coupled with BCR profiling and bioinformatic pipelines. (B-C) UMAP representation of analyzed cells by patients and by Seurat clusters. (D-E) Selection of PCs after cell assignment (D) and clustering of PCs by patients (E). (F) Dot plot of top 10 marker genes by patients. (G) Violin plot showing the normalized expression levels of 23 representative selected marker genes across the 5 patients.
Figure 2.
Figure 2.
Clonotype assignment across patients. (A) UMAP representing the overall of 5 patients’ BCR profiling, in which clonal and polyclonal cells are represented by red and blue dots, respectively. (B) Violin plot showing the normalized expression levels of representative selected marker genes in clonal and polyclonal cells of each patient. (C) UMAP color coded for clonal and polyclonal cells (red and blue dots, respectively) of P2, P3 and P5 patients. (D-E) Dominant clonotypes of P1 and P4 patients represented by UMAP. Dominant clonotypes are represented by red and green dots and the polyclonal cells by blue dots. (F-G) Violin plots showing the expression levels of PCs representative selected marker genes across the clonotypes of P1 and P4 patients, respectively.
Figure 2.
Figure 2.
Clonotype assignment across patients. (A) UMAP representing the overall of 5 patients’ BCR profiling, in which clonal and polyclonal cells are represented by red and blue dots, respectively. (B) Violin plot showing the normalized expression levels of representative selected marker genes in clonal and polyclonal cells of each patient. (C) UMAP color coded for clonal and polyclonal cells (red and blue dots, respectively) of P2, P3 and P5 patients. (D-E) Dominant clonotypes of P1 and P4 patients represented by UMAP. Dominant clonotypes are represented by red and green dots and the polyclonal cells by blue dots. (F-G) Violin plots showing the expression levels of PCs representative selected marker genes across the clonotypes of P1 and P4 patients, respectively.
Figure 3.
Figure 3.
Geno-transcriptomic inference of MM subtypes by scRNA-seq. (A) Quantification of Fuscia fusion events across patients and translocation types. (B-C) t(11;14) and t(6;14) fusion transcripts mapped on P1 and P2 UMAP, respectively. The cells characterized by fusion transcripts are highlighted by red dots. (D) CNAs analysis of exemplary patients P2, P3, and P5, not characterized by different dominant clonotypes.
Figure 4.
Figure 4.
Heavy-chain locus loss characterization. (A) Violin plot of 2 MM BCR clonotypes of sample P1, representing the expression of heavy and light chains in each clonotype. Clonotype 1 is represented in red, clonotype 2 in green, and polyclonal cells in blue. (B) CNAs inferred by inferCNV pipeline, to define functional differences between the 2 tumor clonotypes. Subclone 1 is represented in light blue and subclone 2 in green. (C) Color coded map of subclones distribution in the UMAP space, with the same color code of panel B. Tumor microenvironment (TME) is shown in gray. (D) Violin plot representing the expression of heavy and light chain in each subclone. (E) Analysis of marker genes by subclone is represented by violin plots. (F) Pathway enrichment analysis, comparing the transcriptional profiles of CNAs subclones, (.1 as P value cutoff; Padjusted (Padj) method by Benjamini-Hochberg; see “Materials and Methods”). (G-K) After normalization and projection on a reduced-dimensional space (using UMAP), the cells were colored by pseudotime inference (G), clonotype origin (H), IGHV5-51 gene expression (I), IGKV1-33 gene expression (J), IGKV1D-33 gene expression (K) and CCND1 gene expression (L). Each model is fitted using the trajectory inferred by slingshot.
Figure 5.
Figure 5.
PCs and B cells in SMM and WM of patient P4. (A) Violin plot of BCR clonotypes of sample P4, representing the expression of heavy and light chains in each clonotype of SMM and WM cells. Clonotype 1 is represented in red, clonotype 2 in green, and polyclonal cells in blue. (B) CNAs analyzed by InferCNV pipeline, defining 3 different clonotypes: subclone 1 (MM PCs) is represented in light blue, subclone 2 (WM memory B cells) in green, and subclone 3 (WM PCs) in violet. (C) Violin plot representing the expression of heavy and light chain in each MM and WM subclones and in TME, represented in gray. (D-E) Color coded map of clonotypes and MM and WM subclones distribution in the UMAP space, with the same color code of panel B. TME is shown in gray. (F) Violin plot showing the expression of selected marker genes by subclones. (G-H) Pathway enrichment analysis, showing the comparison of transcriptional profiles of MM PCs vs WM PCs (G) and WM memory B cells vs WM PCs (H) (.1 as P value cutoff; Padj method by Benjamini-Hochberg; see “Materials and Methods”).

References

    1. Kyle RA, Therneau TM, Rajkumar SV, et al. A long-term study of prognosis in monoclonal gammopathy of undetermined significance. N Engl J Med. 2002;346(8):564–569. - PubMed
    1. Rajkumar SV, Landgren O, Mateos M-V. Smoldering multiple myeloma. Blood. 2015;125(20):3069–3075. - PMC - PubMed
    1. Da Vià MC, Ziccheddu B, Maeda A, Bagnoli F, Perrone G, Bolli N. A journey through myeloma evolution: from the normal plasma cell to disease complexity. Hemasphere. 2020;4(6) - PMC - PubMed
    1. Morgan GJ, Walker BA, Davies FE. The genetic architecture of multiple myeloma. Nat Rev Cancer. 2012;12(5):335–348. - PubMed
    1. Maura F, Bolli N, Rustad EH, Hultcrantz M, Munshi N, Landgren O. Moving from cancer burden to cancer genomics for smoldering myeloma: a review. JAMA Oncol. 2020;6(3):425–432. - PMC - PubMed

Publication types